
Oil may have seen a trend change but confirmation is first required.
Summary: The structure is complete, but a trend change is not yet confirmed by a channel breach. If price breaks below the blue channel, then look for a throwback to find resistance at the blue line. That may offer a good opportunity to join a downwards trend.
New updates to this analysis are in bold
MONTHLY ELLIOTT WAVE COUNT
Click chart to enlarge.
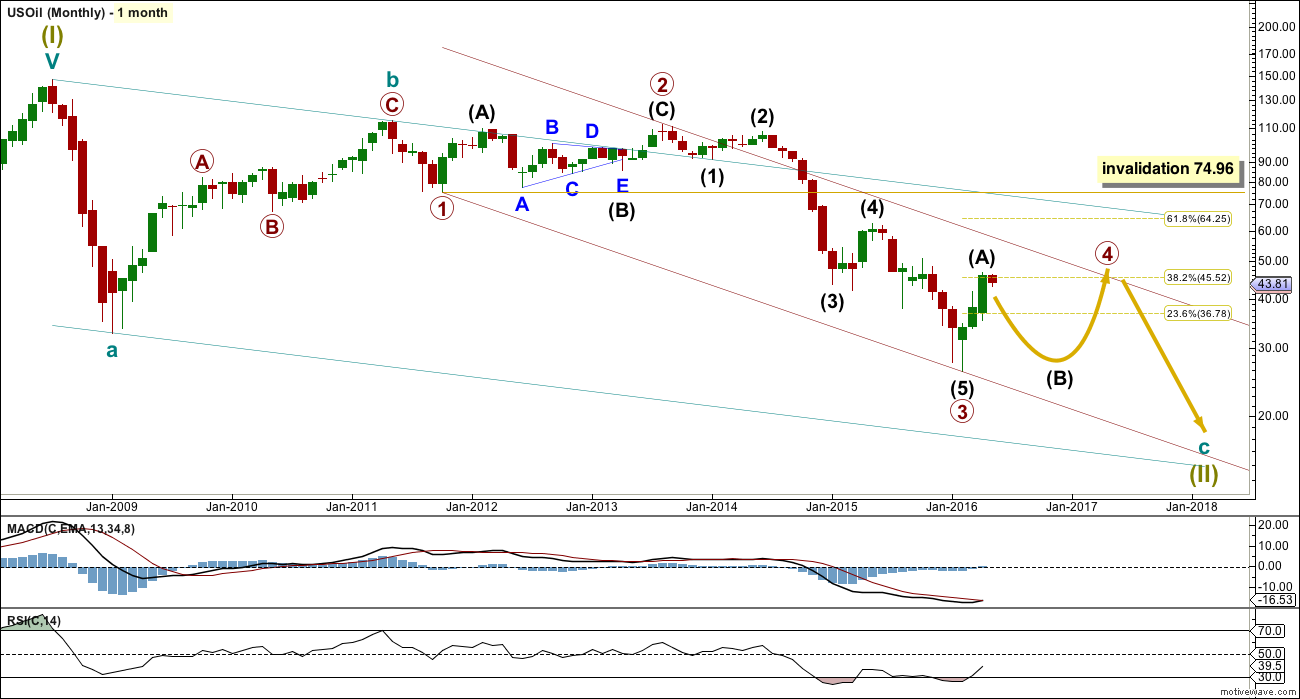
Within the bear market, cycle wave b is seen as ending earlier, in May 2011. Thereafter, a five wave structure downwards for cycle wave c begins.
Primary wave 1 is a short impulse lasting five months. Primary wave 2 is a very deep 0.94 zigzag lasting 22 months. Primary wave 3 is a complete impulse with no Fibonacci ratio to primary wave 1. It lasted 30 months.
Primary wave 4 is likely to exhibit alternation with primary wave 2. Primary wave 4 is most likely to be a flat, combination or triangle. Within all of these types of structures, the first movement subdivides as a three.
Primary wave 4 is likely to end within the price territory of the fourth wave of one lesser degree; intermediate wave (4) has its range from 42.03 to 62.58.
Primary wave 4 may end if price comes up to touch the upper edge of the maroon channel.
Primary wave 4 is most likely to be shallow to exhibit alternation in depth with primary wave 2. The 0.382 Fibonacci ratio at 45.52 is within the price range of intermediate wave (4), so this is the most likely target.
Primary wave 4 may not move into primary wave 1 price territory above 74.96.
DAILY ELLIOTT WAVE COUNT
Click chart to enlarge.
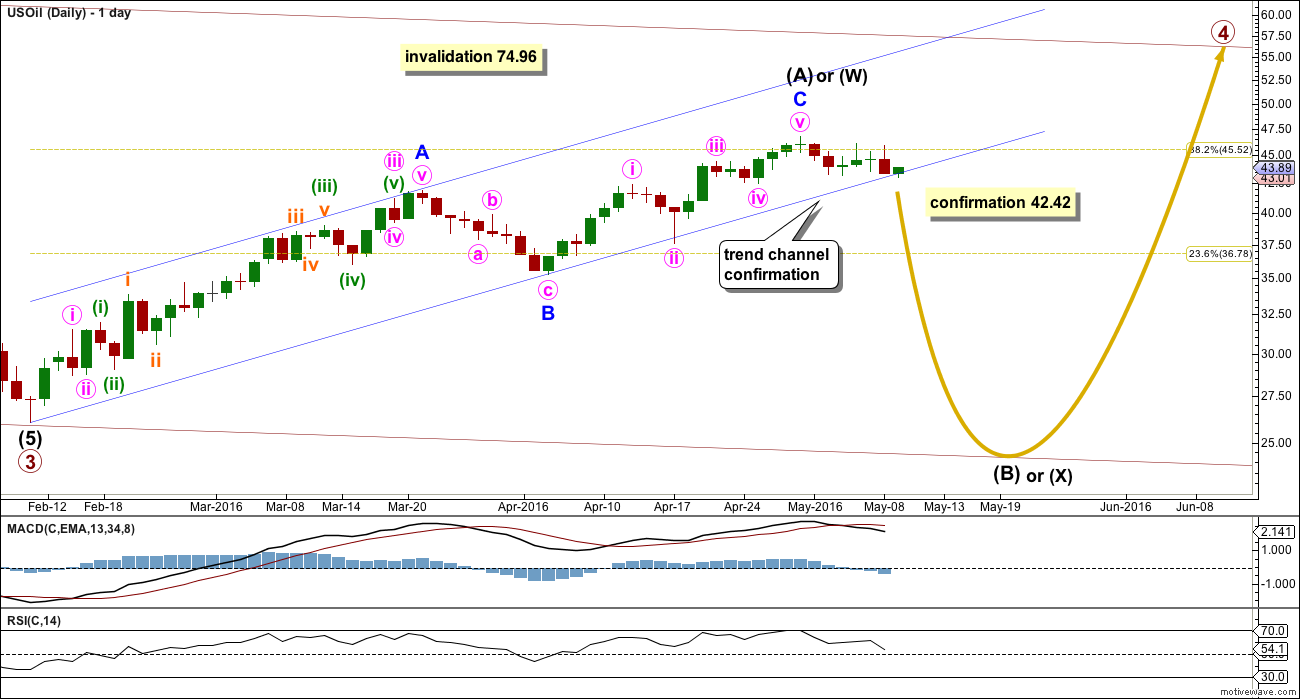
Intermediate wave (A) may now be complete. There is no Fibonacci ratio between minor waves A and C.
The structure of minor wave C now looks complete. A new low below 42.42 could not be a continuation of minute wave iv because it may not move into minute wave i price territory. A new low below 42.42 would provide price confirmation of a trend change.
A breach of the blue channel about the zigzag of intermediate wave (A) would provide trend channel confirmation of a trend change. After the lower blue line is breached, then expect it is likely that price will bounce up to find resistance at the lower trend line for a throwback.
Primary wave 4 may be either a flat, combination or triangle.
If primary wave 4 is a flat, then within it intermediate wave (A) is a three and intermediate wave (B) must retrace a minimum 0.9 length of intermediate wave (A). A flat would require a minimum downwards movement to 28.13 or below. Intermediate wave (B) may make a new low below the start of intermediate wave (A) at 26.06 as in an expanded flat. There is no lower invalidation point for a flat correction.
If primary wave 4 is a triangle, then within it intermediate wave (A) is a three and intermediate wave (B) has no minimum or maximum requirement. Intermediate wave (B) may make a new low below the start of intermediate wave (A) as in a running triangle. A triangle would see sideways movement in an ever decreasing range for a few months.
If primary wave 4 is a combination, then the first structure would be a zigzag labelled intermediate wave (W). The double would be joined by a three in the opposite direction labelled intermediate wave (X). Intermediate wave (X) has no minimum nor maximum requirement, and it may make a new low below the start of intermediate wave (W). X waves of combinations are normally deep and most often zigzags, but they may be any corrective structure. A combination would see sideways movement in a large range for a few months.
All three structures now require downwards movement, most likely a zigzag which may make a new low. All three structures expect a reasonably deep wave down, but there is no minimum overall.
Trading Advice:
The next wave down is either a B or an X wave. This may present a trading opportunity at intermediate degree, especially as it is likely to be deep. However, there are more than 23 possible corrective structures this movement may take which means an accurate prediction of the pathway price may take on the way down is impossible. Profits should be taken earlier rather than later. The middle of the movement, a B wave within a B (or X) wave, will be particularly difficult to predict and analyse and will not present a counter trend trading opportunity, so it is best avoided.
The best entry here may be on a throwback to the trend line after it is breached. A target cannot be calculated.
TECHNICAL ANALYSIS
MONTHLY CHART
Click chart to enlarge. Chart courtesy of StockCharts.com.
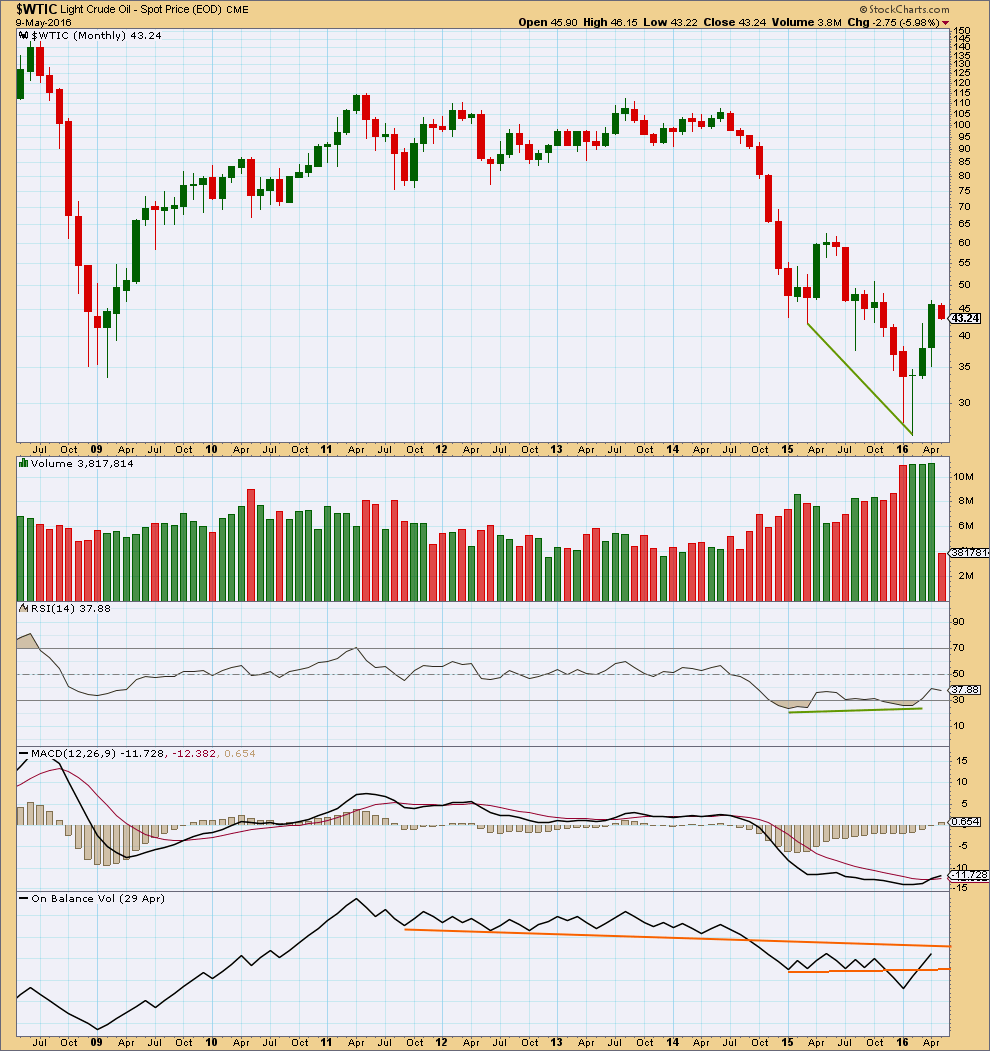
Price shows divergence with RSI as price moved lower.
The fall in price was supported by volume. The rise in price from the low in February is supported by volume. This favours a bullish outlook.
The three monthly candlesticks for January, February and March create a Morning Doji Star reversal pattern. However, this is a warning of a trend change and not definitive. There is an example of a stronger candlestick reversal pattern on this monthly chart for March and April 2015. April 2015 completed a bullish engulfing candlestick pattern; this is the strongest reversal pattern and this example was particularly strong. Yet it only translated to one more month of slight new highs in May before the downwards trend resumed.
On Balance Volume has broken below two trend lines. OBV is breaking above the lower orange line. It may find resistance at the upper orange line which may serve to hold the rise in price here.
DAILY CHART
Click chart to enlarge. Chart courtesy of StockCharts.com.
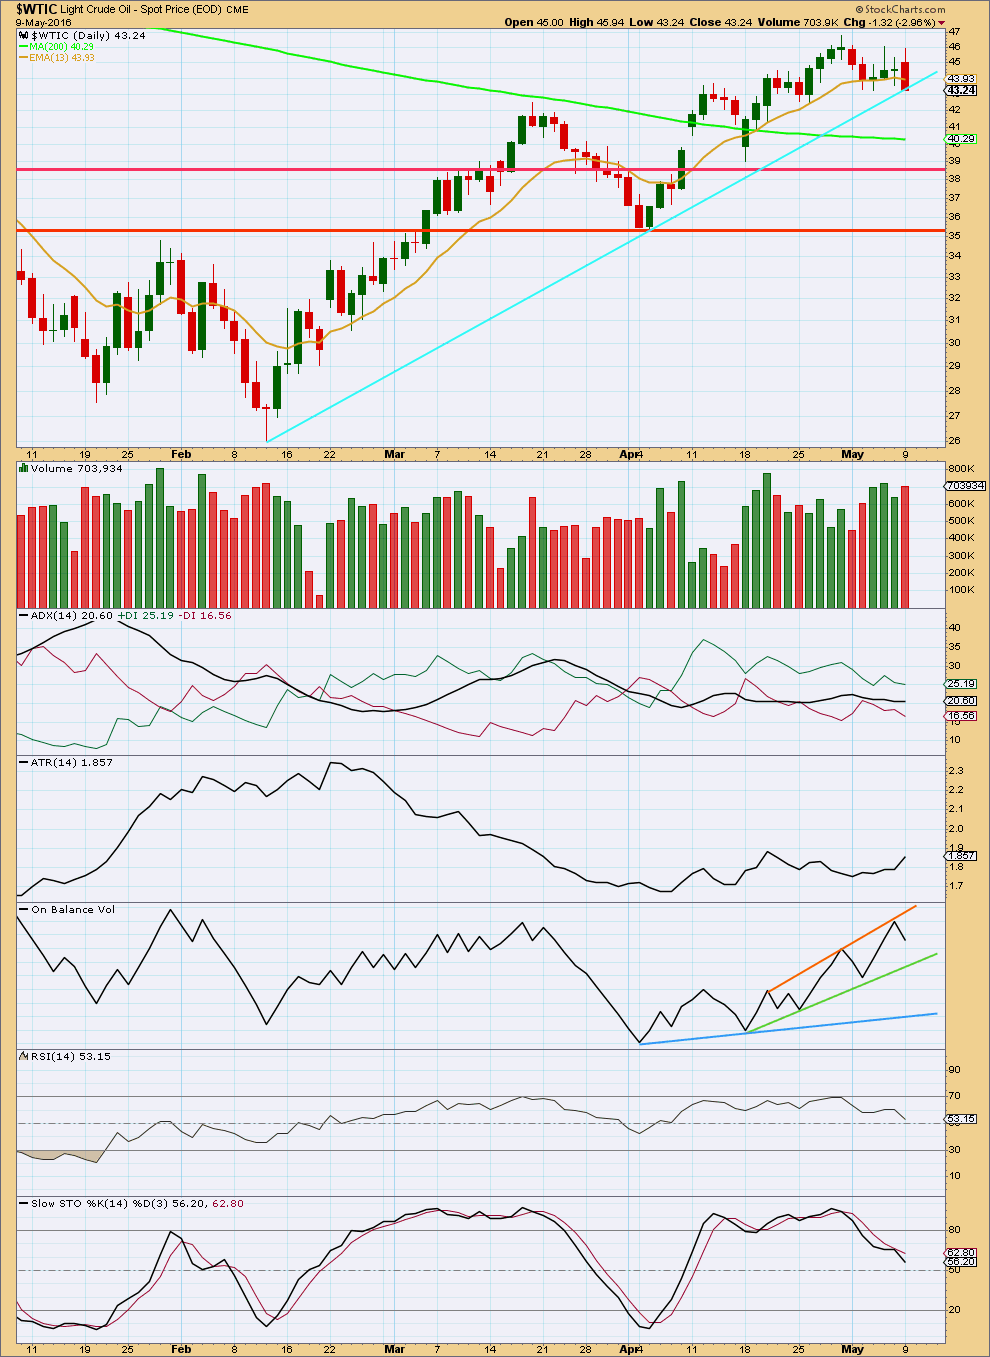
Up to the last high, volume overall declined as price moved upwards. The rise in price was not supported by volume, so it is suspicious.
The small rise in price in the last four days did see some support from volume. The last day has some support for a fall in price.
Overall, the volume profile looks slightly more bearish than bullish.
ADX is flat indicating the market may not be trending. It is not indicating a trend change: the +DX line remains above the -DX line.
ATR is increasing indicating the market may be again trending. These indicators are lagging. Caution is advised when they disagree.
On Balance Volume is constrained within the orange and green lines, but neither are very technically significant as they are too steep and not well tested nor long held. A break below the green line would be a weak bearish signal. A break below the blue line would be a stronger bearish signal. A break above the orange line would be a weak bullish signal.
Overall, the classic technical analysis picture is not very clear for oil. Volume suggests more downward movement but due to the lack of clarity some confirmation is required. A break below the cyan support line would indicate a trend change, and more confidence may be had in it if it comes with a downwards day on strong volume.
This analysis is published @ 04:15 a.m. EST on 10th May, 2016.
Hi Lara are we back to your statement from the 2 May?
Summary: Expect that the trend remains the same, up, while price remains within the dark blue channel. The target remains at 51.09. The structure is incomplete. One more small fourth wave correction along the way up should remain above 42.42.
I’m working on the assumption that minor C will continue to equality with minor A. If this works out, then I suspect that the fun will start in a number of markets including the S&P.
There has been no confirmation of a trend change yet.
At this stage Oil has not made a new high, but the downwards movement from the last high looks like a three wave structure, not a five.
There is no confidence at this stage in a trend change for Oil at intermediate degree.