
Upwards movement continued as per the alternate hourly Elliott wave count.
The channel on the hourly chart remains intact.
Summary: At least one more high is now required to complete the structure. The target is at 1,289. If price keeps going up, then the next target is at 1,297. Upwards movement continues to show weakness indicating this trend is old and will correct.
Trading advice: It is possible that the expected correction may not materialise soon (this has happened before), so a buy the dips approach may be used for more adventurous traders. Each time price touches the lower edge of the channel a long position may be entered with a stop close by just below the lower edge of the channel. If the trend continues for some time, such a long position should become profitable quickly; as soon as the position is profitable and price moves up and away from the channel, move the stop to break even to limit risk. If the channel is breached and the position is negative, the loss should be cut quickly short. At this stage, profits may be taken if price reaches 1,289 or positions may be left to run until the channel is breached. At this stage, stops may be set at just below the channel which is now about 1,280. As always, invest no more than 3-5% of equity on any one trade and always use a stop loss.
New updates to this analysis are in bold.
To see last weekly charts click here.
DAILY ELLIOTT WAVE COUNT
Click chart to enlarge.
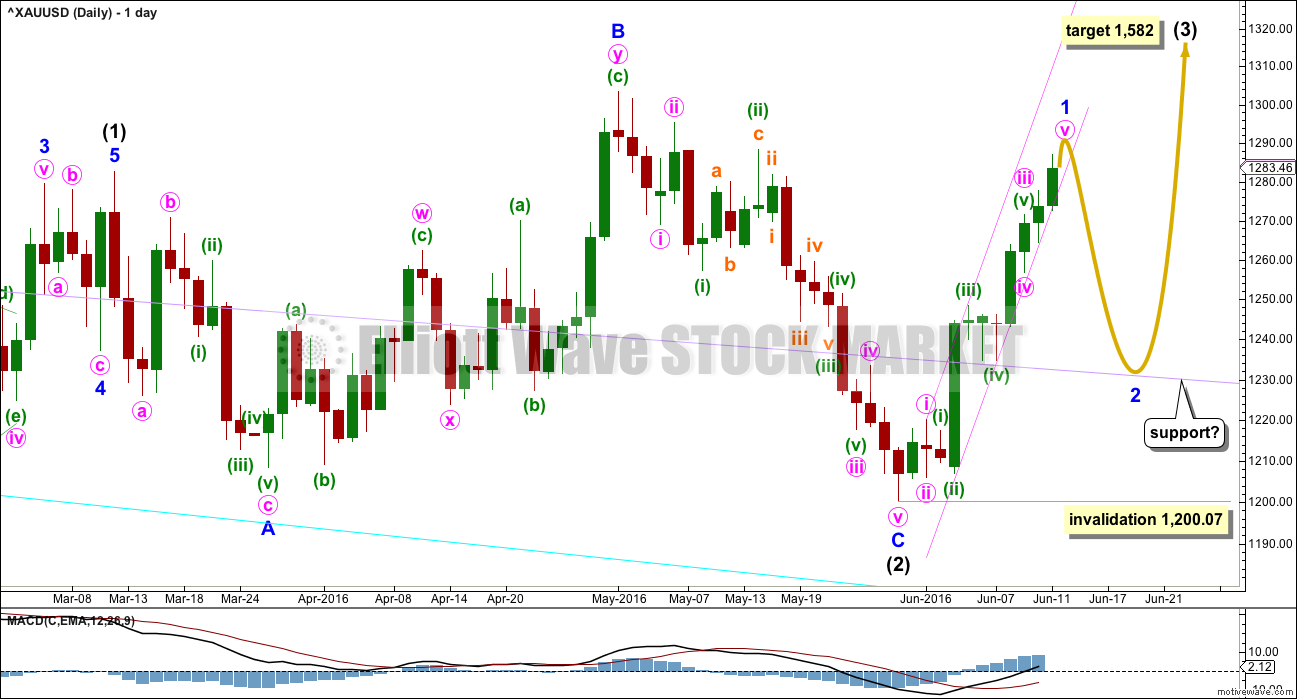
Intermediate wave (2) may be a complete expanded flat correction. It would be a shallow 0.350 correction of intermediate wave (1) lasting 56 days, just one more than a Fibonacci 55. There is no Fibonacci ratio between minor waves A and C. Minor wave C is a complete impulse.
Within intermediate wave (3), no second wave correction may move beyond the start of its first wave below 1,200.07.
When minor wave 1 is complete, then a following second wave correction should unfold and last about one to two weeks. If this wave count is correct, then the upcoming second wave correction may offer an opportunity to join the upwards trend at a good price. If minor wave 2 is deep, then it may find support at the lilac trend line (copied over from the weekly chart). Weekly and daily charts are always on a semi-log scale.
At 1,582 intermediate wave (3) would reach 1.618 the length of intermediate wave (1).
The pink channel is drawn on the daily chart to show exactly how it is drawn. Draw the first trend line from the highs labelled minute waves i to minuette wave (iii), then pull a parallel copy down to sit along all the lows of the last few days. Copy this over carefully to the hourly chart which should be on an arithmetic scale. The lower edge of the channel is perfectly showing where price is finding support for a few days now, so a breach would be a good indication of a trend change for a pullback. This channel is steep, so it should not be expected to hold for much longer.
MAIN HOURLY ELLIOTT WAVE COUNT
Click chart to enlarge.
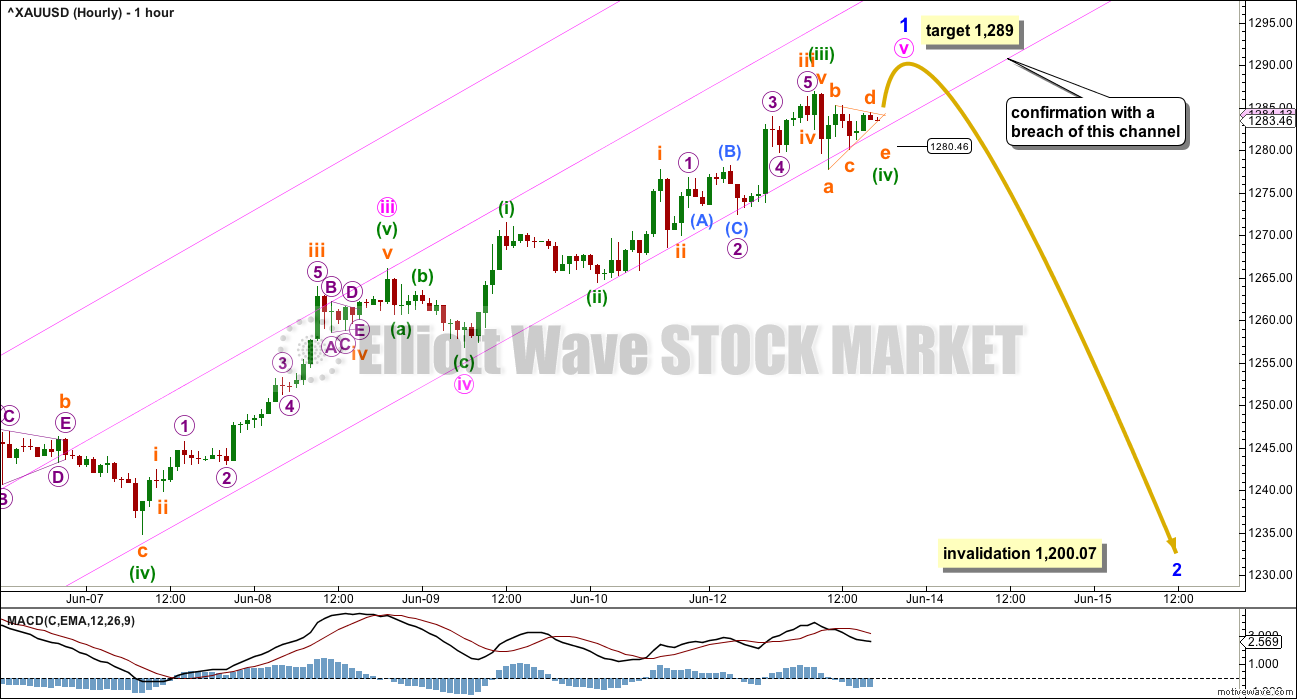
The middle of minute wave iii so far has strongest momentum. This wave count still fits with MACD.
There is no Fibonacci ratio between minute waves i and iii. It is still more likely that minute wave v will exhibit a Fibonacci ratio to either of minute waves i or iii. At 1,289 minute wave v would reach 1.618 the length of minute wave i.
If price keeps going up through this target, then the next target would be about 1,297 where minute wave v would reach 0.618 the length of minute wave iii. This target has a lower probability though because a ratio between minute waves v and i is more likely than a ratio between minute waves v and iii.
So far within minor wave 1 the strongest extension is the third wave. There is double bearish divergence today at the hourly chart level with price and MACD. The fifth wave still does not look like it will be a swift strong extension.
Gold, like all commodities, has a tendency to exhibit strong fifth waves. This tendency commonly turns up at the end of its third wave impulses, not so often at the end of its first wave impulses. It is when price is nearing the end of minor wave 3 within intermediate wave (3) that we may see a blowoff top in Gold, and possibly also the end of intermediate wave (3). For now price is early on in this upwards trend. Gold often will exhibit one to a few more time consuming corrections early on, so that the whole movement has a curved look.
Although it is possible that members may miss out on joining a good upwards trend at this stage, it would still be more likely that minor wave 2 will turn up sooner rather than later and will offer a good entry point. This statement is still based on experience but today is no longer supported by volume.
When the channel is breached by a full hourly candlestick below and not touching the lower edge, preferably by clear downwards (not sideways) movement, then the channel shall be indicating a short term trend change for Gold. At that stage, the 0.618 Fibonacci ratio would be a reasonable target for minor wave 2.
So far minor wave 1 has lasted eleven days. It may not exhibit a Fibonacci ratio or it may continue a further two days to total a Fibonacci thirteen. Minor wave 2 may be expected to last about a Fibonacci five or eight days, or possibly longer.
TECHNICAL ANALYSIS
DAILY CHART
Click chart to enlarge. Chart courtesy of StockCharts.com.
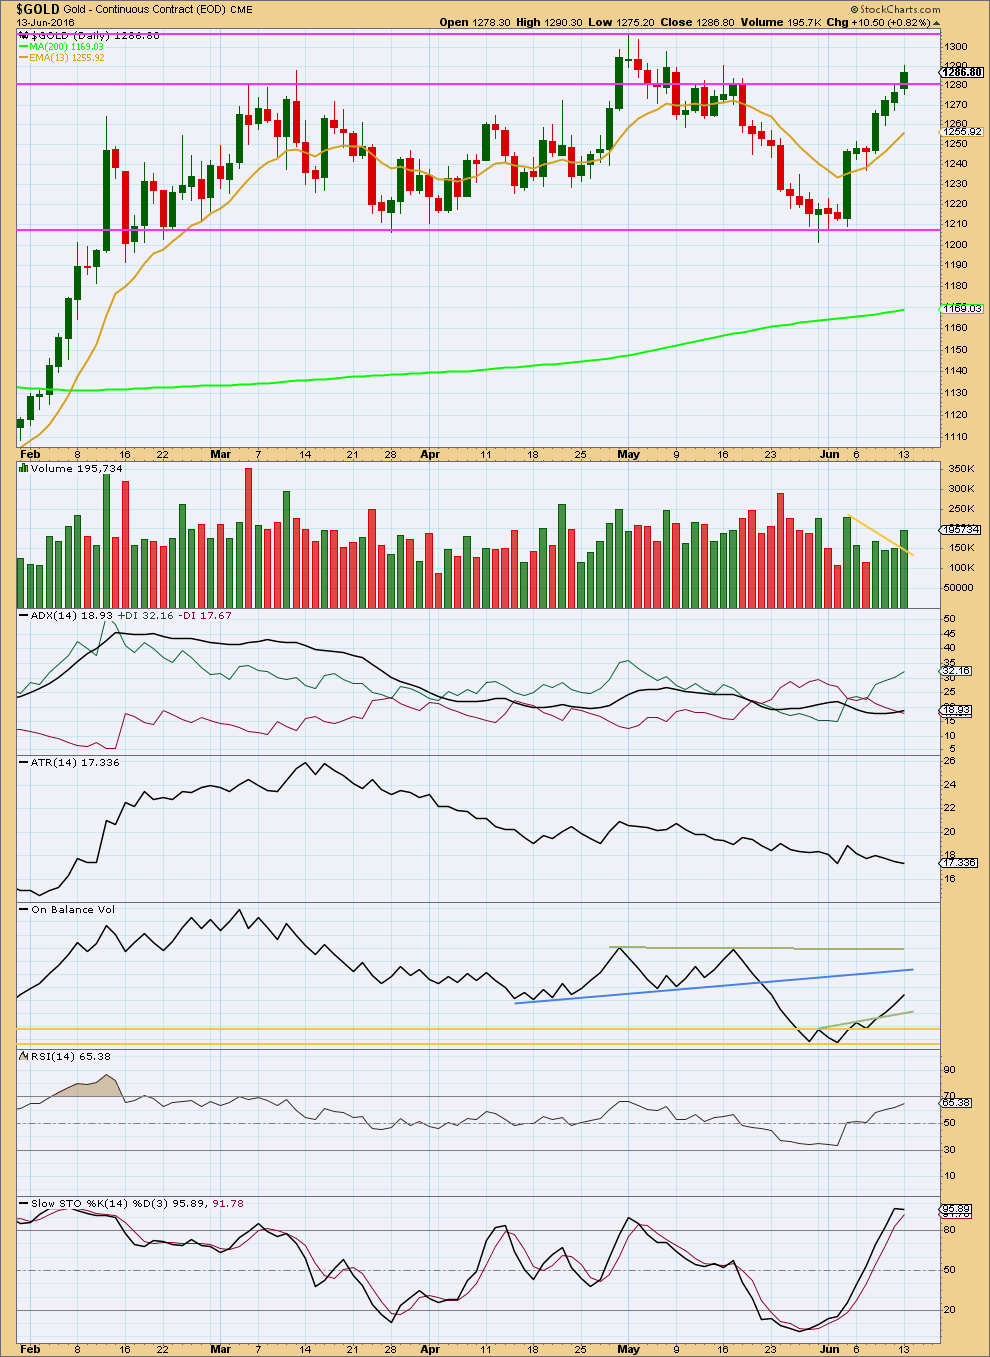
Volume cannot be said to be overall declining today. Volume today is still lighter than the first upwards day of this trend on 3rd June, but price has now been rising for three days on increasing volume. The rise in price is supported by volume.
ADX still indicates an upwards trend is in place.
ATR still disagrees though; it is declining. This indicates some weakness to the upwards trend. Each day the range by which the bulls are able to push up price is declining. Three is still a stalled candlestick pattern in place.
On Balance Volume is bullish. The next trend line to provide resistance is some distance away. There is room yet for price to rise further.
RSI is not yet overbought. There is further room yet for price to rise.
Stochastics is just now entering overbought, but his oscillator may remain extreme during trending periods. The 13 day moving average should be expected to provide support while this trend continues.
This analysis is published @ 06:51 p.m. EST.
I won’t buy anything overnight tonight even DUST.
I think DUST may barely go up if takes 1 to 2 weeks to drop to 1,234.
DUST bottomed last Friday at 9.05 and now is overbought in 195, 78 and 39 minutes EMA/SMA.
Too risky to hold DUST overnight as miners tend to go up a little over time on average with each aggressive “Buy the Dip” of miners.
There isn’t a increasing demand to buy DUST like there has been miners.
Instead of buying DUST I could day trade NUGT on the way down to 1,234.
Updated hourly chart. After the session has closed and I have StockCharts data for volume and RSI then I may develop an alternate too. For now, this is what I have this morning.
Gold has done something unusual, which is more normal for the S&P. It breached it’s channel then turned around and continued in the same direction. Normally for the end of its waves Gold adheres well to channels and normally a breach is a good indicator of a trend change. That didn’t work so well here. That is most frustrating.
If RSI reaches overbought with this last high then that may be it. Price is now finding resistance at the lower edge of the channel. It looks tired and weak.
I’m out, waiting for the trend change. And I won’t trade a correction, I’ll wait patiently for it to end and enter long.
Gold struggles after four-session gain
June 14, 2016 12:46 p.m. ET
http://www.marketwatch.com/story/gold-slips-but-still-underpinned-by-safety-buying-throughout-global-markets-2016-06-14
…. this does not look too good (for the shorts) with Gold price basing off 1280/79 determined to take out 1288-90 likely setting up upside range 1295-1304….
Gold may have just had a 2nd wave retrace up peak at $1,287.57 at 1:41 pm?
Any wave counts or comments?
Hi Richard. Frankly I have no idea how the wave count/s work. I base my trades mostly off support/resistance, parabolic SAR, Fibonacci levels, Stochastic, StochRSI etc….. Lara had pointed out a few days ago about the Three White Soldiers candles which seem to be in play building on moderate upwards steps. At this stage seems unlikely to see Gold price back below 1277/76 for 1264….. I guess Time & Price will tell which way this is headed. Gold price is overbought but seems to have and making room for further upside. An upturn in MacdMA seems to suggest a rally, daily CCI is in bullish territory…. Good luck. (Just my view)
Syed your comments are always informative and appreciated.
It sounds like you have a very interesting and sophisticated trading set up, great for you and your pocketbook.
My wave counts are pretty basic myself.
Alan, if you are still think a new gold high is still needed, than would that be 1,297?
Alan 10:35 am “I’m expecting one more high. I only counted three waves up.”
Lara – “The target is at 1,289. If price keeps going up, then the next target is at 1,297.”
It actually appears that the hourly trend channel has already been breached by more than 1 full hourly candlestick. So how could gold have gone back up to 1289.91 at 9:12 am high and also require another high?
Richard, with the drop below 1284.10, my count has been invalidated. 1289.91 was the high of Minor 1. We are in Minor 2 now. I’m waiting for the rebound before entering short.
Please forgive my question, but if Minor 2 is expected to be a $60 correction when completed, what do you mean by saying, “I’m waiting for the rebound before entering short”.
As always, thank you!
Now in a small 1st wave down then a 2nd wave back up but below the top today then enter short from there.
Yup, Richard answered that perfectly.
I am usually cautious at the start of a new trend. I’ll wait for a rebound before joining the (new) trend. In that way, I don’t need to worry about placing stops and maybe getting stopped out.
Hi Allan.
To what rebound level are you looking to enter short?
Thanks
Hi Marc. I’ll normally check the rebound movement. Of course, if it goes beyond the beginning of the new trend, then the count is wrong. But if all goes right, I simply watch for a reversal of the rebound. I normally use the 0.618 Fib as a guide.
Thanks Allan.
So right now if we don’t go any lower roughly 1285 level?
For your own work do you use any special software or just chart yourself.
Thanks
Hi Marc. I don’t recommend my trading style. It is simplicity itself. I just look at the EW wave and ongoing prices. I don’t use any indicators, at most using only Bollinger bands. That way, I’m not encumbered by having too much information. Most indicators are lagging ones and do not give a clear picture of what is going on in the immediate future.
For the rebound, I may hark Syed’s post above. What if my original premise was correct, that there is still one more wave up? I may just enter a very small position to test the waters.
Alan: My expectation is in the region of a $60 drop.
That will make gold as low and close to invalidation point$1200.
Gold just hit Lara’s target of $1289.
Er. If I’m not wrong, 1289 – 60 = 1229.
But, that high may not be the end yet. I’m expecting one more high. I only counted three waves up.
Can you count again… one more time… please! I’m just kidding of course but am looking forward to Minor 2 beginning!
Lots of people are waiting for that correction to begin.
It would be interesting to see how Gold price reacts to the upper band. The line in the sand if can break above 1293-94 (spot prices); futures high is 1292.95 already and probably will head for a break above 1295 there…..No joy for the bears unless a break below 1276-75 occurs….// Just wondering, what to we look for once the upside is done – a correction or a reversal?
It looks like the triangle is invalidated as price has now fallen below the point labelled subminuette a. (If the triangle is correct, price ought to have rebounded off the a-c line and not dropped).
It is more likely that minuette 4 is a zigzag. Subminuette a is correct. Subminuette b would be where “d” is. This gives it a 3 wave up. Price is now dropping in subminuette c. My current target is 1273.55, where c = 1.272*a. A rebound will then follow for minuette 5 to complete Minor 1.
Update.
Minuette 4 looks to have completed at 1176.41, where c = a. Minuette 5 is now underway.
For gold to drop this week the FED FOMC meeting 2 pm Wednesday Janet Yellen would have to bring back the threats of an interest rate hike soon and signs of strength in the US economy and inflation on target for 2%. I think she won’t announce any actual rate hikes until after the BREXIT vote is over next weekend.
I am expecting a bounce for the S&P this week. I am expecting it may be deep. Perhaps Gold will move down while that happens?
Lara. Guess that would be Minor 2, a most probable deep 0.618 retrace. My expectation is in the region of a $60 drop.
From a fundamental viewpoint, if Brexit comes to pass, then it could be the beginning of the toppling of the dominoes (or the house of cards if you prefer). Other countries may want to leave the EU due to the fear of immigrants from the Middle Eastern regions with the attendant Islamic terrorist worries. This would push the unravelling of the euro and investors would surely seek safe haven in gold (and other stronger currencies). So, good for gold.
If the vote is to stay in the union, then the Fed would be expected to hike interest rates. I’m quite sure this is also bullish for gold. So, we gold traders have a win-win situation.