
More upwards movement was expected for Wednesday’s session to a target at 1,300. Price has moved higher so far reaching 1,296.43.
Summary: The trend is weaker today. A correction does look increasingly likely but pinpointing exactly when and where it will begin is proving very difficult. The target is very slightly changed today to 1,299. One final high is still required to complete the structure.
Trading advice: Any underwater long positions may move stops up to just below the last swing low at 1,278.46. Any positive long positions may take profit if price reaches 1,299. The trend is still up, so no short positions should be entered yet. It is my strong advice today that less experienced members should step aside and wait patiently for clarity. This upwards trend is now very weak, a trend change may come too quickly. Any scalping of the last of this upwards movement is now very risky.
New updates to this analysis are in bold.
To see last weekly charts click here.
DAILY ELLIOTT WAVE COUNT
Click chart to enlarge.
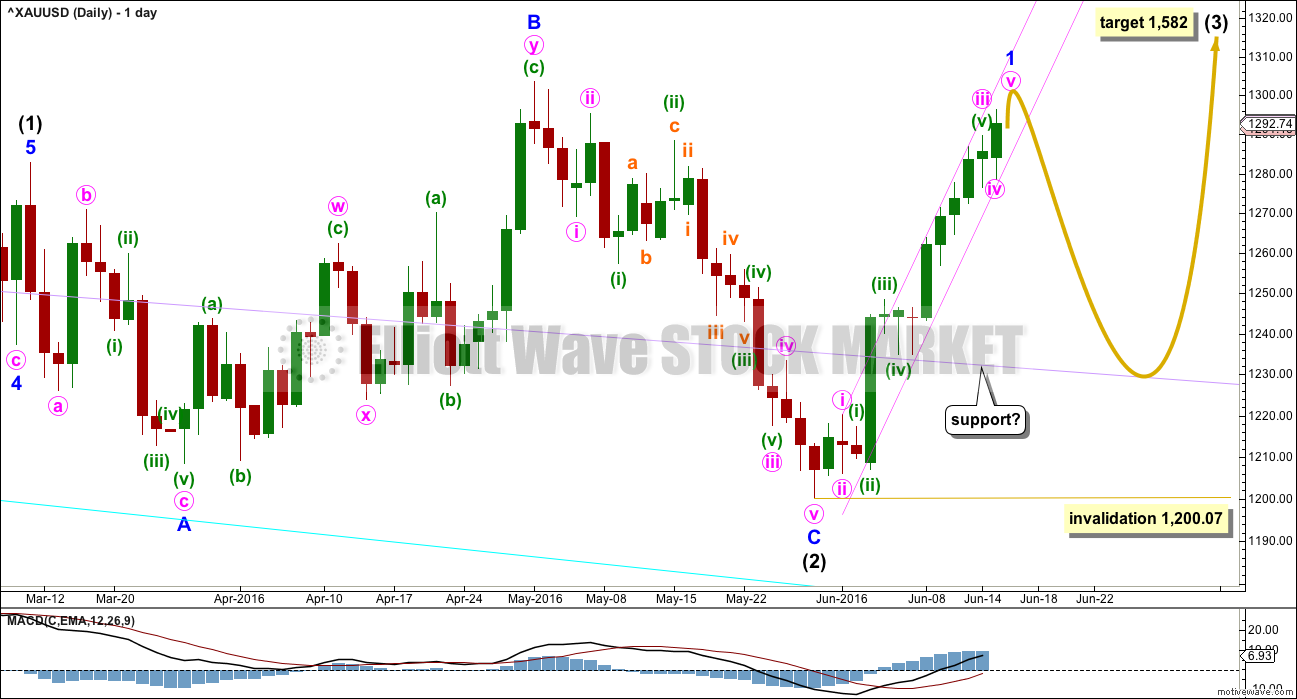
Intermediate wave (2) may be a complete expanded flat correction. It would be a shallow 0.350 correction of intermediate wave (1) lasting 56 days, just one more than a Fibonacci 55. There is no Fibonacci ratio between minor waves A and C. Minor wave C is a complete impulse.
Within intermediate wave (3), no second wave correction may move beyond the start of its first wave below 1,200.07.
When minor wave 1 is complete, then a following second wave correction should unfold and last about one to two weeks. If this wave count is correct, then the upcoming second wave correction may offer an opportunity to join the upwards trend at a good price. If minor wave 2 is deep, then it may find support at the lilac trend line (copied over from the weekly chart). Weekly and daily charts are always on a semi-log scale.
At 1,582 intermediate wave (3) would reach 1.618 the length of intermediate wave (1).
The pink channel is drawn now on the hourly chart. When trying to replicate it perfectly on the daily chart this does not work, probably because the daily chart is on a semi-log scale and the hourly is arithmetic. Use the channel on the hourly chart.
Minor wave 1 has now lasted a Fibonacci thirteen days. It is possible that it could be over at today’s high. That would give minor wave 1 a Fibonacci duration which is fairly common for Gold.
HOURLY ELLIOTT WAVE COUNT
Click chart to enlarge.
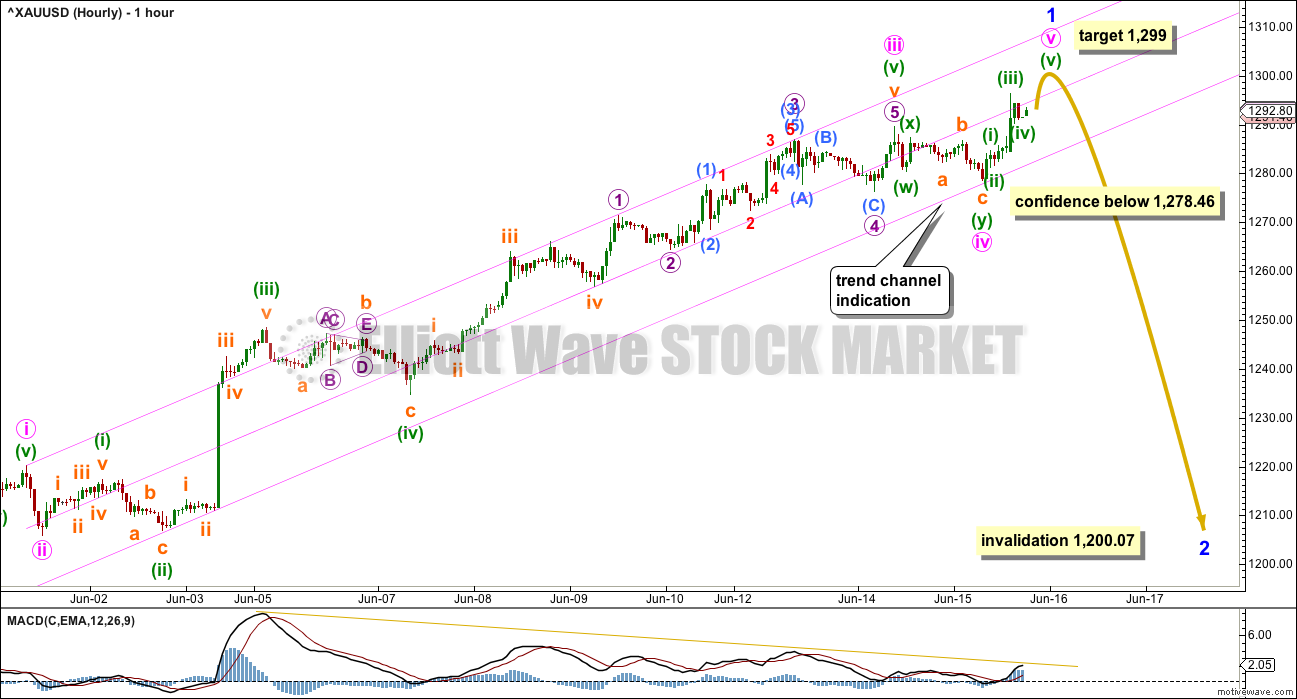
Draw the pink channel from the high labelled minute wave i to the higher labelled micro wave 3. Pull a parallel copy down to sit on the low labelled minuette wave (ii). Downwards movement for minute wave iv found support almost right at the lower edge of the channel, so this channel looks about right.
A clear breach of the lower edge of the channel by at least one full hourly candlestick below and not touching the lower edge, preferably by downwards not sideways movement, would provide trend channel indication now of a trend change.
A new low below 1,278.46 could not be a second wave correction within minute wave v, so at that stage minute wave v would have to be over. This would provide some price confidence in a trend change.
At this stage, the structure of minute wave v may be very close to completion. If only minuette waves (i) through to (iv) are complete within it as labelled, then a final wave for minuette wave (v) may complete the structure. At 1,299 now minute wave v would reach equality in length with minute wave i.
Within minor wave 1, minute wave iii is 1.48 short of 4.236 the length of minute wave i.
Within minute wave iii, there are no Fibonacci ratios between minuette waves (i), (iii), and (v).
Ratios within the extension of minuette wave (v) are: there is no Fibonacci ratio between subminuette waves i and iii, subminuette wave v is 1.04 short of 1.618 the length of subminuette wave iii.
Ratios within the extension of subminuette wave v are: micro wave 3 is 1.18 short of 1.618 the length of micro wave 1, and micro wave 5 is 0.67 short of 0.618 the length of micro wave 3.
When a trend change is indicated by a breach of the pink best fit channel and a new low below 1,278.46, then a Fibonacci retracement should be drawn along the entire length of minor wave 1. The 0.382 and 0.618 Fibonacci ratios will be targets for minor wave 2, with the 0.618 Fibonacci ratio favoured.
Minor wave 2 should last at least a week and probably longer. The earliest expectation would be for it to last a Fibonacci 13 or even 21 days. Second wave corrections are often longer lasting than the first waves they correct, particularly the first second wave correction within a new trend. This did not happen for intermediate wave (2) which was 13 days shorter than intermediate wave (1), so it may happen at minor degree.
TECHNICAL ANALYSIS
DAILY CHART
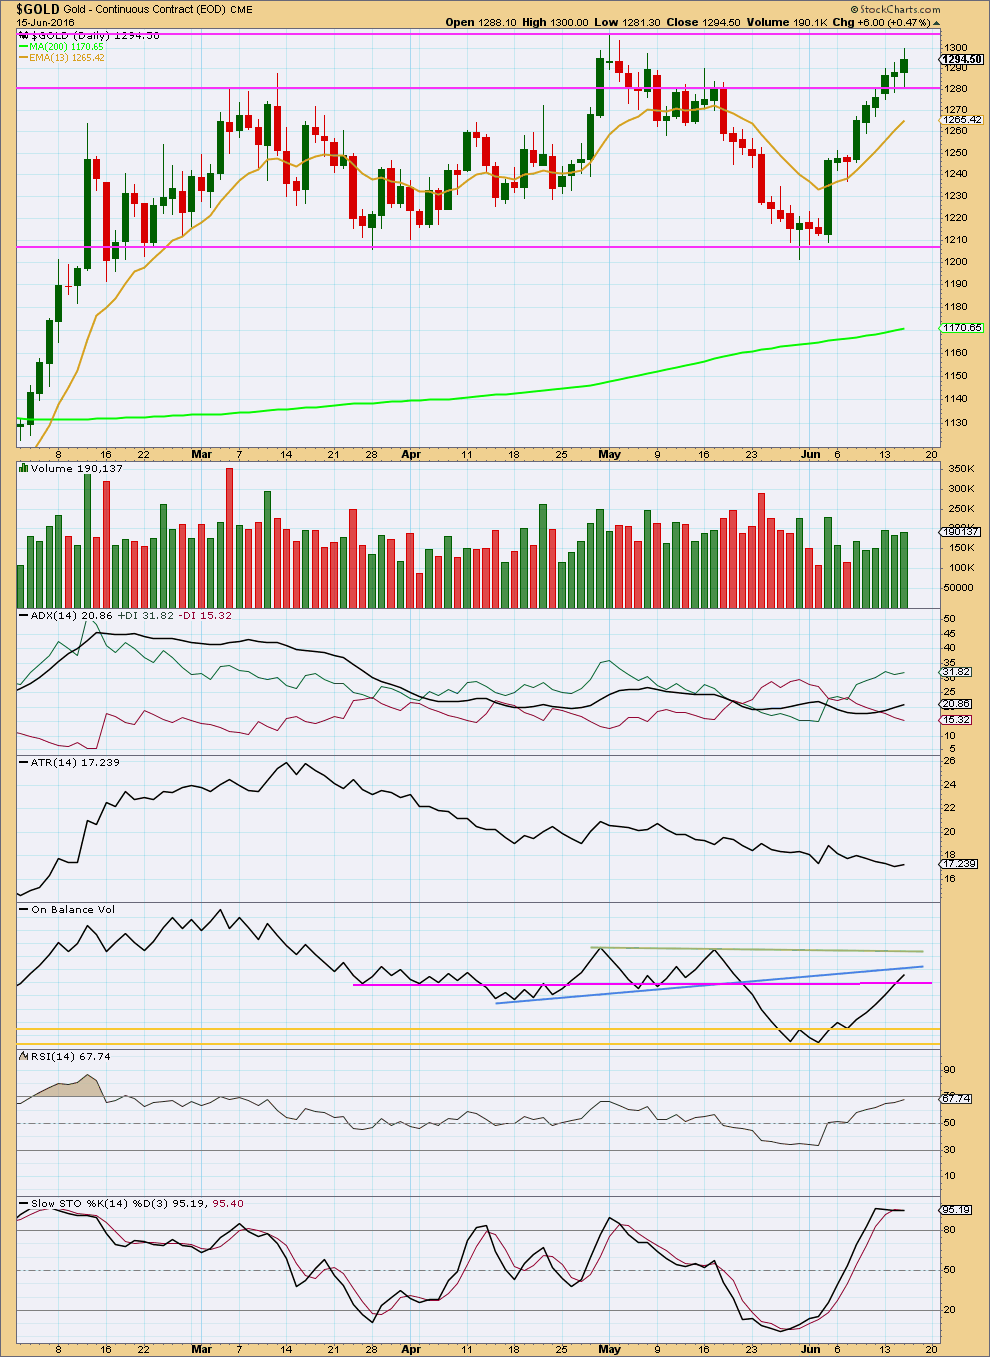
Click chart to enlarge. Chart courtesy of StockCharts.com.
Overall, volume is rising as price moves higher. Volume today was slightly higher than yesterday, but both days have lighter volume than two days prior. The slight decline in volume for these two days indicates a weakening of this trend.
ADX is today still increasing indicating an upwards trend is intact. ATR may be beginning to agree as today it too is increasing, but this is slight and only one day. It needs more to be clear.
On Balance Volume gave another bullish signal today with a break above the pink trend line. The next trend line is very close and may provide some resistance. A break above the blue line would be another bullish signal from OBV.
RSI is not quite yet overbought. One more day of upwards movement to a new high may bring RSI into overbought territory. If that happens, then a trend change should be expected as very likely there.
There is divergence today between price for the last three days making new highs and Stochastics slightly declining. Stochastics may remain extreme for reasonable periods of time during a trending market. Divergence indicates weakness and will not indicate exactly when and where price will turn.
This analysis is published @ 07:30 p.m. EST.
Other STEPHEN- please read my comment of reply to your below response to LARA, Thank You. Stephen, New London, CT. USA
Did gold hit the bottom of the Minor 2, A wave down today of A-B-C wave Minor 2?
I bought a small amount of NUGT just before the close but there was no bounce for me to exit with.
If gold may drop more by or in the Friday morning open I could just sell it in after market tonight.
If gold may move higher Friday early market in a B wave I could sell it there for a profit?
That was a pretty typical blowoff top. Sorry folks, I should have expected that. I didn’t due to all the weakness I could see.
But now it seems pretty clear that’s what it was.
With a big red candlestick I expect now a correction has arrived. It should last AT LEAST a few days, it’s not over yet folks. If price gets down to the 0.618 Fibonacci ratio in coming days at 1,244 then enter long.
When price approaches the 0.382 Fibonacci ratio at 1,271 I’ll be looking at structure and proportion to see if it could be over there.
I’ll also be going back to the last cycle degree wave up from about Jan 2009 and looking at the first several larger corrections in there, how deep were they? what proportions did they have? to see how this new bull wave up may possibly behave.
For now, trading this move down may well be profitable but it is a counter trend move. That’s risky. Be warned; if you try to trade this down take profits quickly if they appear. This move may be choppy and overlapping, it’s a second wave correction not an impulse. Generally not a good trading opportunity, best avoided for all but the experienced.
I’m still waiting patiently.
Just curious if anyone has an opinion on why Gold and the Dollar are moving together this week?
Some say correlations don’t matter.
Correlation does not equal causation.
Correlations come and go, but when markets are correlated it doesn’t tell us which one is leading and which one is following. The math to figure that particular puzzle is beyond my abilities.
Because of the British pound…
Gold and NUGT may have intra day bottomed at 1:58 pm and may bounce for while today as severe drop down $32 for gold.
I just need to say that I’m in absolute disbelief of gold’s action today and applaud Lara, Alan, and Richard for the information that they continually share. Having the fortitude to believe that gold would fall was amazing based on all of the world news, etc…. I bow to Elliott Wave and their team!
Thank you.
Blow off tops are psychologically very risky. They tell us “get in now! you’ve missed heaps of this move and now it’s getting stronger, you’re missing out!”
And they do it right as price turns.
Patience is key.
I have asked you before to please add a postscript to your name as I do . I always(since you came on this site after me) add Stephen, New London CT. or Stephen CT. Can you please do the same (or change your user name? After all if I make some statement or prediction and just sign it Stephen ,then someone might think it is you. And likewise ,I do not want to be necessarily associated with your comments (erudite OR NOT) so please OTHER NEW STEPHEN, read and heed. Thank you, Stephen of New London Connecticut (Home of the Brave).
Please put an identifier after your comments as we are both stephen. stephen of New London CT.
Is the first A wave of wave 1 down almost over at 1:59 pm 1283 low?
Wow what a DUST ride today.
Looks like basing off 1308-07 heading for 1322-23 with no joy for the bears unless a break below 1302 with 1295-94 holding …. Some move up by Gold price today, amazing!
New high of 1314.50 at 10:24.
I think we need a new bullish alternative hourly wave count.
The FED changed things June 3rd and gold didn’t head for 1183 it turned up and hit 1294.68 yesterday.
With FED FOMC not mentioning any date for interest rate hike and gold has been bought up again as safe haven with some serious world issues including BREXIT June 24th could lower world markets if they leave the EURO.
Lara: According to grand super cycle wave count gold is in cycle wave b.
Why not cycle wave iv complete at recent bottom in Jan 2016?
Because this
And this…
Wow… Between the Fed and BoJ, gold is on fire. Looks like we have hit the top of the channel around 1312. If the count is right, the pullback should start from about here.
Just woke up not too long ago after the exciting NUGT trade yesterday. Cursory count: currently in subminuette 5 of minuette 5 of minute 5 of Minor 1. Subminuette 3 was stronger than it should be, hence breaking 1300 level. This upward movement should complete before market opens. I’ll check and give a more up to date count closer to opening hours.
If this is correct, the deep Minor 2 retrace should provide an excellent opportunity to short. At 0.618 Fib, this translates to about $60. Hopefully, investors would look at DUST more favourably and give it a nudge from its lethargic state in the past weeks or so.
Alan that count is reassuring, thanks a lot.
If DUST is cheap like today I may buy a small amount for Minor 2 drop.
The question now becomes: Is 1313.62 the top?
It could be, with a drop and a rebound which very well could be the first two of five waves of Minute A of Minor 2. Then again, could the fifth wave of Minor 1 extend? Probably, if the current rebound exceeds 1313.62, then the question is settled.
Any other ideas?
Alan no new high since overnight high of 1313.62 at 1:48 am so maybe 1312.29 at 9:09 am was wave two of five waves of Minute A of Minor 2 and down goes gold and NUGT? Markets around the world overnight got into safe havens and even the US dollar went up since 6:00 am.
So, my hunch proved correct.
1315.71 could be the end of Minor 1, unless there is further extension. It looks like everyone is favouring a rise in the price of gold, with hardly any letup. This could be a blowoff top.
Kind of quiet around here now….are we all sitting on our hands and watching spot?
Yes. Slow start. Most people favour higher prices, so they are reluctant to admit that a drop is in order. Once the action picks up, you will hear from more of us.
Is it possible we need an alternate Bullish hourly wave count as Gold is at 1,301.43 at 11:05 pm?
I didn’t expect the FED FOMC today to leave out mention of interest rate hike dates.
I guess they want more proof it is the right time and didn’t want to effect BREXIT vote June 23rd.
I wonder if that will effect gold dropping this week?
Yes, we do.
This could be a blowoff top, typical for Gold.
It’s well exceeded the 1,299 target… at 1,312.36 so far 🙁
Gold just exceeded Lara’s target of $1,299 at 9:02 pm and hit a high of $1,300.61 at 9:18 pm EST.
“A clear breach of the lower edge of the channel by at least one full hourly candlestick below and not touching the lower edge, preferably by downwards not sideways movement, would provide trend channel indication now of a trend change.”
Avi Gilburt June 15, 2016 – Are We On The Verge Of A Melt-Up In The Metals Complex Or Are Lower Lows Still Possible?
At bottom of article see link to EW charts GDX, GLD, Silver.
(Article released to his subscribers June 10th.)
http://www.gold-eagle.com/article/are-we-verge-melt-metals-complex-or-are-lower-lows-still-possible
FREE Live Real time Professional charting and feed for almost all symbols.
In all time frames as customizable.
and has maybe 200 indicators from basic to legendary professional.
Please only for Lara’s subscribers or your own family so as to limit the competition.
This took me a year of searching to find this platform and a free site.
You don’t need to actually trade with them or pay anything.
I trade with a different broker as I didn’t want to pay any fee for the trading platform.
You can just create an free online account and download the TOS software and just “paper trade”, which gets you all the awesome live charting like the best set ups in the world.
It runs on the TOS – Think or Swim – pro trading platform, powered by TD Ameritrade
https://www.td.com/ca/products-services/investing/td-direct-investing/trading-platforms/thinkorswim/index.jsp
Experience professional-level trading tools created, for savvy traders of U.S. equities and advanced, options strategies.
Just click on get started and download the software to your pc or even tablet and once you have it downloaded just click on CHARTS.
There are tutorials, which I ignored and just started setting up the charts.
Once your platform is designed than click on Style and “Save Style”
The 5 minute time frames is excellent for most day trading.
You could use split screen to combine multiple symbols or time frames on the same screen or install the software on a separate tablet.
I use this for Gold whose symbol is /GC
Also I use it or have used it for GDX, GDXJ, NUGT, DUST JNUG, JDST, SIL as I only trade gold miners ETF’s.
Gold live available 24 hours a day however GDX is live from 4 am to 8 pm EST.
the gold price here is slightly different than Lara’s although close enough for using.
Please only for Lara’s subscribers or your own family so as to limit the competition.
By the way I get no commission or benefits if you use this.
Thank you.
Hi Richard. Long live Lara’s subscribers. Thank you very much for sharing! Gold price looks fragile at the top as Lara mentions but at this stage don’t see Gold price get much below its pivot 1289-88 for 5dma 1286-85 with 1280-79 holding below there…. Lara has lowered the upside target, gives me a sense Gold price will go higher to carry on to test 1303-06 (The high in futures on Wednesday was 1300)…. Lets see how this plays out, no signs yet of topping.
The TOS trading software does require about 1 GB of RAM to use it so don’t load it on a system that can’t handle that. Also it may need to be restarted on Sundays or before open Monday as markets close and TOS may do system updates/work.
It will start back up with your same charts.
Thanks Richard. Will try and download the application over the weekend and see how it works for me….. Gold price is leading everyone a dance lol with a high of 1303.55 in the futures already; I recon 1308+ now will not be long to follow by the end of this week…
Richard, really good info you’ve offered here. (You are a valuable asset to this site) Thanks much – I’ve copied the info for after my computer upgrade cause she’s running slowly these days. Thanks again.
Thank you very much Richard. I’ll give it a try too over the weekend. The software should be able to do what the indicators ought to. It would save me a lot of time as I do not then need to work them out myself. Other software only give a very perfunctory analysis, and I couldn’t rely on them for my trades. That is why I had never used indicators. Too much time is involved. It’s the dilemma of time required vs accuracy (if I were to work out everything myself).
Thank you Richard for the essential usefull complete information you are so kind
to share with us!
Thank you so much Richard for your generosity in sharing this information. You really are an invaluable member 🙂
Taking a look at GDX, it looks like there may be a complete 5 up from the low on May 25. This aligns best with Lara’s alternate GDX count.
If we make a slight new high tomorrow, this may be the count.
Thank you for sharing your charts. I note that you have the May low as a 4th wave where Lara has it as a second. I see that XAU has reached Lara’s target.
Her alternate has the May low as a wave 4, so it could be either one.
with the strong move up in gold, this now looks more likely. Target about 27.4 before the correction.
Here’s another look at a possible pattern for GDX. If gold tops overnight, then GDX may move down without making a new high. This could form a small H&S top with a target around 23.35
Dreamer, good timing on this GDX chart, thank you.