
The target for upwards movement to end at 1,299 was inadequate.
Price reached 16.38 above the target before turning strongly downwards.
Summary: A blowoff top has completed minor wave 1. Minor wave 2 down has begun and should be expected to last a Fibonacci 8, 13 or 21 days. The most likely target will be the 0.618 Fibonacci ratio at 1,244 but the 0.382 ratio at 1,271 is also a reasonable expectation. Patience is required while this correction unfolds. The trend is up, so this is a counter trend movement.
New updates to this analysis are in bold.
To see last weekly charts click here.
DAILY ELLIOTT WAVE COUNT
Click chart to enlarge.
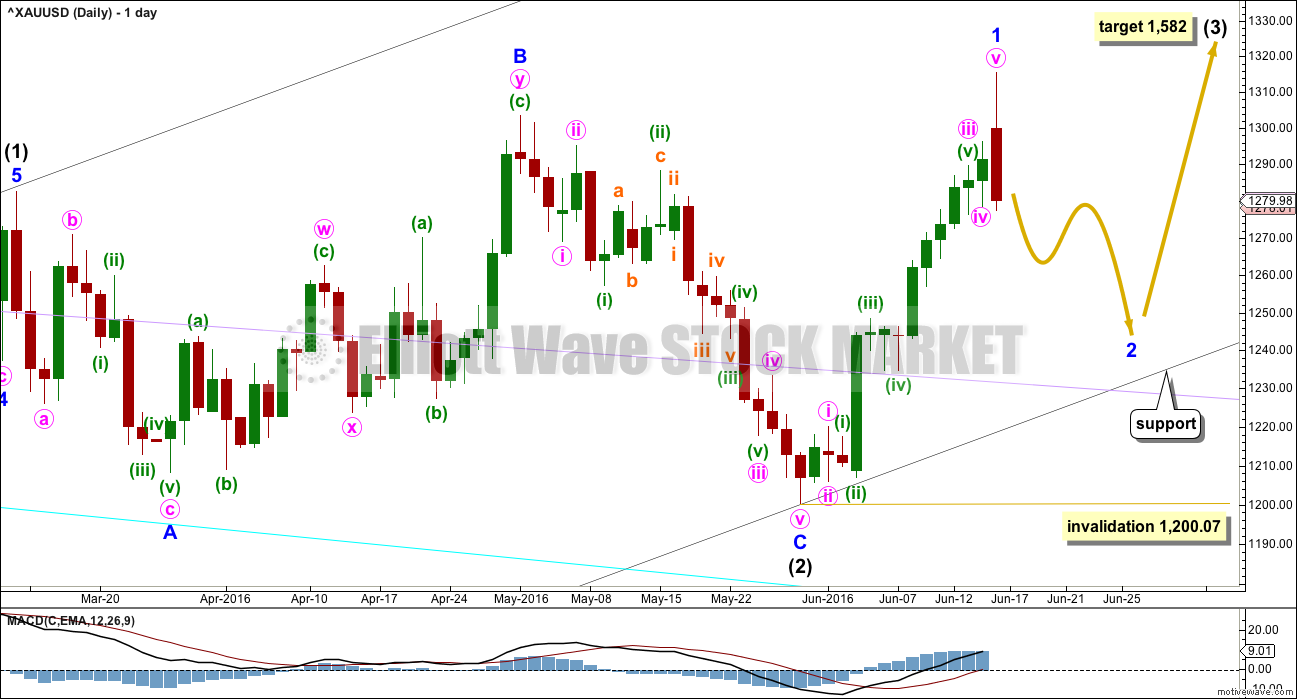
Intermediate wave (2) is a complete expanded flat correction. It is shallow 0.350 correction of intermediate wave (1) lasting 56 days, just one more than a Fibonacci 55. There is no Fibonacci ratio between minor waves A and C. Minor wave C is a complete impulse.
I have today looked back at the last two big cycle degree up movements within the last bull market: the first move from the low at 255.05 in April 2001, and the next move from the low at 682.75 in October 2008. Within the first move, the beginning series of corrections were 0.76, 0.6 and 0.96 in depth. Within the second move, the beginning series of corrections were 0.82, 0.68, 0.57 and 0.45. My conclusion is this current correction expected to have begun just today is more likely to be deep than shallow, even though intermediate wave (2) was shallow. Early corrections within a new trend are most often deep.
Add a base channel (black lines) to intermediate waves (1) and (2). Draw the first trend line from the low at 1,046.27 on 3rd December, 2015, to the low labelled intermediate wave (2), then place a parallel copy on the high of intermediate wave (1). If price comes down to touch the lower edge of this base channel, then long positions should be entered there. The lower edge of a base channel should provide support for lower degree second wave corrections. Base channels almost always work to show where lower degree corrections are contained, but almost always is not the same as always. Sometimes they are overshot or breached by small amounts, particularly for Gold early on in a new trend. If price breaks below the black channel, then the lilac trend line should offer final support (copy it from the weekly chart).
Minor wave 1 was over in 14 days, one more than a Fibonacci 13. The blowoff top, strong red daily candlestick, breach of the pink channel on the hourly chart, and divergence with price and MACD at the daily chart level all indicate today that minor wave 1 is over.
Minor wave 2 may be expected to last a Fibonacci 8, 13 or 21 days. This would give these waves good proportion which adds to the right look. The most likely depth would be the 0.618 Fibonacci ratio about 1,244.
Minor wave 2 may not move beyond the start of minor wave 1 below 1,200.07.
At 1,582 intermediate wave (3) would reach 1.618 the length of intermediate wave (1).
HOURLY ELLIOTT WAVE COUNT
Click chart to enlarge.
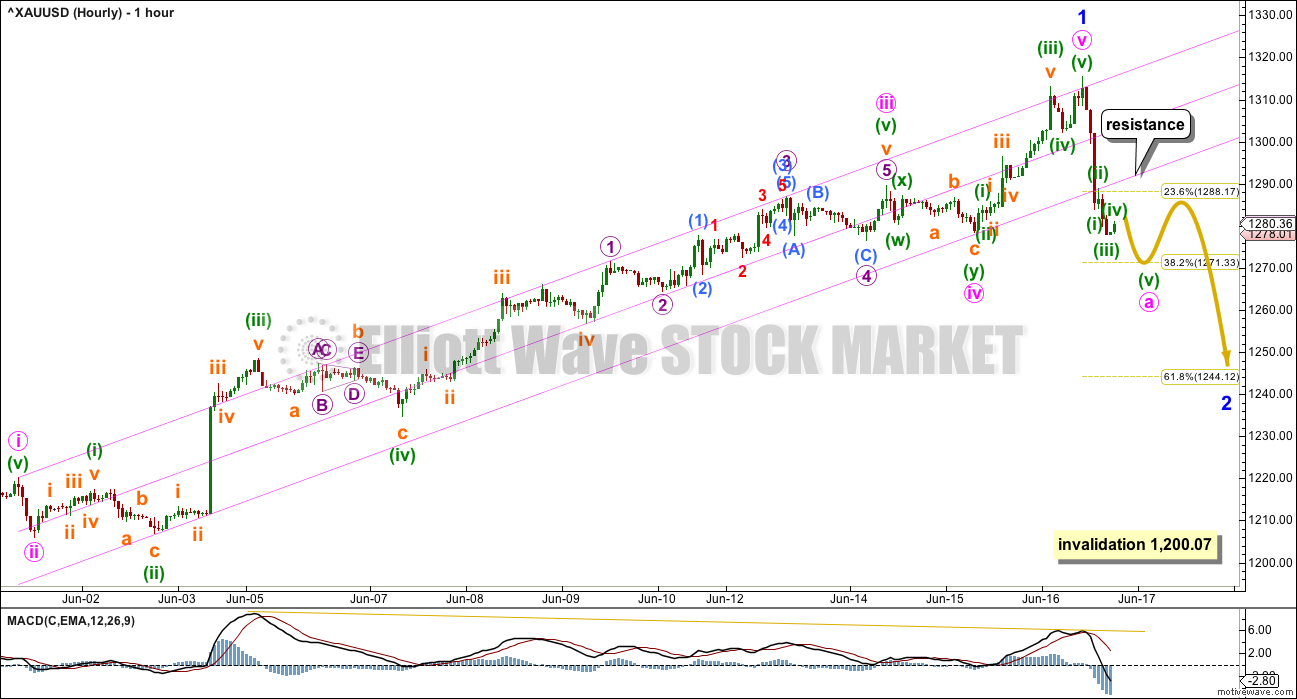
Upwards movement ended with a blowoff top, typical of Gold and all commodities. And price has clearly broken down below the lower edge of the best fit channel which contained minor wave 1.
Keep drawing the pink channel on the hourly chart. The lower edge may now provide resistance.
There are multiple structural possibilities for minor wave 2. The only corrective structure it may not be is a triangle. This leaves zigzags, flats and combinations. It may be a quick sharp zigzag (or multiple zigzag), or it may be a choppy overlapping combination or flat correction. At this early stage, it is impossible to tell which structure it will be, only that it is most likely to be a single or multiple zigzag.
Because it is impossible to tell which of several corrective structures it will unfold as, it is impossible for me to give you a road map for exactly how price will move in a correction. The arrow on this chart is intended only to show that minor wave 2 will be a three wave structure, so it must not be taken as a guide to exactly how price will move within the correction.
If minor wave 2 unfolds as a flat, then the most common type of flat is an expanded flat. This would allow for minute wave b within it to make a new high above the start of minute wave a at 1,315.38. Expanded flats are very common structures. There is a good example on the daily chart for intermediate wave (2). A new high at this early stage does not mean minor wave 2 is over, and it is entirely possible that a new high may be part of this correction within the next few days to a week.
The labelling within minor wave 2 will change as it unfolds. Analysis over the next few days to three weeks must focus on whether or not minor wave 2 could be over to find an opportunity at its end to join the upwards trend.
Corrections are not good trading opportunities. The trend is still up and a counter trend movement is expected to have begun today. Trading against the trend is strongly not recommended for less experienced traders. Only more experienced traders should attempt to trade minor wave 2 downwards, and they are advised to take profits quickly.
It is far too early to see minor wave 2 over today. It should be expected to continue for at least another four sessions and very likely longer than that. Corrections are very often (not always) longer lasting than the impulses they correct. It would be very likely that minor wave 2 lasts longer than 15 days.
TECHNICAL ANALYSIS
DAILY CHART
Click chart to enlarge. Chart courtesy of StockCharts.com.
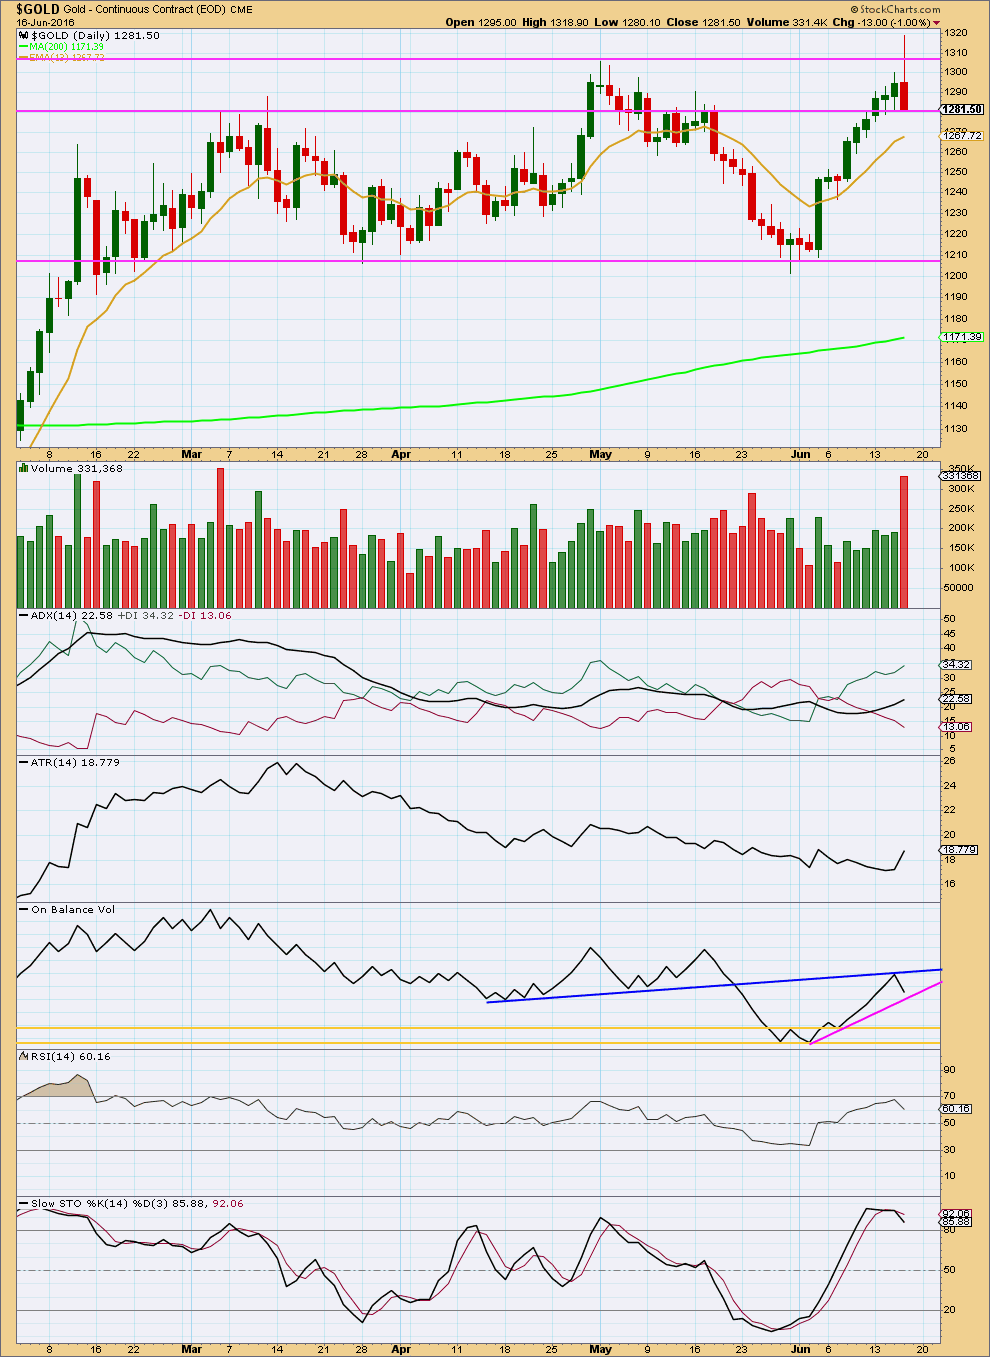
The red daily candlestick completes a bearish engulfing candlestick pattern after an upwards trend. This is a strong bearish reversal pattern. The strength of this reversal signal is increased by strong volume for the downwards session and the long upper wick on the candlestick. More downwards movement from here is very likely. This strongly supports the Elliott wave count.
Price is finding some support at the end of the session about the horizontal trend line at 1,280.
ADX still indicates there is an upwards trend in place and ATR agrees. However, both these indicators are based on 14 day averages so both are lagging. With the blowoff top and reversal signal from today’s candlestick, it should not be expected that an upwards trend is still intact.
The trend lines on On Balance Volume are adjusted. OBV found resistance at the blue line and has turned down from there. This is a reasonable bearish signal and the first bearish signal from OBV in some time. OBV may find a little support at the pink line, but this does not have strong technical significance. A break below the pink line would be a weak bearish signal. OBV should be expected to find good support at the yellow horizontal lines. If OBV gets down to the first yellow line and the Elliott wave count sees a complete corrective structure, then the correction may be over there. However, if the structure is incomplete, then it may end when OBV comes down to the lower yellow line.
RSI did not manage to reach overbought for the upwards wave. RSI today agrees with price as it is declining.
Stochastics also today agrees with price. It should be expected to continue to move lower. When price finds support and Stochastics reaches oversold at the same time, then that may indicate an end to this correction.
This analysis is published @ 07:53 p.m. EST.
To the Stephens:
It is confusing having two members posting in comments with the exact same name. Our membership software shouldn’t allow it, but it does.
Stephen from London CT I just saw your comment in the prior analysis. In response I have made a change to the new Stephen’s name to appear as Stephen K.
So now you have different names.
To the new Stephen – if you want me to change your new nickname let me know. Email me admin@elliottwavegold.com and I’ll do that. Anything except “Stephen” is okay.
So far price is finding resistance at the lower edge of the pink channel which was drawn on the hourly chart.
Keep that channel, it’s proving useful.
I can’t see minute b complete yet. I’ll expect more slow upwards movement to start next week, then a turn down to complete minor 2.
When minute b is complete then I can calculate a target for minor 2 to end at minute degree. I can’t do that today. The target will be at 1,244 until minute b is complete, when it is done then this target may change.
For minor wave 2 I think minute wave a was over at yesterdays low, this choppy move up is minute wave b.
Looking at minute a down on the five minute chart unfortunately it is impossible to tell if that move was a three wave zigzag or a five wave impulse. Both possibilities must therefore be considered.
That means that minute b up may make a new high above 1,315.38 if minor 2 unfolds as a very common expanded flat correction.
But if minor 2 is a zigzag (which is more likely, also a very common structure) then minute b should not make a new high above 1,315.38.
As for minute wave b itself… more than 23 possible corrective structures. Avoid it like the plague. Don’t trade this small move up. If scalping, use the end of it to trade minute c down.
Figuring out when and where minute b is over is one of the hardest things to do… I’ll give it my very best effort but may well get it wrong. The 0.618 Fibonacci ratio of minute a would be the most likely place for it to end about 1,301 because it’s so close to the round number pivot of 1,300.
Working on an updated hourly chart now for you….
Did NUGT just top for today at 10:16 am at 106.86 and gold at 10:26 am at 1296.22?
Any wave counts?
Updated hourly chart based on Lara’s main GDX count.
Thanks Dreamer.
Lara minor typo in the summary: 1,271.
“but the 0.382 ratio at 0,271 is also a reasonable expectation.”
Thanks Richard!
Cesar must’ve missed it in his proofing yesterday 🙂
Suggestion for the “Stephens”. It might be easier for all if one or both of you just ask Lara to update your “moniker” on her end so that you don’t need to worry about differentiating your posts. Just a thought.
True. Very confusing… two very different people with exactly the same name 🙂
To The Stephen’s: if you want me to assist let me know. Otherwise… as you were.
I still think the commercial cot need carefu watching. They are heavy bearish..245k last report. With the move up they areprobably over 300k short. That might be enough to push this down under 1200 and closer to 1100.
It kind of reminds me of the high made in january of 2015, and the high this year. Gold broke over 1300, only to come back below.
Great call Lara on the blowoff top yesterday.
Thanks.
I’m musing some more on the psychology of those. Here’s the thing, those blowoff moves that commodities do are almost always (with the very rare exceptions, this really is almost) a strong indicator of a trend change.
But while they unfold they tell traders that the trend is intact and strengthening, traders may jump in right at the exact wrong time, or they may hold on to existing positions when the blowoff signals the best exit point.
Fear of missing out causes traders to jump in during a blowoff move.
Greed of wanting more causes traders to not exit during a blowoff move.
But really, those moves are the clearest signal of a trend change right at that point that any market is ever going to give you.
It just shows, how much emotion is involved. So if any members here fell victim to that move yesterday and jumped in long, you won’t be alone in that.