
Last analysis expected a correction to continue. Upwards movement remains below the high and is choppy and overlapping, although it was substantial.
Summary: Minor wave 2 down has begun and should be expected to last a Fibonacci 8, 13 or 21 days in total. The most likely target will be the 0.618 Fibonacci ratio at 1,244, but the 0.382 ratio at 1,271 is also a reasonable expectation. Patience is required while this correction unfolds. The trend is up, so this is a counter trend movement.
New updates to this analysis are in bold.
To see last weekly charts click here.
DAILY ELLIOTT WAVE COUNT
Click chart to enlarge.
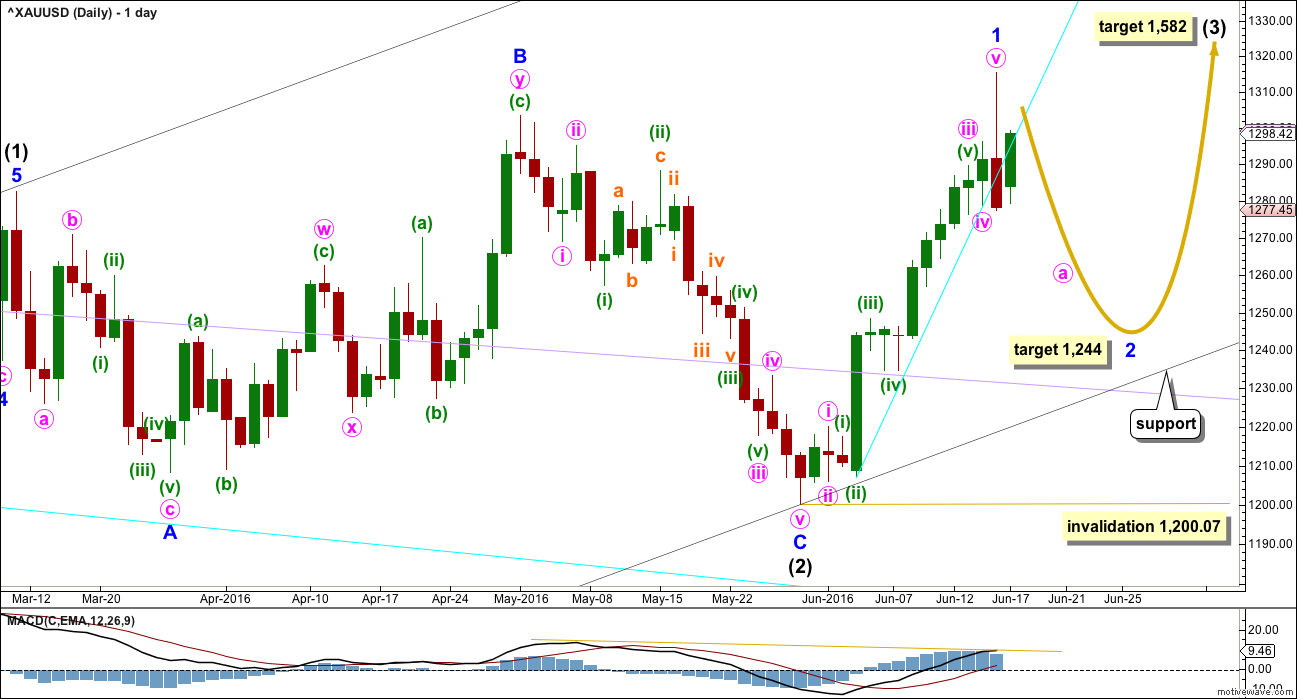
Intermediate wave (2) is a complete expanded flat correction. It is shallow 0.350 correction of intermediate wave (1) lasting 56 days, just one more than a Fibonacci 55. There is no Fibonacci ratio between minor waves A and C. Minor wave C is a complete impulse.
I have looked back at the last two big cycle degree up movements within the last bull market: the first move from the low at 255.05 in April 2001, and the next move from the low at 682.75 in October 2008. Within the first move, the beginning series of corrections were 0.76, 0.6 and 0.96 in depth. Within the second move, the beginning series of corrections were 0.82, 0.68, 0.57 and 0.45. My conclusion is this current correction expected to have begun just today is more likely to be deep than shallow, even though intermediate wave (2) was shallow. Early corrections within a new trend are most often deep.
Add a base channel (black lines) to intermediate waves (1) and (2). Draw the first trend line from the low at 1,046.27 on 3rd December, 2015, to the low labelled intermediate wave (2), then place a parallel copy on the high of intermediate wave (1). If price comes down to touch the lower edge of this base channel, then long positions should be entered there. The lower edge of a base channel should provide support for lower degree second wave corrections. Base channels almost always work to show where lower degree corrections are contained, but almost always is not the same as always. Sometimes they are overshot or breached by small amounts, particularly for Gold early on in a new trend. If price breaks below the black channel, then the lilac trend line should offer final support (copy it from the weekly chart).
Minor wave 1 was over in 14 days, one more than a Fibonacci 13. The blowoff top, strong red daily candlestick, breach of the cyan trend line on the hourly chart, and divergence with price and MACD at the daily chart level all indicate that minor wave 1 is over.
To reduce clutter on charts the pink channel is removed and a cyan trend line is drawn where the lower edge was. Copy this over to hourly charts; this line is now providing resistance.
Minor wave 2 may be expected to last a Fibonacci 8, 13 or 21 days. This would give these waves good proportion which adds to the right look. The most likely depth would be the 0.618 Fibonacci ratio about 1,244.
Minor wave 2 may not move beyond the start of minor wave 1 below 1,200.07.
At 1,582 intermediate wave (3) would reach 1.618 the length of intermediate wave (1).
HOURLY ELLIOTT WAVE COUNT
Click chart to enlarge.
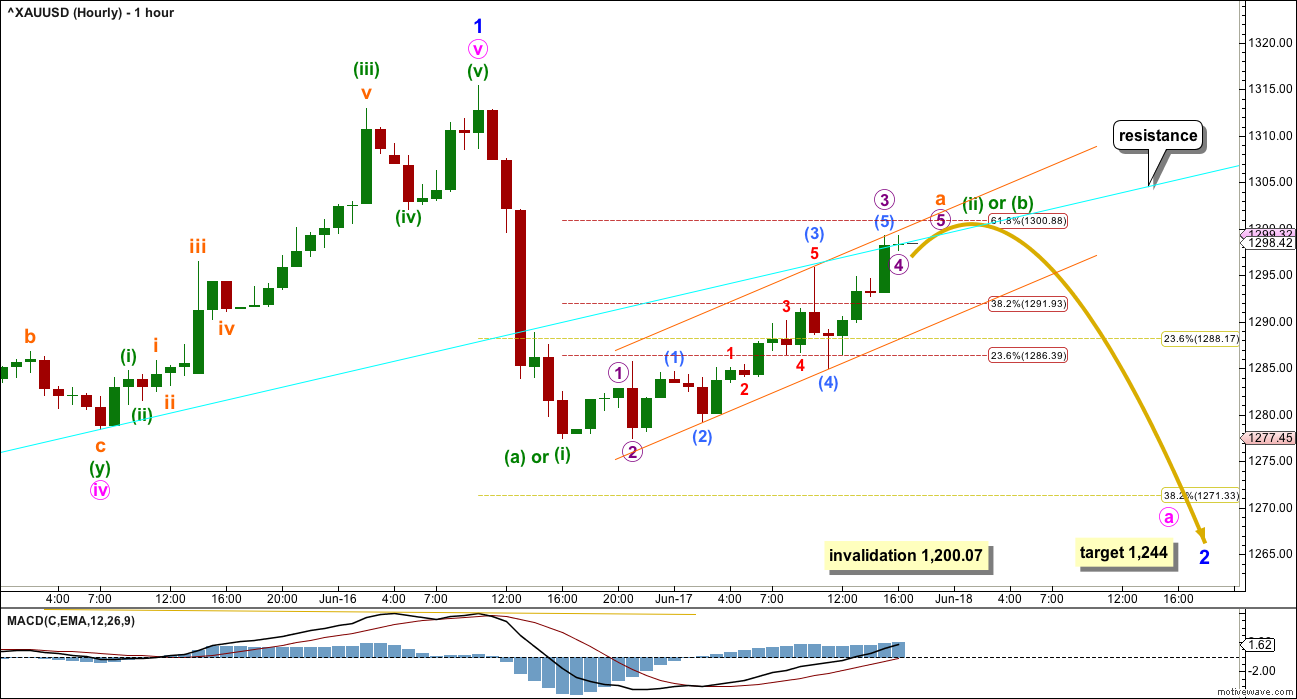
Downwards movement from the last high has been moved down one degree for this main hourly wave count. Minor wave 2 should be expected to last several days; if minute wave a is over already, it looks too brief.
If minor wave 2 is a zigzag, then downwards movement from the high would be minuette wave (i) within a five wave impulse for minute wave a. Minuette wave (ii) may not move beyond the start of minuette wave (i) above 1,315.38.
If minor wave 2 is a flat correction, then downwards movement from the high would be minuette wave (a) of either a zigzag or a flat for minute wave a. If minor wave 2 is a flat correction, then minute wave a must subdivide as a three; it may be any corrective structure. If minute wave a is a flat correction, then within it minuette wave (b) may make a new high above the start of minuette wave (a) at 1,315.38 as in an expanded flat. There is no upper invalidation point for this hourly wave count for this reason.
At this stage, it looks like price may continue to find resistance at the cyan trend line, which may serve to hold down upwards movement and prevent a new high.
A best fit orange channel is drawn about Friday’s upwards movement. Expect price to continue higher while price remains within this small channel. As soon as the channel is breached, then expect to see a new low below the end of minuette wave (a) or (i) at 1,277.43.
Minuette wave (b) or (ii) may end about the 0.618 Fibonacci ratio of minuette wave (a) or (i) at 1,301. Thereafter, minuette wave (c) or (iii) downwards should unfold.
Overall, this main wave count expects that minor wave 2 has just begun. It expects minor wave 2 will continue all through next week, and quite possibly through the following week as well.
For this main hourly wave count, the most likely end of minor wave 2 would be about the 0.618 Fibonacci ratio at 1,244.
Minor wave 2 may not move beyond the start of minor wave 1 below 1,200.07.
ALTERNATE HOURLY ELLIOTT WAVE COUNT
Click chart to enlarge.
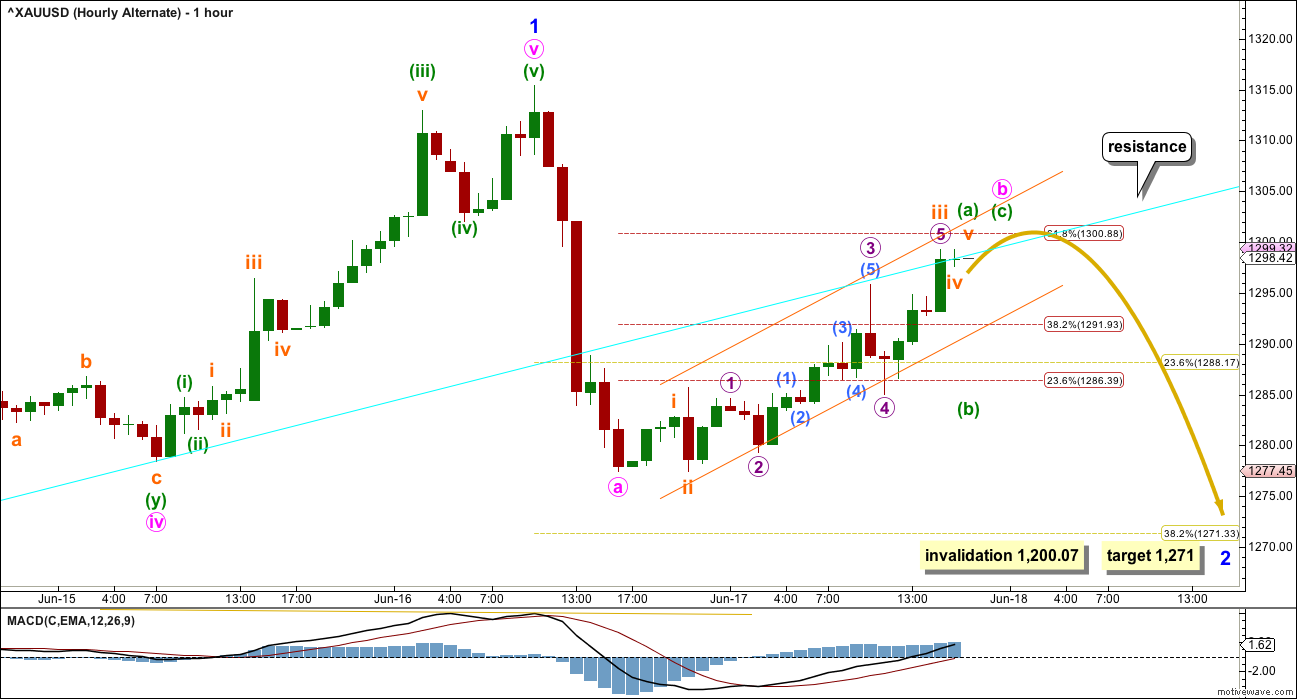
Alternatively, the degree of labelling within the last downwards wave may be moved up one degree. This may be minute wave a complete already.
Minute wave a will subdivide as either a zigzag or an impulse on the five minute chart. Again, for this reason there cannot be an upper invalidation point for this wave count. Minute wave b may make a new high above the start of minute wave a at 1,315.38. However, this does look unlikely.
This alternate wave count is judged to have a lower probability due to the brevity of minor wave 2. It sees minor wave 2 as almost 2/3 complete, which would be remarkably quick given that minor wave 1 lasted 14 sessions. This is possible but fairly unlikely. More patience should be taken while this correction unfolds.
TECHNICAL ANALYSIS
DAILY CHART
Click chart to enlarge. Chart courtesy of StockCharts.com.
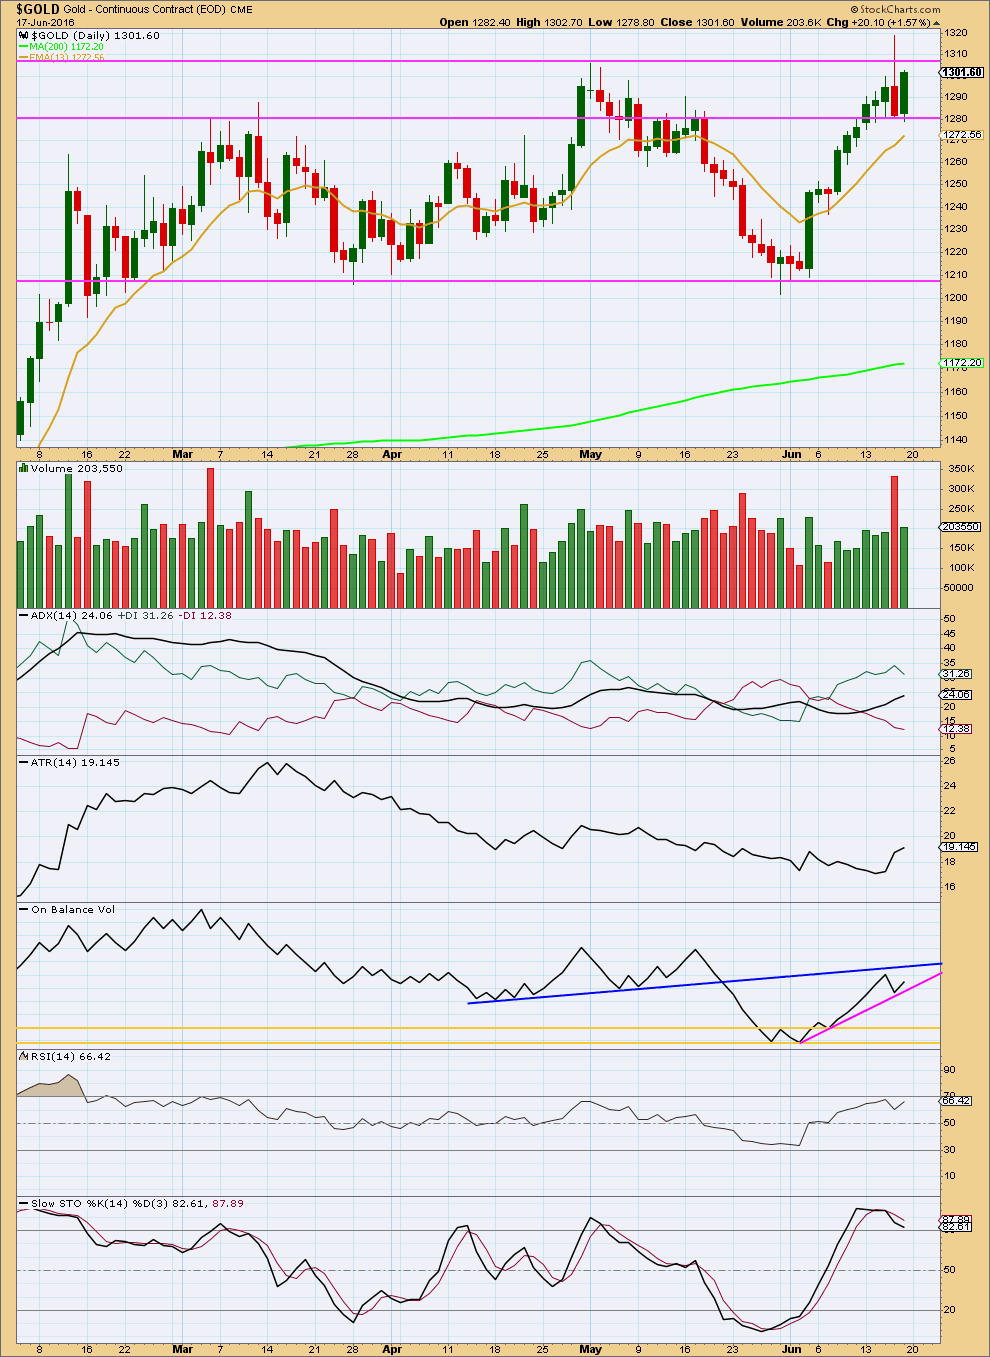
The red daily candlestick at the high completes a bearish engulfing candlestick pattern after an upwards trend. This is a strong bearish reversal pattern. The strength of this reversal signal is increased by strong volume for the downwards session and the long upper wick on the candlestick. More downwards movement from here is very likely. This strongly supports the Elliott wave count.
Price found support about the horizontal trend line at 1,280 and bounced up from there. Resistance may be expected to be fairly strong about the next horizontal trend line at 1,305.
There was some support for upwards movement for Friday which is slightly concerning for the wave count, but it remains much lighter than the prior downwards day. There was more pressure on downwards movement for Thursday than there was on upwards movement for Friday. A greater reaction after a blowoff top should still be expected as most typical behaviour.
ADX still indicates an upwards trend is in place and ATR still agrees. These two indicators are lagging. The strong reversal signal from the blowoff top and bearish engulfing candlestick pattern should be seen as more important at this stage then these two lagging indicators.
On Balance Volume trend lines have been redrawn. OBV found support and bounced up from the pink trend line. OBV is being squeezed between the pink and blue lines. A break below the pink line would be a weak bearish signal. A break above the blue line would be a fairly strong bullish signal. To the downside, the horizontal yellow lines should provide strong support and may assist to show when and where minor wave 2 ends.
RSI did not reach overbought during the upwards trend. There is room yet for price to rise.
Stochastics reached overbought and is now returning.
This analysis is published @ 06:54 p.m. EST on 18th June, 2016.
Updated hourly chart. Overall a sideways chop for today, looks like a horrid B wave or second wave.
Minuette (ii) or (b) could still be moving sideways, another possibility. Maybe a triangle? If MACD starts to sit on the zero line then that’s what I’ll publish as a main wave count. For now… multiple options. This is just the first I see this morning.
Is a B wave up topping now at 3:56 pm at 1291.28 then a C wave down below 1,277.43 for cheaper miners Tuesday with reduced Brexit breakup concerns?
That’s entirely possible.
On my chart above micro C needs to move at least slightly above the end of micro A at 1,292.06 to avoid a truncation.
Did gold top at 1:31 pm at 1,290.54 a 5th wave up since open for today or does it still have some bullish left this afternoon?
The bears could not get it done to get a low below prior day low; inside day so far. The bulls would need to see Gold price back up above 1296 to target 1305+…. Wonder which way this is heading – for another drop from 1291-96 range or back up for 1305+? Interesting!
Gold just went up $9 in 16 minutes up to 1287.88 at 10:48 am.
What is the wave count?
Was it a 3rd way up of a b up from today’s low at 1278.02 am on the way down in an a-b-c below 1,277.43?
GBP is up 1.86%
Euro UP
USD down
Gold is down
So much for gold inverse relation to USD???
Markets up as gold drops as BREXIT less likely.
Nikkei surges as Brexit fears ease
June 19, 2016 11:51 p.m. ET
the latest opinion polls from the U.K. suggested a late swing in favor of the country remaining in the EU.
http://www.marketwatch.com/story/nikkei-surges-as-brexit-fears-ease-2016-06-19
Gold started strong Sunday but now looks to eventually move below Thursday 9:09 pm low.
The lower trend line of the orange hourly channel has been breached by two full hourly candlesticks 9-10 and 10-11 pm. Expect a new low below 1,277.43.
“A best fit orange channel is drawn about Friday’s upwards movement. Expect price to continue higher while price remains within this small channel. As soon as the channel is breached, then expect to see a new low below the end of minuette wave (a) or (i) at 1,277.43.”
Here’s a look at the bigger picture for Gold. We appear to be carving out a large inverted H&S pattern. The recent top had a possible false breakout above the neckline and stopped short of the trend line for a large rising wedge.
To confirm the iH&S pattern, a confirmed breakout above the neckline is needed. If the current EW count plays out, it looks like the correction would likely stop at the rising wedge trend line and then break out upwards from the wedge. A concern about this is that an upwards breakout from a rising wedge occurs only 31% of the time.
From a probability standpoint, a downwards breakout and a much deeper correction is more likely. It would also give the iH&S pattern more symmetry with another deeper right shoulder.
I’m not convinced of a deeper correction, but with a higher probability, it’s something that we should watch for. Should it occur, a new EW count would be required…
Another look at a possible bigger correction. Chart by Mark
Thanks for the warning.
Here’s a look at DUST
Still looking for this H&S pattern on GDX to play out
Good chart. Thx!