
Last analysis expected a counter trend movement to continue. A long legged doji candlestick fits this description.
Summary: Minor wave 2 down has begun and should be expected to last a Fibonacci 8, 13 or 21 days in total. The most likely target will be the 0.618 Fibonacci ratio at 1,244, but the 0.382 ratio at 1,271 is also a reasonable expectation. Patience is required while this correction unfolds. The trend is up, so this is a counter trend movement.
New updates to this analysis are in bold.
To see last weekly charts click here.
DAILY ELLIOTT WAVE COUNT
Click chart to enlarge.
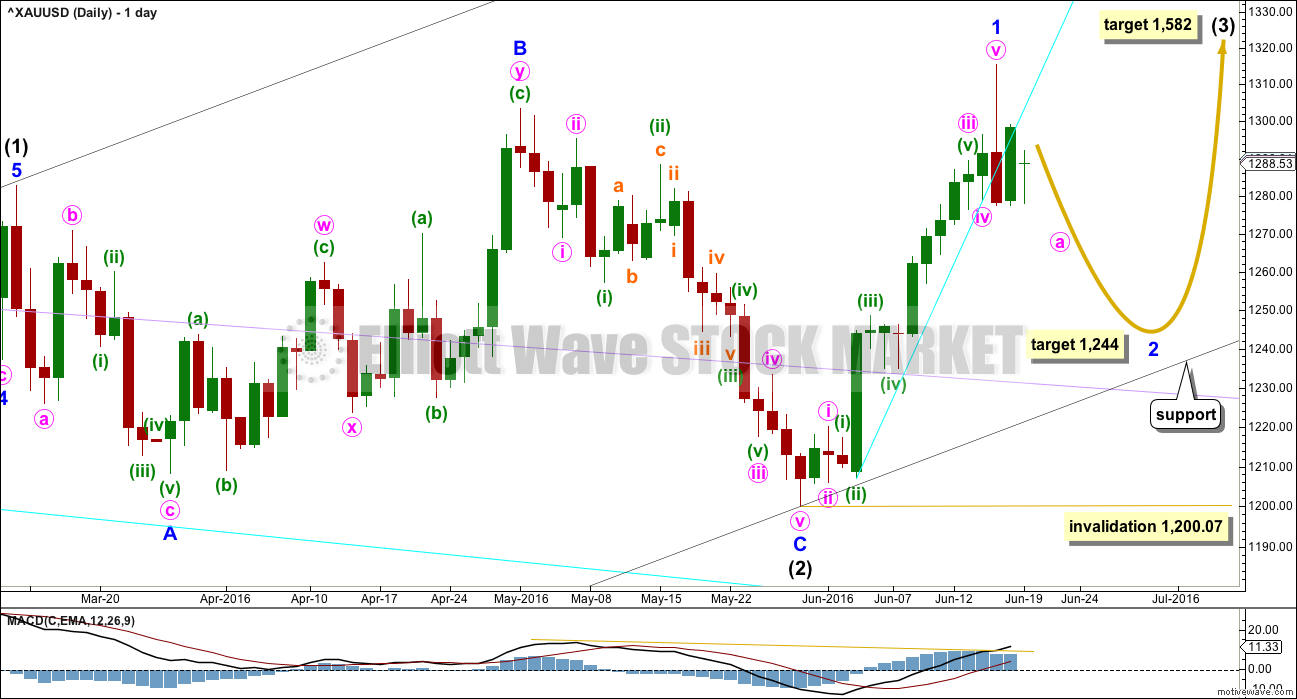
Intermediate wave (2) is a complete expanded flat correction. It is shallow 0.350 correction of intermediate wave (1) lasting 56 days, just one more than a Fibonacci 55. There is no Fibonacci ratio between minor waves A and C. Minor wave C is a complete impulse.
I have looked back at the last two big cycle degree up movements within the last bull market: the first move from the low at 255.05 in April 2001, and the next move from the low at 682.75 in October 2008. Within the first move, the beginning series of corrections were 0.76, 0.6 and 0.96 in depth. Within the second move, the beginning series of corrections were 0.82, 0.68, 0.57 and 0.45. My conclusion is this current correction expected to have begun 16th of June is more likely to be deep than shallow, even though intermediate wave (2) was shallow. Early corrections within a new trend are most often deep.
Add a base channel (black lines) to intermediate waves (1) and (2). Draw the first trend line from the low at 1,046.27 on 3rd December, 2015, to the low labelled intermediate wave (2), then place a parallel copy on the high of intermediate wave (1). If price comes down to touch the lower edge of this base channel, then long positions should be entered there. The lower edge of a base channel should provide support for lower degree second wave corrections. Base channels almost always work to show where lower degree corrections are contained, but almost always is not the same as always. Sometimes they are overshot or breached by small amounts, particularly for Gold early on in a new trend. If price breaks below the black channel, then the lilac trend line should offer final support (copy it from the weekly chart).
Minor wave 1 was over in 14 days, one more than a Fibonacci 13. The blowoff top, strong red daily candlestick, breach of the cyan trend line on the hourly chart, and divergence with price and MACD at the daily chart level all indicate that minor wave 1 is over.
To reduce clutter on charts the pink channel is removed and a cyan trend line is drawn where the lower edge was. Copy this over to hourly charts; this line is now providing resistance.
Minor wave 2 may be expected to last a Fibonacci 8, 13 or 21 days. This would give these waves good proportion which adds to the right look. The most likely depth would be the 0.618 Fibonacci ratio about 1,244.
Minor wave 2 may not move beyond the start of minor wave 1 below 1,200.07.
At 1,582 intermediate wave (3) would reach 1.618 the length of intermediate wave (1).
HOURLY ELLIOTT WAVE COUNT
Click chart to enlarge.
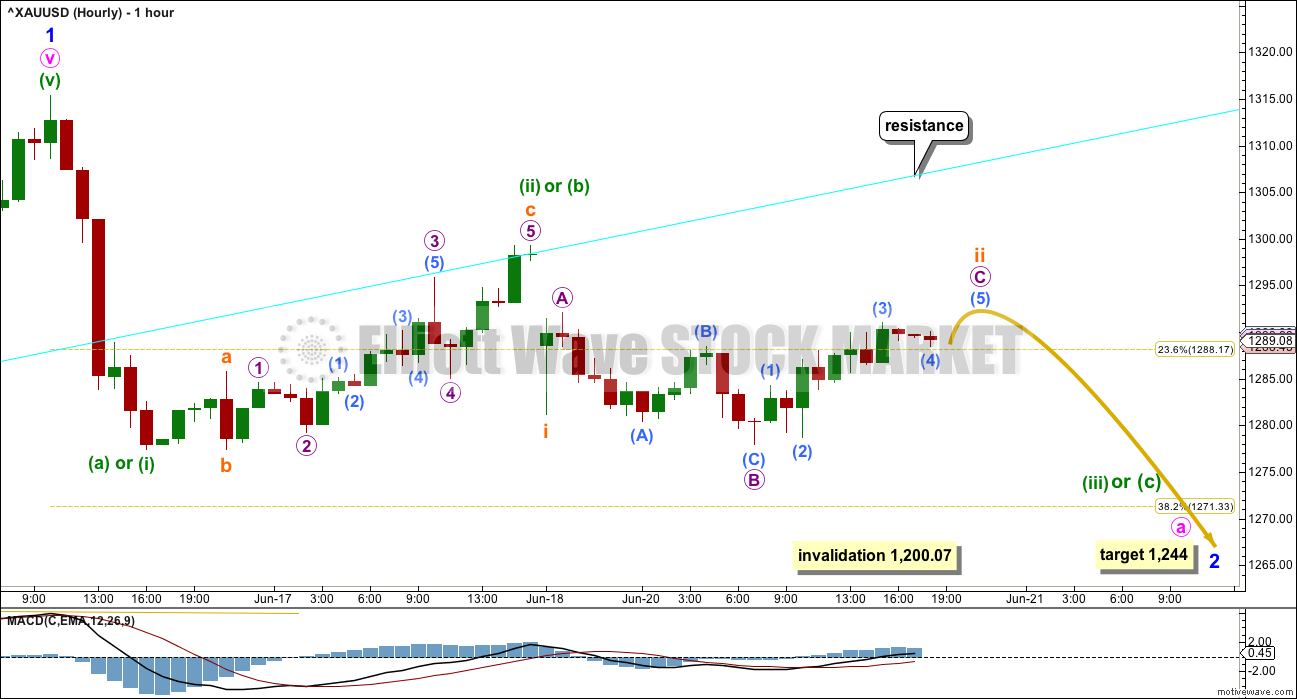
If minor wave 2 is a zigzag, then downwards movement from the high would be minuette wave (i) within a five wave impulse for minute wave a. Minuette wave (ii) may not move beyond the start of minuette wave (i) above 1,315.38.
If minor wave 2 is a flat correction, then downwards movement from the high would be minuette wave (a) of either a zigzag or a flat for minute wave a. If minor wave 2 is a flat correction, then minute wave a must subdivide as a three; it may be any corrective structure. If minute wave a is a flat correction, then within it minuette wave (b) may make a new high above the start of minuette wave (a) at 1,315.38 as in an expanded flat. There is no upper invalidation point for this hourly wave count for this reason.
If minor wave 2 is a double zigzag, then the degree of labelling within downwards movement may be moved down one more degree. Subminuette wave a may be complete and subminuette wave b may be unfolding sideways as a zigzag, triangle or combination.
This chart must encompass multiple structural possibilities. Overall, it expects choppy overlapping movement with a downwards bias. Because there are still multiple structural options open for minor wave 2, it is impossible for me to give you an accurate roadmap for how price will move during this consolidation. The only thing which looks clear today is that it is not over.
At this stage, it looks like price may continue to find resistance at the cyan trend line, which may serve to hold down upwards movement and prevent a new high.
Overall, this main wave count expects that minor wave 2 has just begun. It expects minor wave 2 will continue all through this week, and quite possibly through the following week as well.
For this main hourly wave count, the most likely end of minor wave 2 would be about the 0.618 Fibonacci ratio at 1,244.
Minor wave 2 may not move beyond the start of minor wave 1 below 1,200.07.
ALTERNATE HOURLY ELLIOTT WAVE COUNT
Click chart to enlarge.
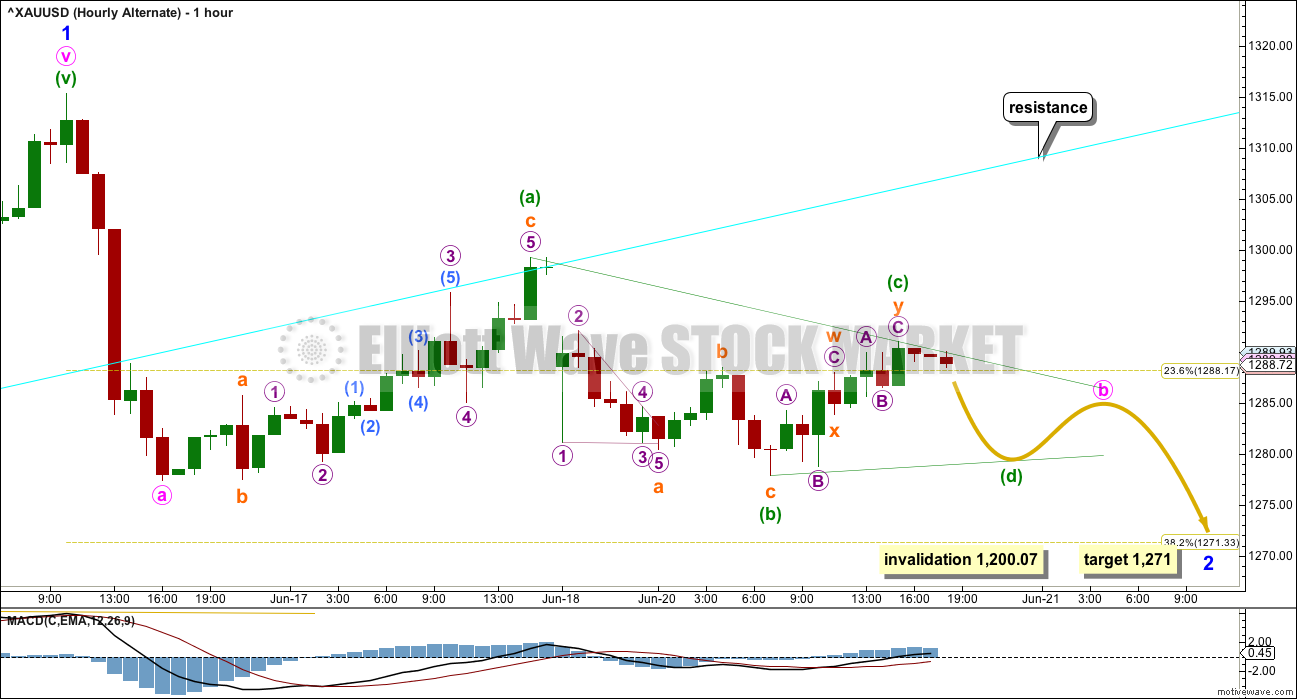
Alternatively, the degree of labelling within the last downwards wave may be moved up one degree. This may be minute wave a complete already.
Minute wave a will subdivide as either a zigzag or an impulse on the five minute chart. Again, for this reason there cannot be an upper invalidation point for this wave count. Minute wave b may make a new high above the start of minute wave a at 1,315.38. However, this does look unlikely.
This alternate wave count is judged to have a lower probability due to the brevity of minor wave 2. It sees minor wave 2 as almost 2/3 complete, which would be remarkably quick given that minor wave 1 lasted 14 sessions. This is possible but fairly unlikely. More patience should be taken while this correction unfolds.
This alternate today looks at the possibility that a triangle may be unfolding sideways. This may be minute wave b within a single zigzag structure for minor wave 2, which may also be moved down one degree and may be subminuette wave b as a triangle within the first zigzag of a double zigzag for minor wave 2.
This alternate visually illustrates the lack of certainty for how price will move during this correction.
At this stage, the structure for minor wave 2 still looks incomplete no matter what structure it may be.
TECHNICAL ANALYSIS
DAILY CHART
Click chart to enlarge. Chart courtesy of StockCharts.com.
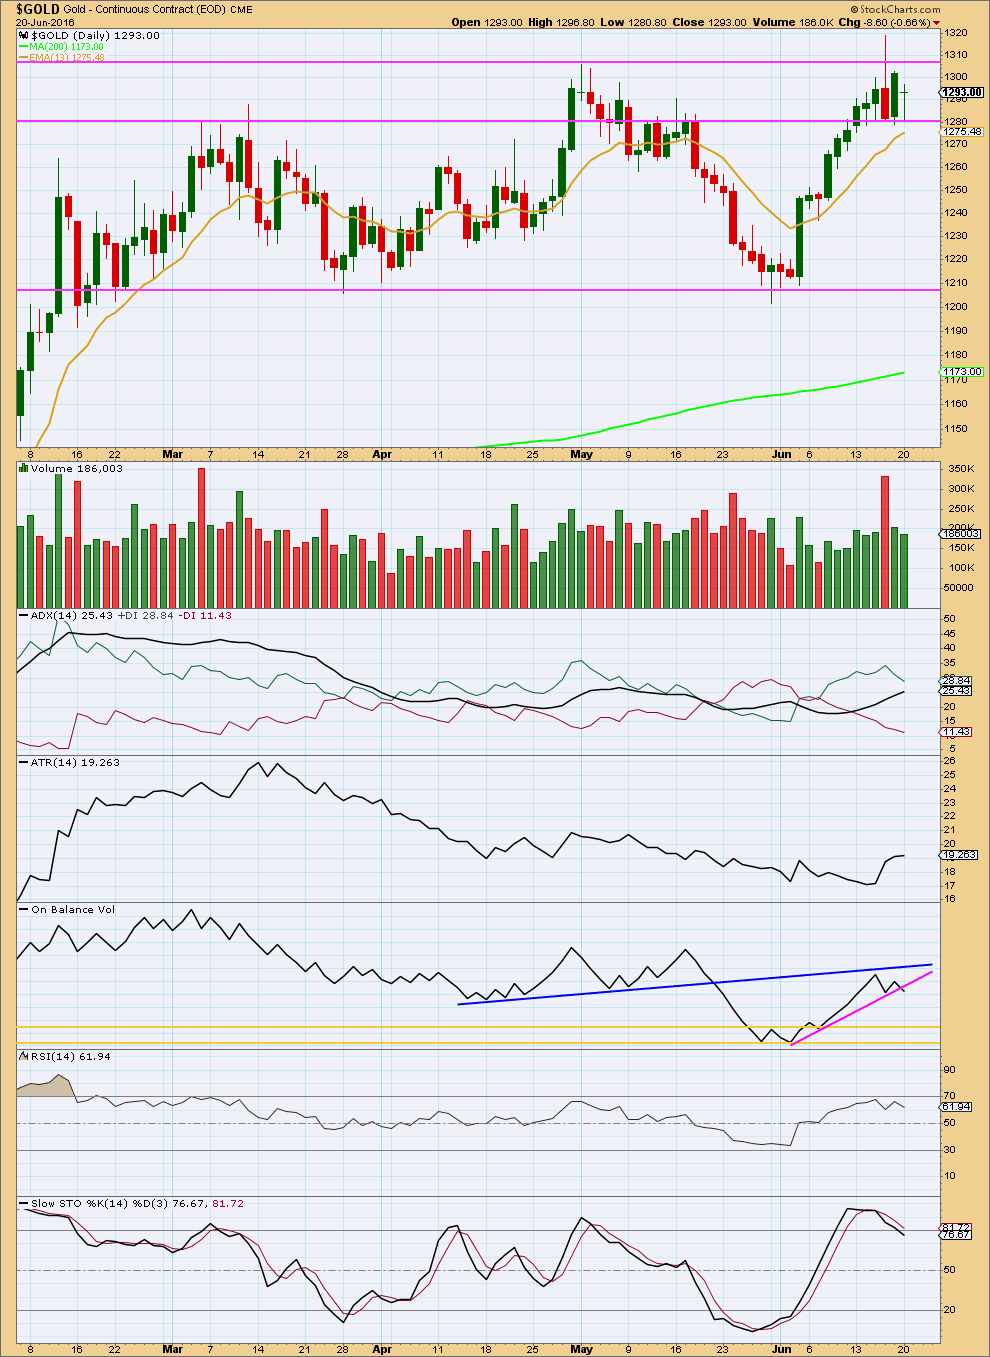
The red daily candlestick at the high completes a bearish engulfing candlestick pattern after an upwards trend. This is a strong bearish reversal pattern. The strength of this reversal signal is increased by strong volume for the downwards session and the long upper wick on the candlestick. More downwards movement from here is very likely. This strongly supports the Elliott wave count.
Price is still finding strong support about the horizontal trend line at 1,280. A green doji for this session comes with lighter volume, and sideways movement on declining volume looks corrective which should be expected after the strong reversal signal at the high.
If price breaks below 1,280, then it may find resistance there.
ADX still indicates an upwards trend is in place, but this indicator is lagging. The strong blowoff top and reversal signal at the high are stronger signals than ADX at this time; an upwards trend should not be assumed to remain intact at this stage.
ATR may be beginning to flatten off and is no longer so clearly agreeing with ADX today.
On Balance Volume is giving a weak bearish signal today with a break below the pink line. OBV may now be expected to continue lower until it comes to find support at one of the yellow horizontal lines. This supports the Elliott wave count which expects some downwards movement from here.
Stochastcis is returning from overbought. If the market is now consolidating, then it may be expected that a downwards swing will continue until price finds support and Stochastics reaches oversold at the same time.
RSI did not reach overbought. It is returning from close to extreme and may be expected to continue lower until it at least reaches neutral.
This analysis is published @ 07:02 p.m. EST.
The triangle didn’t work. This will be the hourly wave count today, I’ll publish two, this one and another with the labelling all the same but one degree lower within minor 2.
So minute waves a and b may be over, or that may be only minuette (a) and (b) or indeed it may also be minuette (i) and (ii) within an impulse for minute a.
Either way…. downwards movement does not look like it can be complete yet.
This best fit channel may now be useful. If price breaks below support and shoots out the bottom that may be the last move down, it may be powerful with a small volume spike.
At 1,238 minute c would reach 1.618 X minute a, this is somewhat close to the 0.618 Fibonacci ratio at 1,244 giving us a rather wide $6 target zone. As the structure continues I’ll try to narrow this target to a better range.
A decisive move for Gold today down towards the 0.618 Fibonacci ratio is nice to see.
Minor wave 2 may possibly be quicker than a Fibonacci 5 days…. it’s getting close. I may publish a third hourly wave count which sees it as complete more quickly
If price gets close to 1,244 I’ll be entering long if the structure may possibly be complete. And so far it looks like it could be. Stop will be just below 1,200.07. I’ll be prepared for the pain of holding a negative position if I’m wrong short term, because for a third of a third wave up I think that would still be a good entry point to ride an upwards trend for weeks.
Gold ends near two-week low as investors place bets ahead of Brexit vote
June 21, 2016 3:01 p.m. ET
Yellen warns that Brexit vote poses significant U.S. economic risk
http://www.marketwatch.com/story/gold-extends-decline-ahead-of-yellen-testimony-brexit-vote-2016-06-21
‘A “leave” result is NOT factored into this market and the effect will move gold cleanly through the $1,300 handle.’
Peter Hug, Kitco Metals
But gold’s decline “makes no sense,” he said. It’s setting itself up for a “major buy” if the U.K. votes to exit the EU, he said.
Gold’s decline makes sense in EW terms though. In classic TA terms, after that blowoff top, it makes perfect sense too.
This is why I prefer TA over FA. It makes more sense to me 🙂
Where and when might Minute wave a end?
Might it end at the low the end of today or might subminuette wave 4 still be moving up?
The Brexit gold bet could be the smartest, or the dumbest, ever
http://www.marketwatch.com/story/the-brexit-gold-bet-could-be-the-smartest-or-the-dumbest-ever-2016-06-21
I’ve seen a lot of musing on Brexit. I’m thinking that maybe, just maybe it won’t be the big market mover everyone thinks it will be. For stock markets anyway.
Did minuette (iii) or (C) just finished down at 7:13 am low of 1269.49 and now a 4th wave starts up?
Hi Richard. I guess the next stop is 50% retrace of H 1315 / L 1205 at around 1260….?
Subminuette 3 completed at the low of 1265.50.
The alternate triangle idea had been invalidated long ago with the drop below the start of the triangle @ 1277.33.
I will only enter a small trade at the end of Minute A, and a larger one for Minute C. Subminuette 4-5 contain too much sideways movement.
Lara, is there any idea when we would know if 1,271 is the bottom before intermediate (3) moves much higher in case it hits that area and goes up but not below 1,271 to the most likely target at 1,244? Would that only be clarified several days from now if gold doesn’t seem to be dropping any more? I have a concern in case we miss buying at a lower bottom and it doesn’t happen.
I agree with your concern.
I’ll be looking at classic TA to see the bottom. It was a good indicator of the last low but I didn’t give it enough weight.
I’ll be looking for a volume spike at the low, and Stochastics oversold, and price to find support. If OBV also finds support then a low would very likely be in place.
For now though this correction really should last longer than three days. It is likely to be deep, but it doesn’t have to be. So I will be on the lookout for a possible shallow end too.3
Lara, thanks for your impressive and reassuring answer. Your Chartered Market Technician® (CMT) training and trading advisory skills are appreciated.
🙂 You’re very welcome Richard