
Sideways / downwards movement continued as expected towards the target.
Summary: Minor wave 2 could possibly be over in one more day, but more likely it will continue for a further four, nine or seventeen days. The target remains at 1,244.
New updates to this analysis are in bold.
To see last weekly charts click here.
DAILY ELLIOTT WAVE COUNT
Click chart to enlarge.
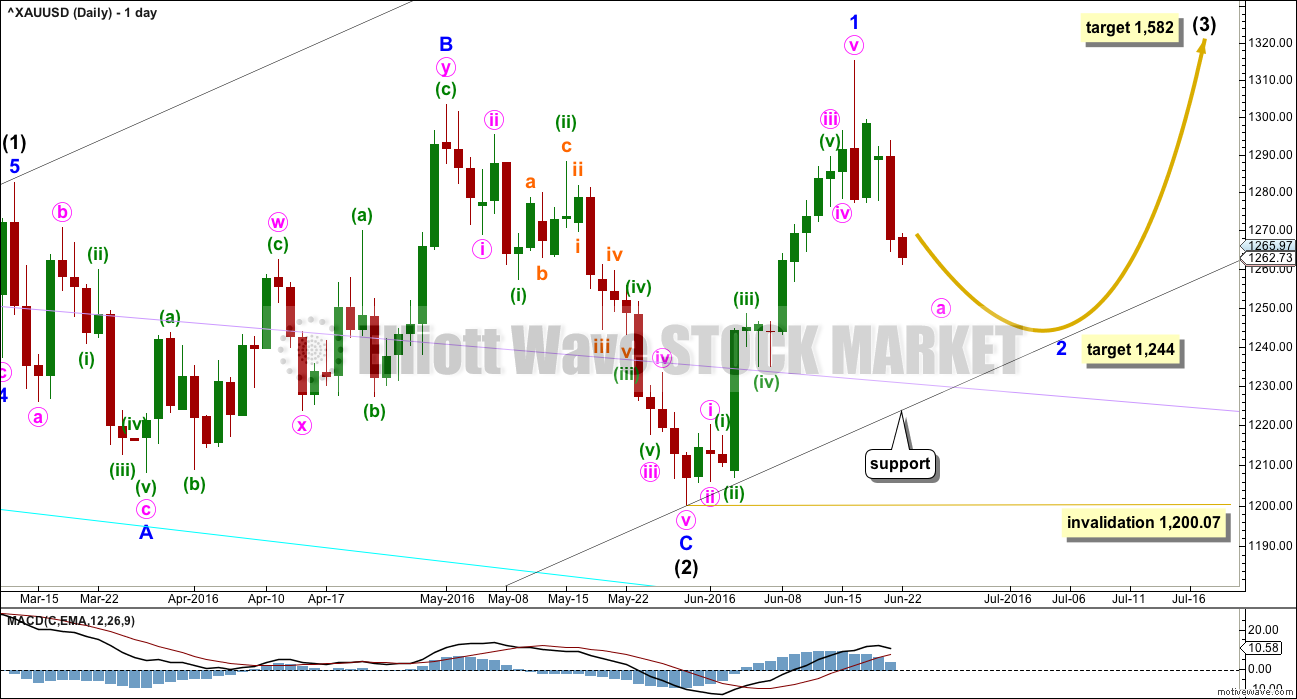
Intermediate wave (2) is a complete expanded flat correction. It is shallow 0.350 correction of intermediate wave (1) lasting 56 days, just one more than a Fibonacci 55. There is no Fibonacci ratio between minor waves A and C. Minor wave C is a complete impulse.
I have looked back at the last two big cycle degree up movements within the last bull market: the first move from the low at 255.05 in April 2001, and the next move from the low at 682.75 in October 2008. Within the first move, the beginning series of corrections were 0.76, 0.6 and 0.96 in depth. Within the second move, the beginning series of corrections were 0.82, 0.68, 0.57 and 0.45. My conclusion is this current correction expected to have begun 16th of June is more likely to be deep than shallow, even though intermediate wave (2) was shallow. Early corrections within a new trend are most often deep.
So far minor wave 2 has reached below the 0.382 Fibonacci ratio of minor wave 1 at 1,271 and the structure looks to be incomplete. The 0.618 Fibonacci ratio at 1,244 will now be the target. If this first target is wrong, it may now not be low enough. If price comes down to touch the lower edge of the base channel, then it may end there.
Add a base channel (black lines) to intermediate waves (1) and (2). Draw the first trend line from the low at 1,046.27 on 3rd December, 2015, to the low labelled intermediate wave (2), then place a parallel copy on the high of intermediate wave (1). If price comes down to touch the lower edge of this base channel, then long positions should be entered there. The lower edge of a base channel should provide support for lower degree second wave corrections. Base channels almost always work to show where lower degree corrections are contained, but almost always is not the same as always. Sometimes they are overshot or breached by small amounts, particularly for Gold early on in a new trend. If price breaks below the black channel, then the lilac trend line should offer final support (copy it from the weekly chart).
Minor wave 1 was over in 14 days, one more than a Fibonacci 13.
Minor wave 2 may be expected to last a Fibonacci 8, 13 or 21 days. This would give these waves good proportion which adds to the right look. So far it has only lasted four days and looks too brief and shallow at this stage to be over. The alternate hourly wave count below allows for it to be over in just one more day. This is possible but highly unlikely. Classic technical analysis will be used to determine the probability of a possible low in place after a little more downwards movement for the next session.
Minor wave 2 may not move beyond the start of minor wave 1 below 1,200.07.
At 1,582 intermediate wave (3) would reach 1.618 the length of intermediate wave (1).
HOURLY ELLIOTT WAVE COUNT – ZIGZAG
Click chart to enlarge.
It is time to separate out some ideas into separate charts for clarity.
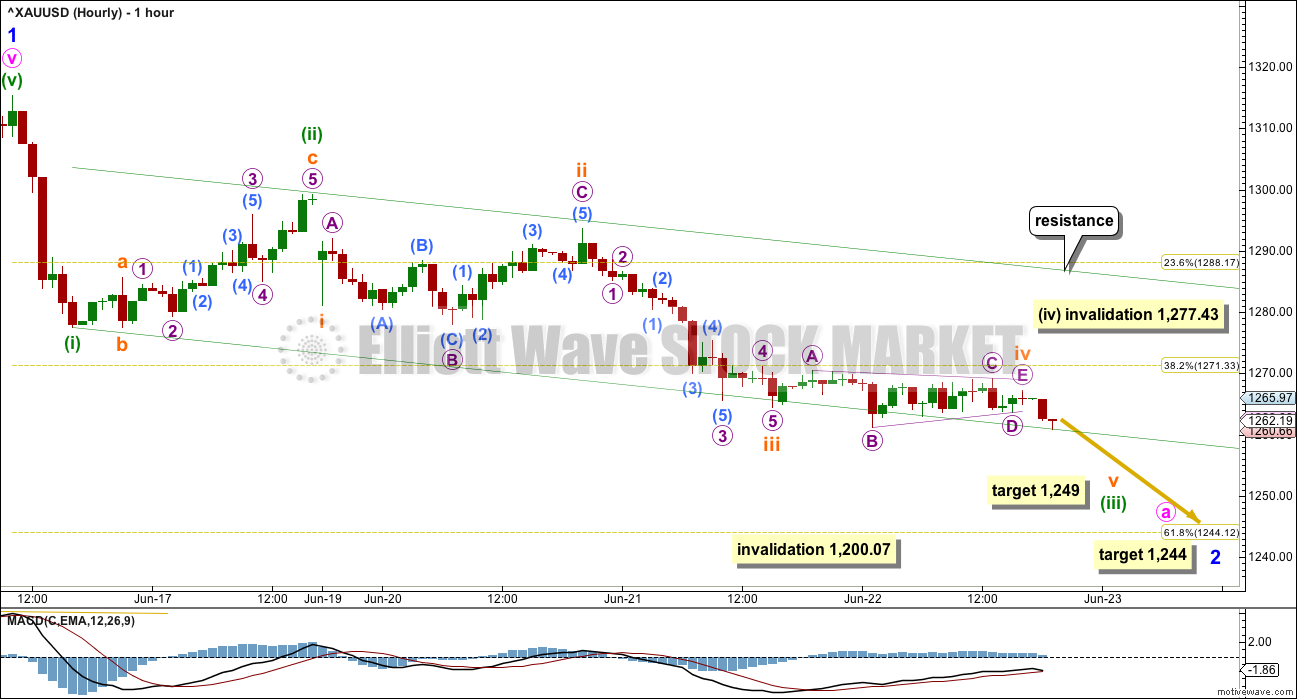
Minor wave 2 is most likely to be a zigzag. Zigzags subdivide 5-3-5.
So far minute wave a may be unfolding as an impulse. So far the third wave within it labelled minuette wave (iii) may be close to completion today.
Within minuette wave (iii), subminuette wave iii was just 0.23 short of 1.618 the length of subminuette wave i. At 1,249 subminuette wave v would reach equality in length with subminuette wave i. However, Gold’s fifth waves out of its fourth wave triangles are sometimes surprisingly short and brief. If this target is wrong, it will be too low and may not be met.
Within minuette wave (iii), there is alternation between the deep 0.69 expanded flat of subminuette wave ii and the shallow 0.09 running contracting triangle of subminuette wave iv.
The green channel is an acceleration channel about this impulse. Draw the first trend line from the end of minuette wave (i) to the last low. Keep redrawing the channel as price moves lower. Place a parallel copy on the high of minuette wave (ii). When minuette wave (iii) is over, then the upper edge of this channel should provide resistance for the correction of minuette wave (iv).
Minuette wave (iv) may not move into minuette wave (i) price territory above 1,277.43.
When minute wave a is a complete impulse, then minute wave b should unfold. It may be any one of more than 23 possible corrective structures and it is likely to be complex and time consuming. B waves within corrections are the most complicated movements. It may last over a week. It would not offer a good trading opportunity; markets should be avoided when low degree B waves unfold. While the arrow shows downwards movement to the end of minor wave 2 at 1,244, this is a general depiction only; it ignores a B wave within this downwards movement to come. The arrow should not be taken as an expectation that price will move in a straight line; that is not how corrections unfold nor how markets move.
If minute wave a subdivides as a five, then minute wave b may not move beyond its start above 1,315.38.
When minute wave b is complete, then another five down for minute wave c would complete the zigzag of minor wave 2.
HOURLY ELLIOTT WAVE COUNT – FLAT
Click chart to enlarge.
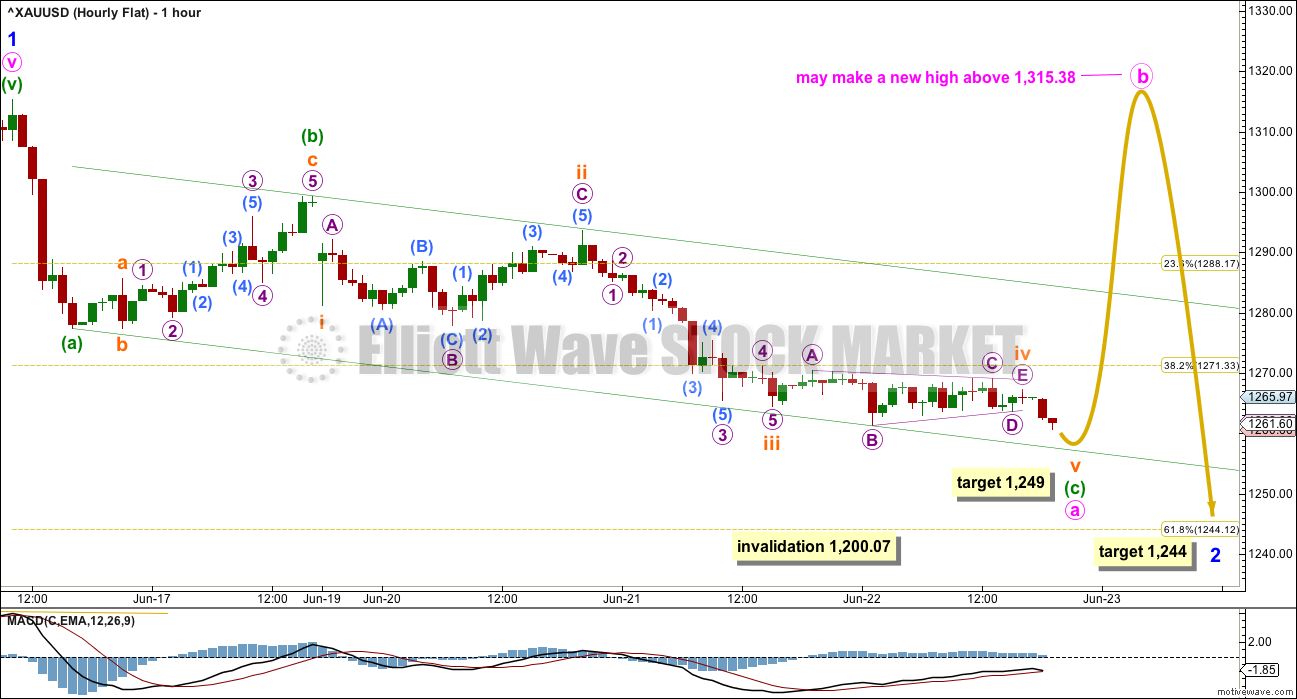
While minor wave 2 is most likely to be a zigzag, there is also a reasonable probability that it could be a flat correction. There is a good example of the most common type of flat, an expanded flat, on the daily chart for intermediate wave (2). Flats subdivide 3-3-5.
If minor wave 2 is unfolding as a flat correction, then within it minute wave a may be an almost complete zigzag. Labelling of subdivisions for both these hourly wave counts is the same, because a zigzag subdivides 5-3-5 in the same way as the start of an impulse subdivides 5-3-5.
When minute wave a is complete, then a new high above 1,277.43 would invalidate the first hourly chart (the zigzag for minor wave 2) and so confirm this flat correction idea for minor wave 2.
Within a flat correction, minute wave b should be very deep and may make a new high above 1,315.38 as in an expanded flat. Minute wave b would most likely be a single or multiple zigzag, but it may also be an expanded flat itself in order to be a deep correction. It may last for several days, possibly over a week.
Thereafter, a five down for minute wave c would complete a flat correction for minor wave 2.
HOURLY ELLIOTT WAVE COUNT – COMBINATION OR DOUBLE ZIGZAG
Click chart to enlarge.
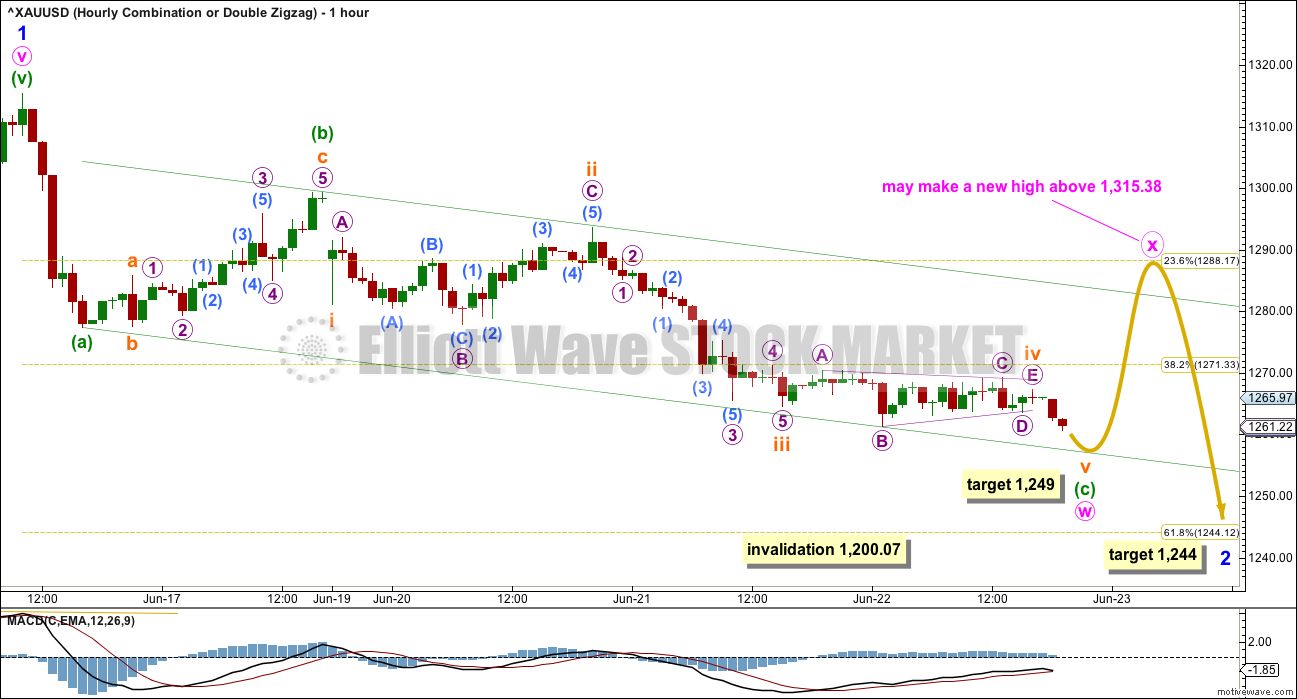
It is also reasonably possible that minor wave 2 could be a double combination or double zigzag correction.
The first structure in a double may be an almost complete zigzag labelled minute wave w. The double should be joined by a three in the opposite direction labelled minute wave x. X waves may subdivide as any corrective structure.
Double zigzags and double combinations have the same labelling, w-x-y, but they are very different structures with different purposes.
Double zigzags exist to deepen the correction when the first zigzag does not move price deep enough. Because second wave corrections can be very deep indeed double zigzags are fairly common structures for second waves. To achieve the purpose of deepening the correction their X waves are normally shallow and often also quick. They most often subdivide as zigzags. The second zigzag in the double labelled minute wave y should end substantially below the end of minute wave w, so that the whole structure has a downwards slope. It may end when price finds support at the lower edge of the black channel on the daily chart.
Double combinations exist to take up time and move price sideways. To achieve a sideways movement their X waves are often very deep and may make a new price extreme. Minute wave x may make a new high above 1,315.38. X waves within combinations are often time consuming and very complicated. The second structure in the double for minute wave y should end about the same level as minute wave w, so that the whole structure has a sideways look at a higher time frame.
ALTERNATE HOURLY ELLIOTT WAVE COUNT
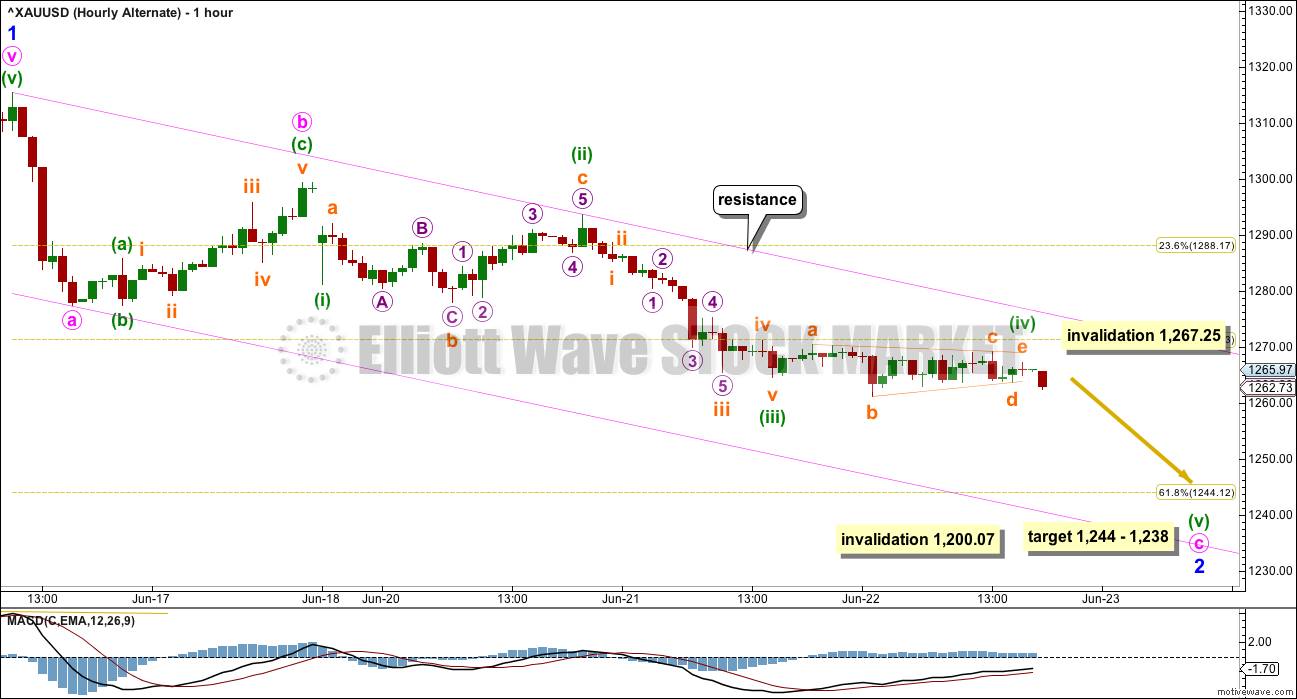
Click chart to enlarge.
Alternatively, the degree of labelling within the whole of minor wave 2 may be moved up one degree, it could be an almost complete zigzag. If it is over in one more day, it may total a Fibonacci five days.
The target is at 1,238 where minute wave c would reach 1.618 the length of minute wave a, and 1,244 where minor wave 4 would reach the 0.618 Fibonacci ratio of minor wave 1.
This alternate wave count is judged to have a lower probability due to the brevity of minor wave 2. It sees minor wave 2 as almost complete, which would be remarkably quick given that minor wave 1 lasted 14 sessions. This is possible but fairly unlikely. More patience should be taken while this correction unfolds.
When minute wave c is a complete five wave structure, then it would be possible that minor wave 2 is over. At that stage, classic technical analysis will be used to judge the probability of this idea. If any one or more of these conditions are met, then downwards movement may be over: On Balance Volume is at support, Stochastics is oversold, price shows a volume spike (small but increased relative to days immediately prior) and price is at support.
TECHNICAL ANALYSIS
DAILY CHART
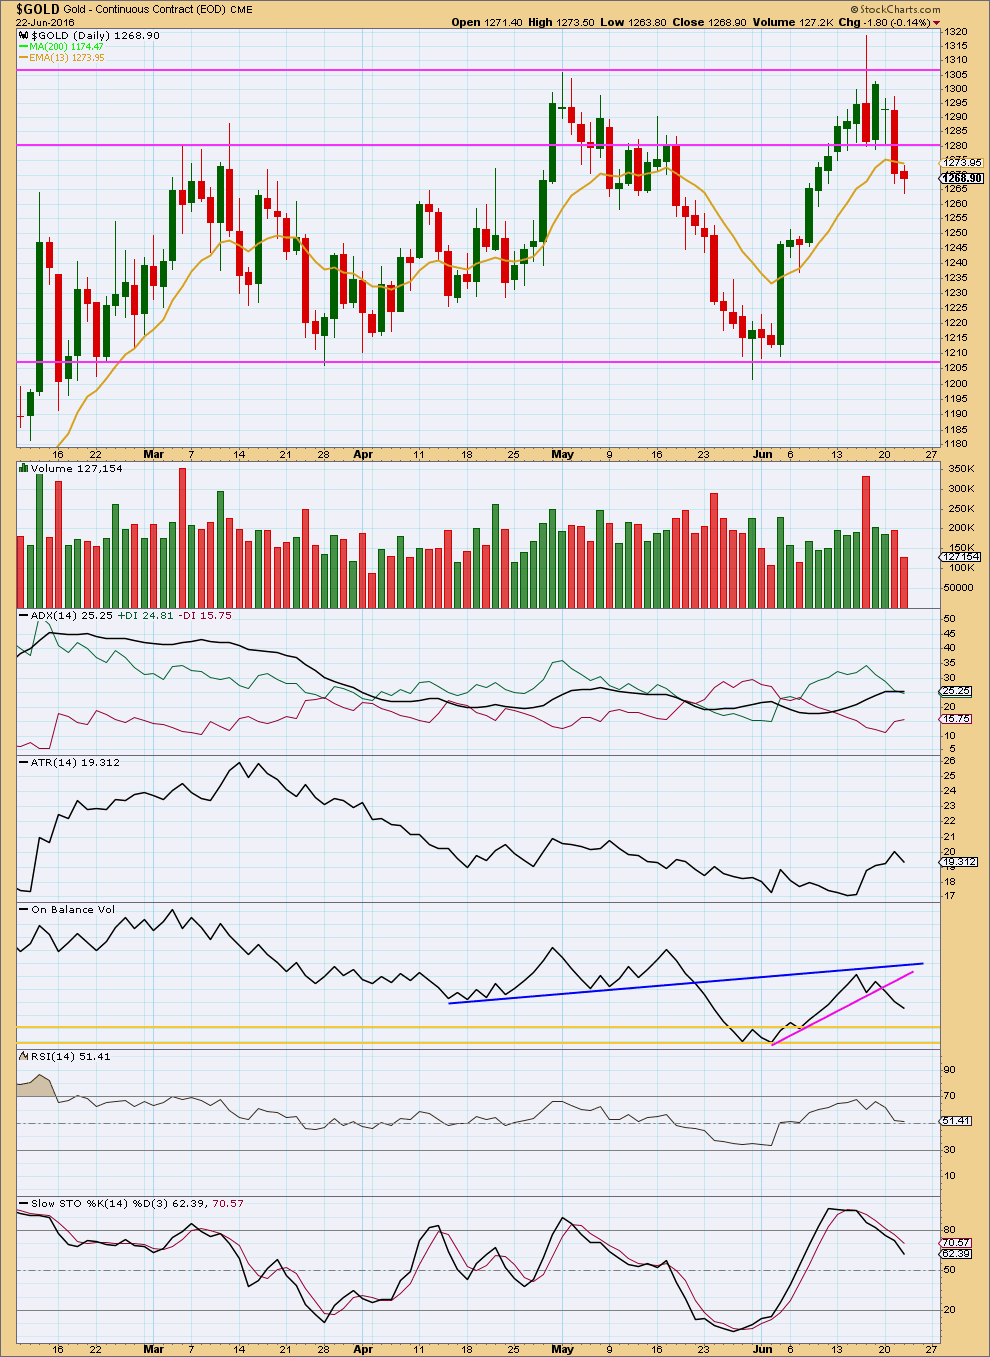
Click chart to enlarge. Chart courtesy of StockCharts.com.
A small real body for a small red candlestick on very light volume indicates the session was a corrective movement. Volume is declining as price is falling. The fall in price is not supported by volume. This supports the Elliott wave count which sees this downwards movement as a counter trend movement.
ADX is flat indicating the market is not currently trending. It has not indicated a trend change: the +DX line remains above the -DX line.
ATR is today declining also indicating the market is not trending. If ATR continues to decline, this would be clearer. For now it is only one day of decline.
On Balance Volume has space in which to move lower before it finds support. If when OBV comes to touch the upper yellow line, then if the Elliott wave count sees a complete corrective structure, then it may be over. If the structure is incomplete, then OBV may move lower to touch the second yellow line.
RSI is neutral. There is room for price to rise or fall. It shows no divergence with price.
Stochastics should be expected to continue lower until it reaches oversold and price finds support.
This analysis is published @ 08:53 p.m. EST.
Significant gold swings due to Brexit. Just wondering if gold can continue falling or is it on its way up from here. Also, it’s interesting that DUST didn’t gain any traction even when gold fell to 1251.
DUST lately works better in a day trade with a good drop otherwise miners are stronger than DUST as a frenzy of buyers on dips in miners.
Updated preferred hourly chart, other possibilities remain.
Minuette (iii) over quickly, the target was too low as suspected.
Minuette (iv) probably incomplete as some kind of running triangle, flat or combination.
Looks like gold dropped $5 in 20 minutes since 3:40 pm to the close due to news of Remain in Britain percentage increase.
If Remain how low could gold drop?
U.S. stocks rally as investors bet U.K. will vote to stick with EU
June 23, 2016 3:34 p.m. ET
A pair of polls released earlier showed support for “remain” slightly ahead while bookmakers also indicate a 76% probability of a vote to remain in the EU.
http://www.marketwatch.com/story/us-stocks-set-for-gains-after-brexit-polls-point-to-stay-vote-2016-06-23?mod=MW_story_top_stories
If the Minute wave a has ended had it subdivided as 5?
It looks like the alternate is invalidated very early on with a rise above 1267.25.
My current count is that Minute A has ended at 1257.36, and we are currently in minuette a of Minute B.
The spectre of Brexit/Bremain had so far accelerated the price movement.
Alan,
Thank you for fast reply.
How soon would you know if the scenario is zigzag, flat or combination?
If anyone suspect gold to drop tomorrow due to Brexit less likely?
At this stage it’s looking very much like a single or multiple zigzag.
After minute a finished for the flat correction chart price went into a sideways chop, which doesn’t fit the start of minute b up if it’s going to be deep.
What is the current possible scenario on a wave count?
By Avi Gilburt Wednesday, 22 June 2016
What Do The Fireworks In Metals Mean?
http://news.goldseek.com/GoldSeek/1466604300.php
Thx for sharing it.
Avi Gilburt Monday, June 20, 2016 Gold Paradigm Shift, Are You Prepared?
http://news.gold-eagle.com/article/gold-paradigm-shift-are-you-prepared/272
Brexit looking less likely
Watch those exit polls
Lara will you have any gold investment overnight on Thursday with Brexit poll for a Friday morning surprise?