
Price moved lower towards the target.
Summary: Minor wave 2 could be over, but it is still more likely that it will continue for a three or (more likely) another eight sessions. The target remains at 1,244. In the short term, some upwards movement for one to three days should be expected for a B wave.
New updates to this analysis are in bold.
To see last weekly charts click here.
DAILY ELLIOTT WAVE COUNT
Click chart to enlarge.
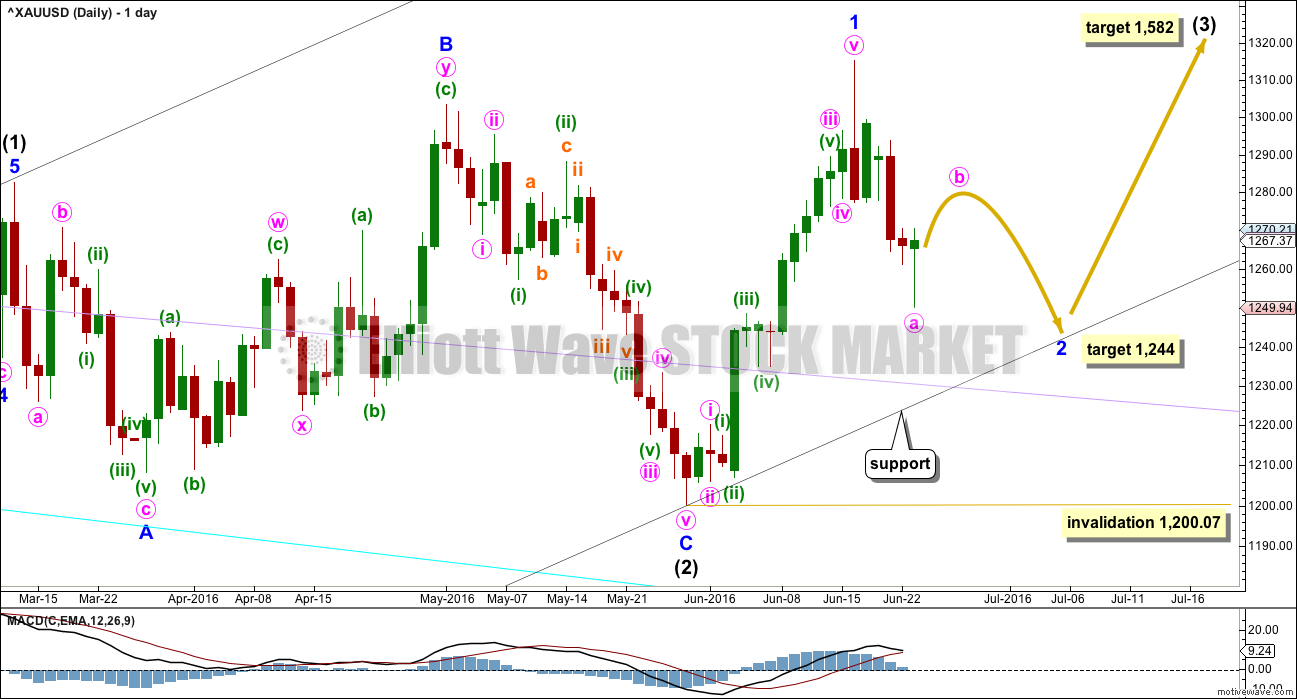
Intermediate wave (2) is a complete expanded flat correction. It is shallow 0.350 correction of intermediate wave (1) lasting 56 days, just one more than a Fibonacci 55. There is no Fibonacci ratio between minor waves A and C. Minor wave C is a complete impulse.
I have looked back at the last two big cycle degree up movements within the last bull market: the first move from the low at 255.05 in April 2001, and the next move from the low at 682.75 in October 2008. Within the first move, the beginning series of corrections were 0.76, 0.6 and 0.96 in depth. Within the second move, the beginning series of corrections were 0.82, 0.68, 0.57 and 0.45. My conclusion is this current correction expected to have begun 16th of June is more likely to be deep than shallow, even though intermediate wave (2) was shallow. Early corrections within a new trend are most often deep.
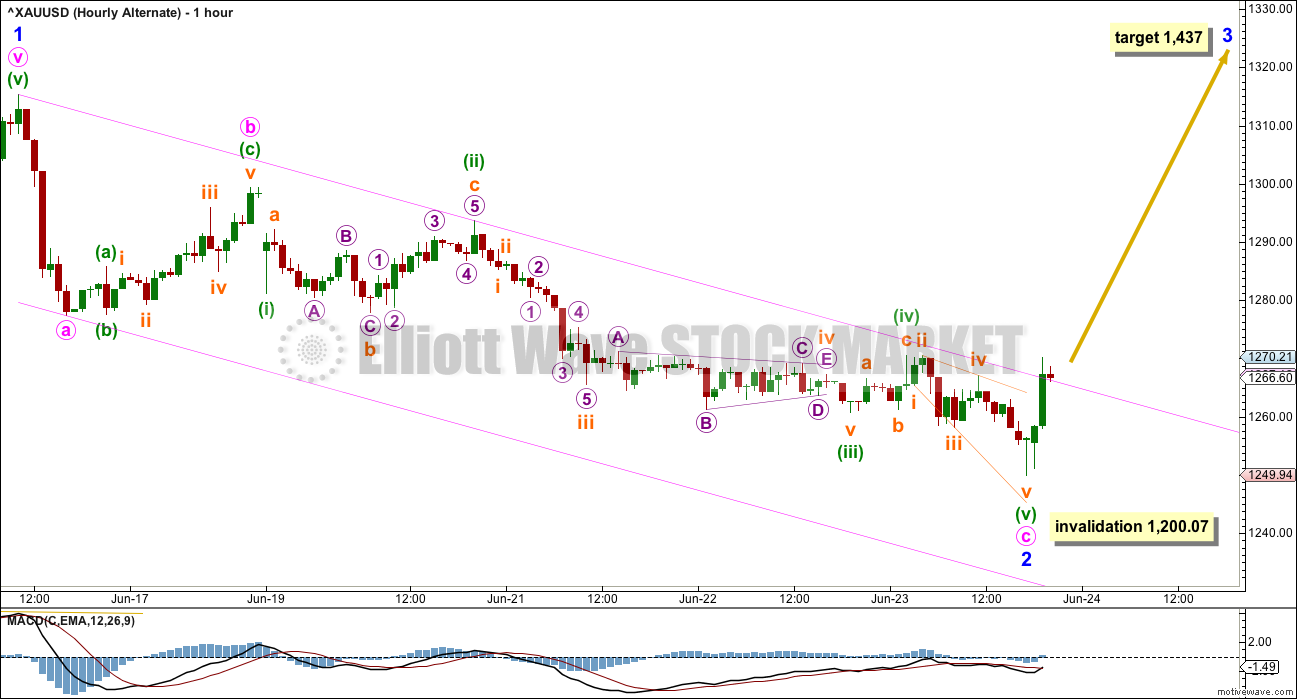
So far minor wave 2 has reached below the 0.382 Fibonacci ratio of minor wave 1 at 1,271 and the structure looks to be incomplete. The 0.618 Fibonacci ratio at 1,244 will now be the target. If this first target is wrong, it may now not be low enough. If price comes down to touch the lower edge of the base channel, then it may end there.
Add a base channel (black lines) to intermediate waves (1) and (2). Draw the first trend line from the low at 1,046.27 on 3rd December, 2015, to the low labelled intermediate wave (2), then place a parallel copy on the high of intermediate wave (1). If price comes down to touch the lower edge of this base channel, then long positions should be entered there. The lower edge of a base channel should provide support for lower degree second wave corrections. Base channels almost always work to show where lower degree corrections are contained, but almost always is not the same as always. Sometimes they are overshot or breached by small amounts, particularly for Gold early on in a new trend. If price breaks below the black channel, then the lilac trend line should offer final support (copy it from the weekly chart).
Minor wave 1 was over in 14 days, one more than a Fibonacci 13.
Minor wave 2 may be expected to last a Fibonacci 8, 13 or 21 days. This would give these waves good proportion which adds to the right look. So far it has only lasted five days and looks too brief and shallow at this stage to be over. The alternate hourly wave count below allows for it to be over today, totalling a Fibonacci five days. This is possible but highly unlikely. Classic technical analysis today indicates more downwards movement overall is still more likely.
Minor wave 2 may not move beyond the start of minor wave 1 below 1,200.07.
At 1,582 intermediate wave (3) would reach 1.618 the length of intermediate wave (1).
HOURLY ELLIOTT WAVE COUNT – ZIGZAG
Click chart to enlarge.
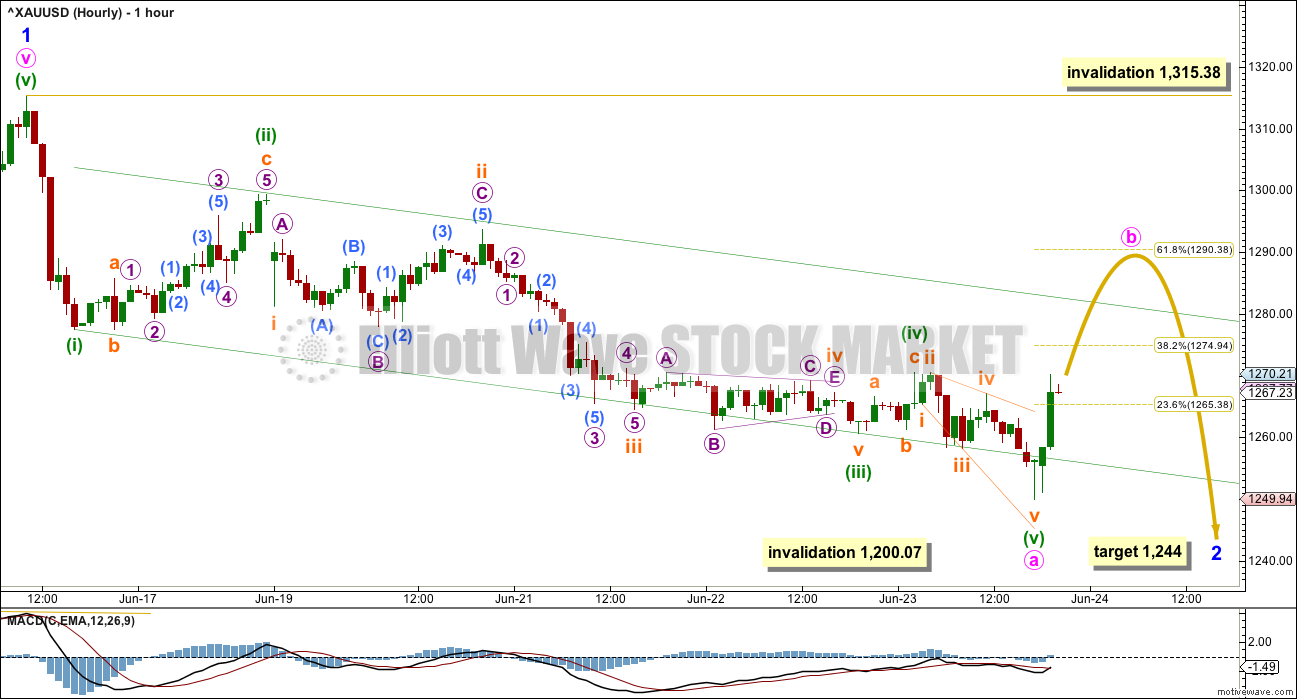
Minor wave 2 is most likely to be a zigzag. Zigzags subdivide 5-3-5.
So far minute wave a may be a complete impulse. Ratios within minute wave a are: minuette wave (iii) is 0.66 longer than equality in length with minuette wave (i), and minuette wave (v) has no Fibonacci ratio to either of minuette waves (i) or (iii).
Ratios within minuette wave (iii) are: subminuette wave iii was just 0.23 short of 1.618 the length of subminuette wave i, and subminuette wave v is just 0.34 short of 0.382 the length of subminuette wave i.
Within minuette wave (iii), there is alternation between the deep 0.69 expanded flat of subminuette wave ii and the shallow 0.09 running contracting triangle of subminuette wave iv.
Within minute wave a, there is alternation between the (possible) regular flat of minuette wave (ii) and the zigzag of minuette wave (iv).
The green channel is today redrawn using Elliott’s first technique for an impulse about minute wave a. When upwards movement breaks above the upper edge of this channel, it would add confidence to this wave count and would be indicating a possible trend change from down to up short / mid term.
Minute wave b may not move beyond the start of minute wave a above 1,315.38. Minute wave b may be any one of more than 23 possible corrective structures. Targets for it to end would be the 0.382 Fibonacci ratio at 1,275, or the 0.618 Fibonacci ratio at 1,290. Both targets are equally as likely. Minute wave b may be very choppy and overlapping. Of all Elliott waves it is B waves which exhibit the greatest variety in form and structure. They do not present good trading opportunities.
When minute wave b is complete, then another five down for minute wave c would complete the zigzag of minor wave 2.
HOURLY ELLIOTT WAVE COUNT – FLAT
Click chart to enlarge.
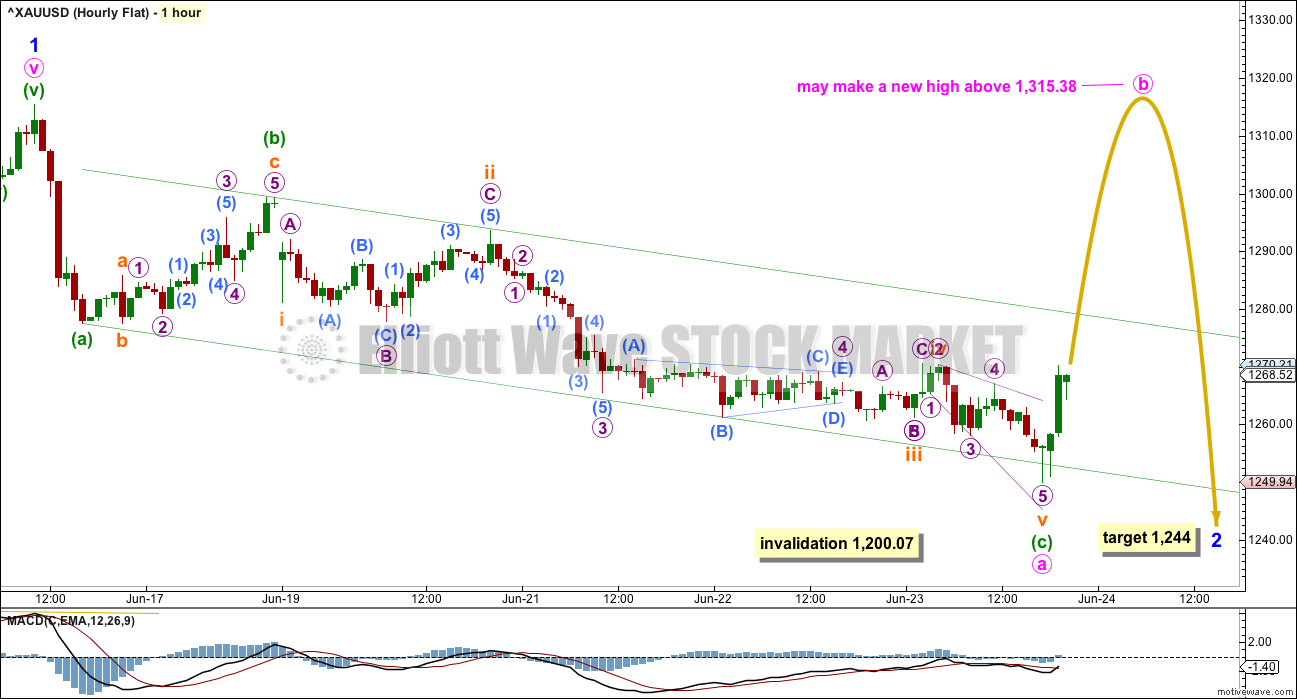
While minor wave 2 is most likely to be a zigzag, there is also a reasonable probability that it could be a flat correction. There is a good example of the most common type of flat, an expanded flat, on the daily chart for intermediate wave (2). Flats subdivide 3-3-5.
If minor wave 2 is unfolding as a flat correction, then within it minute wave a may be a complete zigzag. Labelling of subdivisions for downwards movement for this wave count is different today. The problem here is the proportion of micro waves 2 and 4 within subminuette wave iii; they are grossly disproportionate which gives the wave count the wrong look. All possibilities should be considered though. This does reduce the probability of this alternate today.
There is no Fibonacci ratio between minuette waves (a) and (c).
Ratios within minuette wave (c) are: there is no Fibonacci ratio between subminuette waves iii and i, and subminuette wave v is just 0.18 longer than 0.618 the length of subminuette wave iii.
Seeing this downwards movement to the last low as a three does not have as good a fit as a five. This reduces the probability of a flat correction (or combination) today and increases the probability of a zigzag (first wave count)
A new high above 1,277.43 would invalidate the first hourly chart (the zigzag for minor wave 2) and confirm this flat correction idea for minor wave 2.
Within a flat correction, minute wave b should be very deep and may make a new high above 1,315.38 as in an expanded flat. Minute wave b would most likely be a single or multiple zigzag, but it may also be an expanded flat itself in order to be a deep correction. It may last for several days, possibly over a week.
Minute wave b must retrace a minimum 0.9 length of minute wave a at 1,308.84. The normal range of minute wave b within a flat is 1 to 1.38 the length of minute wave a, giving a range between 1,315.18 to 1,340.25.
Thereafter, a five down for minute wave c would complete a flat correction for minor wave 2.
HOURLY ELLIOTT WAVE COUNT – COMBINATION OR DOUBLE ZIGZAG
Click chart to enlarge.
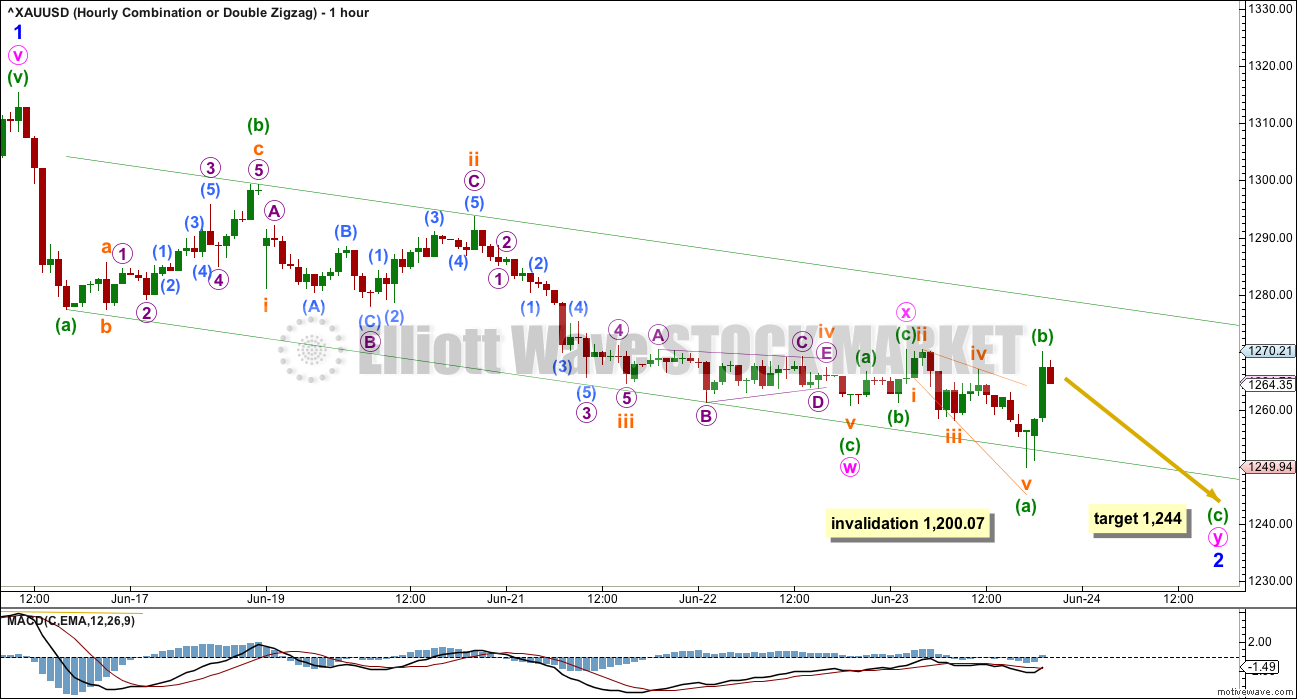
It is also reasonably possible that minor wave 2 could be a double combination or double zigzag correction.
The first structure in a double may be a complete zigzag labelled minute wave w. The double should be joined by a three in the opposite direction labelled minute wave x. Minute wave x should now be over for this wave count. The second zigzag in a double should now be underway. Within it minuette wave (b) may not move beyond the start of minuette wave (a) above 1,270.51. If labelling of minute wave x as complete is correct, then this idea should be invalidated with a new high above 1,271.51.
Double zigzags and double combinations have the same labelling, w-x-y, but they are very different structures with different purposes.
Double zigzags exist to deepen the correction when the first zigzag does not move price deep enough. Because second wave corrections can be very deep indeed double zigzags are fairly common structures for second waves. To achieve the purpose of deepening the correction their X waves are normally shallow and often also quick. They most often subdivide as zigzags. The second zigzag in the double labelled minute wave y should end substantially below the end of minute wave w, so that the whole structure has a downwards slope. It may end when price finds support at the lower edge of the black channel on the daily chart.
Double combinations exist to take up time and move price sideways. To achieve a sideways movement their X waves are often very deep and may make a new price extreme. If labelling of this structure so far is correct, then it does not look like a combination, minute wave x is too brief and shallow.
ALTERNATE HOURLY ELLIOTT WAVE COUNT
Click chart to enlarge.
Alternatively, the degree of labelling within the whole of minor wave 2 may be moved up one degree, it could be a complete zigzag. If it is over today, it may total a Fibonacci five days.
This alternate wave count is judged to have a lower probability due to the brevity of minor wave 2. It sees minor wave 2 as complete, which would be remarkably quick given that minor wave 1 lasted 14 sessions. This is possible but fairly unlikely. More patience should be taken while this correction unfolds.
There is no classic technical analysis today which indicates a low in place. RSI is neutral and exhibits no divergence, Stochastics has not yet reached oversold, and On Balance Volume has not yet reached support. At this stage, this wave count is possible but has a low probability.
One approach to this problem may be to enter a long position here with a stop just below invalidation at 1,200.07. If price moves up over the next 24 hours, then move stops up to break even to eliminate risk as soon as possible. If this wave count is correct, then a good entry to ride a third wave up would be had. If it is wrong, then risk should be no more than 1,200.07 and risk should be eliminated quickly if the position becomes positive. If this wave count is wrong and positions are held, then they may experience a week or so of pain before coming positive. It is left up to each member to make their own judgement for this situation. Always use a stop loss and do not invest more than 3-5% of equity on any one trade.
TECHNICAL ANALYSIS
DAILY CHART
Click chart to enlarge. Chart courtesy of StockCharts.com.
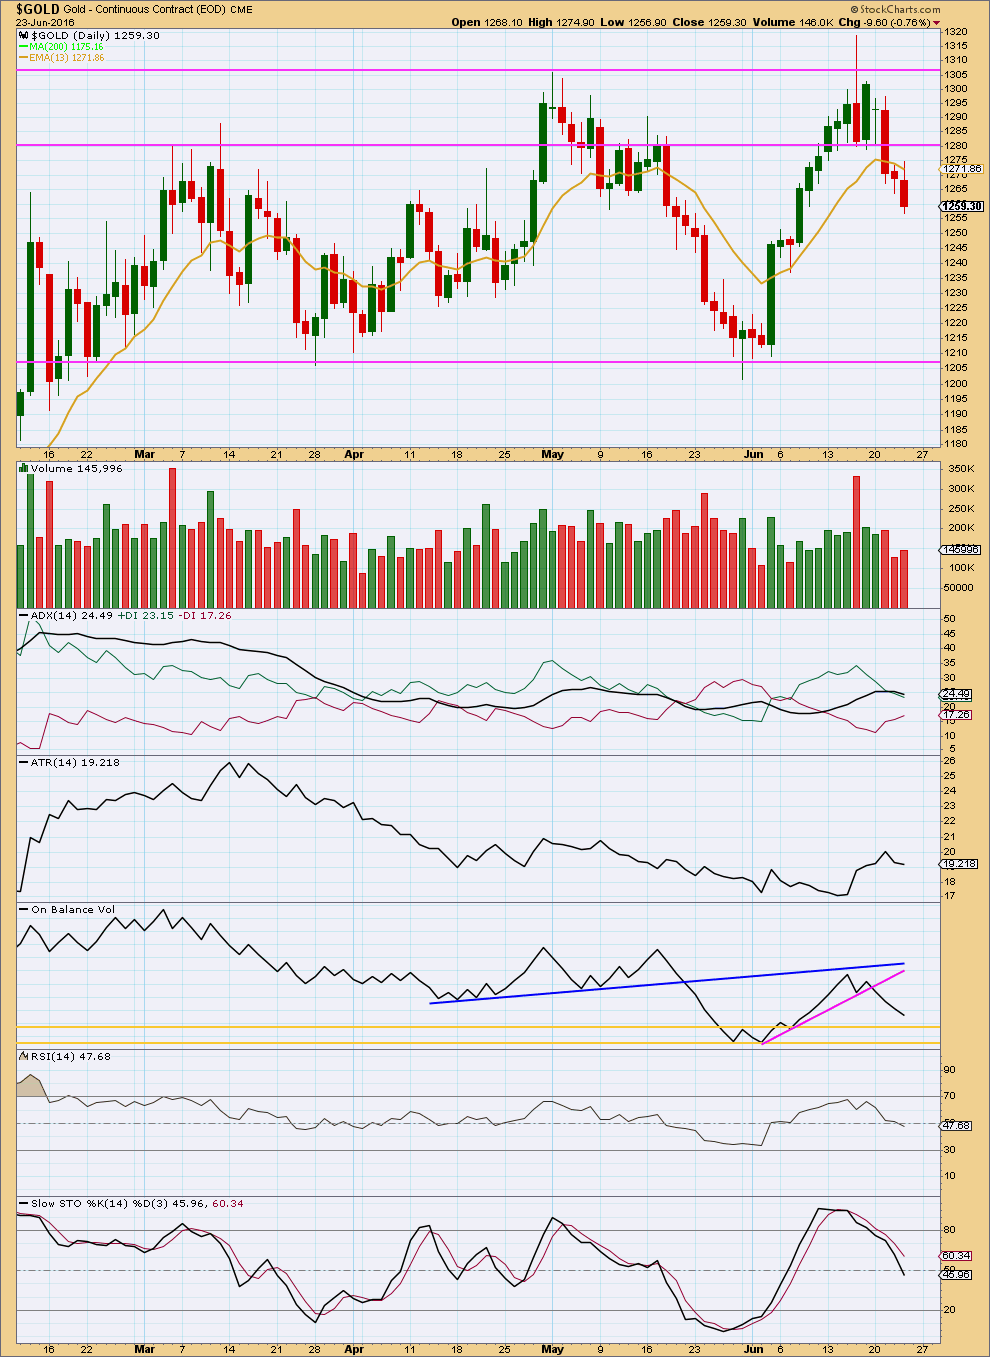
There is some support today for downwards movement, but with volume still lighter than two days ago this does not look like a volume spike at the end of a movement. More downwards movement overall may be expected.
ADX is declining indicating the market is not trending. ATR agrees as it too is declining. A range bound approach to trading this market should be employed, or traders should step aside and wait for a trend to reemerge before reentering.
On Balance Volume has not found support and so more downwards movement from price overall may be expected until OBV comes to touch the yellow line.
RSI is neutral and exhibits no divergence with price. It is not indicating a low is in place. There is still room for price to fall.
Stochastics is still close to neutral. More downwards movement from price may be expected until price finds support and Stochastics reaches oversold at the same time.
This analysis is published @ 09:25 p.m. EST.
Daily Chart
Analysis may be a bit later than usual today, but this will be the daily chart for you today
Hi, I’m here.
Looks like the alternate was correct. Minor 3 is underway. Currently looking at a long entry while this correction ends.
Short term looks like a small triangle for a B wave may be unfolding, target for correction to end 1,291.
Long positions entered here should be profitable fairly soon, stops must be set just below invalidation. That’s the risk today with this wave count.
Lara, are you here today? Are you thinking 3rd wave or minute c of minor 2? Please advise.
It does remain possible that minor 2 is continuing as an expanded flat.
That will be the alternate as per this chart.
StockCharts data for this session isn’t available so I can’t yet do any classic TA to determine probability. But looking at the strength of this move and what the stock markets are doing, this would be my expectation.
Minor 3 underway.
Alternate, minor 2 could move lower. Less likely.
Your opinion and charting is all I really need. 🙂 Thanks much!!
You’re welcome. I’m curious, how many members took the trading advice offered here and entered long close to the low?
If you missed out (as did I) then I think we shall have a good opportunity early next week.
As indicated some time ago our thought ,along with some others ,was that we are in a “stealth bull market” in gold. We bottomed last December at around 1060 on the August gold Comex contract, and after completing wave 1 at 1303 we had only a small correction to 1253 yesterday. We are now in a third of a Third wave up (longest and strongest wave) We were cautioned by Lara to possibly look for only a minor correction . This is what happens in stealth Bull markets as in 1974 to 1979-1980. I have been long gold comex contracts since March ,and stayed long on the recent second wave drop, as now margin requirements have doubled for gold contracts (from past experience I knew this would likely happen ,so since I was already in I needed no more margin and I have made it up on equity gains overnight. Fortune favors the bold. Stephen ,New London CT. USA.
no guts, no glory!
PS I am now adding to my long position as we have dropped back sufficiently from the highs last night . Stephen, New London (Home of the Brave)
What is the current wave count?
This may be setting up as minute wave B completing overnight and now we are headed down in a wave C possibly
GDX possible inverted H&S pattern. Looks like it will open near the neckline @ 27.5. Needs to breakout for confirmation, then target = 32.
Two hourly possibilities. The first one is that we just completed Minute wave 2 and are going much higher.
The second one is that we just completed Minuette wave 4. If this is the case, we will make a new high before starting a Minute wave 2 correction. Then we will move much higher.
Gold’s $100 range in few hours needs a new EW count????
Minor 2 was over,Minor 3 over and minor 4 must begin.
What will be the target for minor 4?????
Minor 3 is unlikely to be over. Lara’s target is 1,437.
Gold is falling pretty steadily; now at 1313. I’m wondering if the miners will sell off regardless of the gold price due to the markets selling off? On an epic night, I’d love to hear thoughts from Lara who I believe noted that Minor 3 was not here yet for a number of reasons and expected a deep correction as well. Just some thoughts…
The miners are following Gold. GDX up 7% pre market and NUGT up 21%
I just watched ‘LIVE’ the England poll counter Official event 100% counted LEAVE WON!!!!!! No more polls it is 100% finalized LEAVE WON.
IKR! A bit surprising, but now we know.
I wonder how long it will take the British government to enact this. Will they drag it out too long?
Was the referendum binding? We’ve had referendum in NZ… which out government then ignores if they don’t like the result. Not sure the British government could ignore this one… they’d have rioting in the streets I think.
Brexit will take several years or more to implement and the government can’t ignore it.
1:09am Asian markets plunge on Brexit; Nikkei has worst day in 5 years
12:42 am Expect Brexit to rattle U.S. economy, send dollar surging
12:35am Nikkei 225 suspended for trade as circuit breakers kick in
Indications that the “leave” vote has won sets up global markets for the most volatile and frightening trading day since the market sank last August on fears about a slowdown in China’s stock market.
As Alan stated below, expect Minor 3. Hopefully Lara will stop by and give us better targets, but this is what I have for now.
At 1,370, Minor 3 would = Minor 1 and at 1,442, Minor 3 would = 1.618 x Minor 1. One of these targets is likely where the next multiday correction will start and it will likely be shallow since Minor 2 was over 50 % correction.
BBC and ITV call U.K. to leave EU in historic Brexit vote
June 23, 2016 11:54 p.m. ET
The early hours of Friday morning the two news stations forecast that the “leave” campaign has won the Brexit referendum and that the U.K. will sever its ties with the union.
http://www.marketwatch.com/story/bbc-and-itv-call-uk-to-leave-eu-in-historic-brexit-vote-2016-06-23-23915452
Historic Brexit vote sends Dow futures plunging 700 points.
I think only the expanded flat Minute B of Minor 2 and the alternate hourly remain.
The high (so far) of 1358.57 (which could be all of Minute B) is only 1.49 longer than 1.618 of Minute A.
Obviously, the alternate hourly of Minor 3 will be a runaway increase.
The sentiment due to Brexit would be the deciding factor over which count will be correct.
Stop: Latest news have it that Brexit is the order of the day. So, expect Minor 3. I will go long on a retrace. Happy trading (for substantial gains)!
Hi Lara, /YG passed $1362. Is minor wave 2 already over? Is gold on its way to minor wave3?
SOS calling Lara
The Golden Rocket ship left without some of us.
We are still packing our luggage we thought it was tomorrow?
Hopefully it runs out of fuel and comes back for us as it may be going too fast.
I’ve tried calling but it’s out of range I think it may be leaving orbit I hope not.
With more than two thirds of ballots now counted, the BBC forecasts that UK has voted to leave the European Union by 52% to 48%.
There’s still an opportunity to enter long Richard, the market is currently in a small correction.
Each and every correction will offer an opportunity to enter long.
The risk today is an expanded flat is still completing for minor 2. When StockCharts data is finalised then I can judge that probability. For now I think the strength of this upwards movement is minor 3.
For those, still up and, are interested, here:
http://www.bbc.com/news/politics/eu_referendum/results
All “normal” waves and resistance lines gone,.. any ideas how far this will go up?
And then? Sharply back down again?
It’s crazy, but a “Remain” result could erase all those gains, just as fast!
unfortunately looks really like BREXIT,… leaving…
Why unfortunate?
Countries have historically shed a lot of blood fighting for independence. This one is done without bloodshed (almost), so rejoice with exhilaration.
It makes the people stronger and have a steely resolve to drive the country to succeed. I know, mine did 50 years ago, and there is no looking back.
The only entities who are sad are the bureaucratic “elite” and the crooked banksters. They stand to lose the most. To wit, all the scaremongering, threats and blackmail over the last few days. The rational populace has spoken with a vehemence.
Well said Alan.
Yes, well said.
Go the Brits! They’ve made their wishes known.
Safe Haven’s spiking.
Gold $1,30 at 11:48 pm up $85 in the last 90 minutes.
The ship left without a lot of us.
The main hourly chart is invalidated above 1,315.38.
The US Dollar index DXY is up 4.5 %
http://www.investing.com/quotes/us-dollar-index-streaming-chart
I suppose it goes without saying, the third wave has commenced.
LOL… the way its going target (1437) will reach tomorrow
Sorry I meant $1,360
Already reached 1360 and now? further up or down?
This is going to be a day to remember for years to come, in the markets.
In the markets and much, much more if final vote is Britain leaves.
Gold is at 1,310 at 11:30 pm
The GBPUSD ES mini are getting crushed.
Pound tanks, stock futures tumble as Brexit vote points to ‘leave’ –
With 163 of the 382 counting areas having announced results, the exit camp was ahead with 51.2% of the votes versus 48.8% for the “stay” camp.
Gold is rallying strongly on safe haven demand
http://www.marketwatch.com/story/pound-tanks-stock-futures-tumble-as-brexit-vote-points-to-leave-2016-06-23