
Upwards movement was expected, but not as much as unfolded.
Summary: Minor wave 3 may have begun. Short term expectations are for price to move lower early next week. This should offer a good opportunity to join the upwards trend at a good price. The initial expectation would be for a downwards reaction to end about 1,291. There is a possibility still that the downwards reaction may go as low as 1,244, but this looks less likely now.
New updates to this analysis are in bold.
To see last weekly charts click here.
DAILY ELLIOTT WAVE COUNT
Click chart to enlarge.
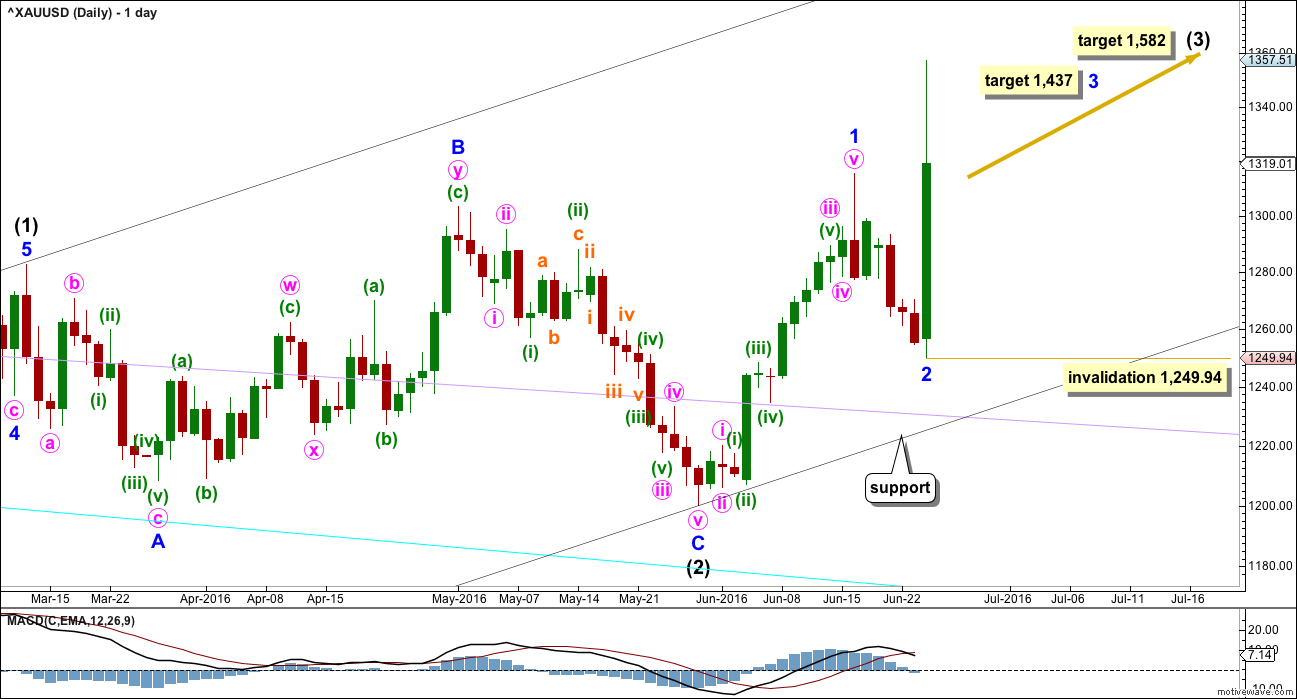
Intermediate wave (2) is a complete expanded flat correction. It is shallow 0.350 correction of intermediate wave (1) lasting 56 days, just one more than a Fibonacci 55. There is no Fibonacci ratio between minor waves A and C. Minor wave C is a complete impulse.
I have looked back at the last two big cycle degree up movements within the last bull market: the first move from the low at 255.05 in April 2001, and the next move from the low at 682.75 in October 2008. Within the first move, the beginning series of corrections were 0.76, 0.6 and 0.96 in depth. Within the second move, the beginning series of corrections were 0.82, 0.68, 0.57 and 0.45. My conclusion is this current correction expected to have begun 16th of June is more likely to be deep than shallow, even though intermediate wave (2) was shallow. Early corrections within a new trend are most often deep.
Minor wave 2 may have been a quick, deep 0.57 zigzag over in just six sessions. If minor wave 3 has begun there, then at 1,437 it would reach 1.618 the length of minor wave 1.
Add a base channel (black lines) to intermediate waves (1) and (2). Draw the first trend line from the low at 1,046.27 on 3rd December, 2015, to the low labelled intermediate wave (2), then place a parallel copy on the high of intermediate wave (1). If price comes down to touch the lower edge of this base channel, then long positions should be entered there. If minor wave 2 is not over as per the alternate below, then it may end when price comes down to touch the lower black trend line.
Within minor wave 3, no second wave correction may move beyond the start of its first wave below 1,249.94.
At 1,582 intermediate wave (3) would reach 1.618 the length of intermediate wave (1).
HOURLY ELLIOTT WAVE COUNT
Click chart to enlarge.
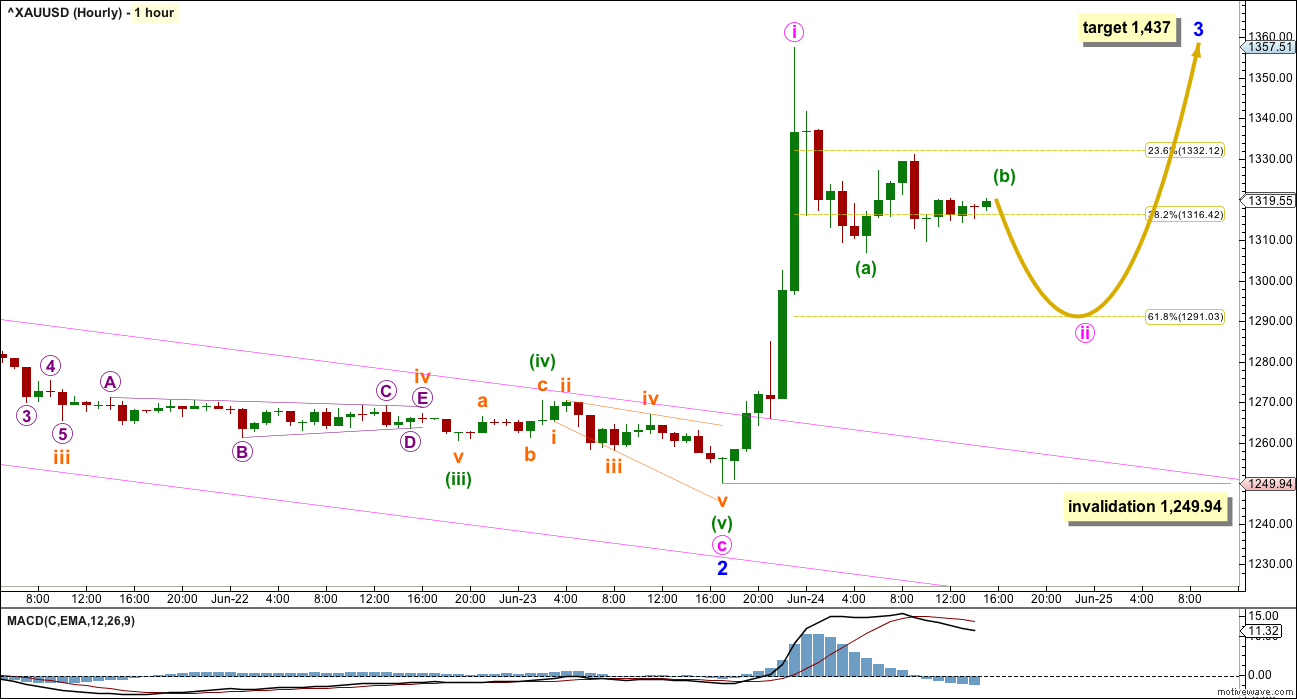
Minor wave 2 may be a complete zigzag. This was judged to be an unlikely alternate in last analysis. A trading approach to this possible problem outlined in last analysis advised to enter long at the low in case this alternate was correct. If any members took that advice and did enter long positions, then stops should now be moved up to break even. There is still a risk that minor wave 2 could continue as per today’s alternate. Moving stops to break even would eliminate this risk and hold a position that may be a perfect entry for a long term upside trade.
There may be a very good opportunity coming up on Monday for members who have not entered long already. Minute wave ii does not look complete; sideways movement looks like a small triangle. The triangle looks like a B wave within a B wave, so price may break out upwards for a short thrust to complete minuette (b), and then a small five down may complete minuette wave (c) of the zigzag for minute wave ii.
Minute wave ii may reach down to about the 0.618 Fibonacci ratio at 1,291. If price does get down to this point or lower, then long positions may be entered with stops just below invalidation. Minute wave ii may not move beyond the start of minute wave i below 1,294.94. Stops may be set just below 1,200.07 for the more risk tolerant, but this must accept the possibility of an underwater position for a few days.
A minimum downwards expectation for minute wave ii would be for minuette wave (c) to move at least slightly below the end of minuette wave (a) at 1,306.88 to avoid a truncation.
ALTERNATE HOURLY ELLIOTT WAVE COUNT
Click chart to enlarge.
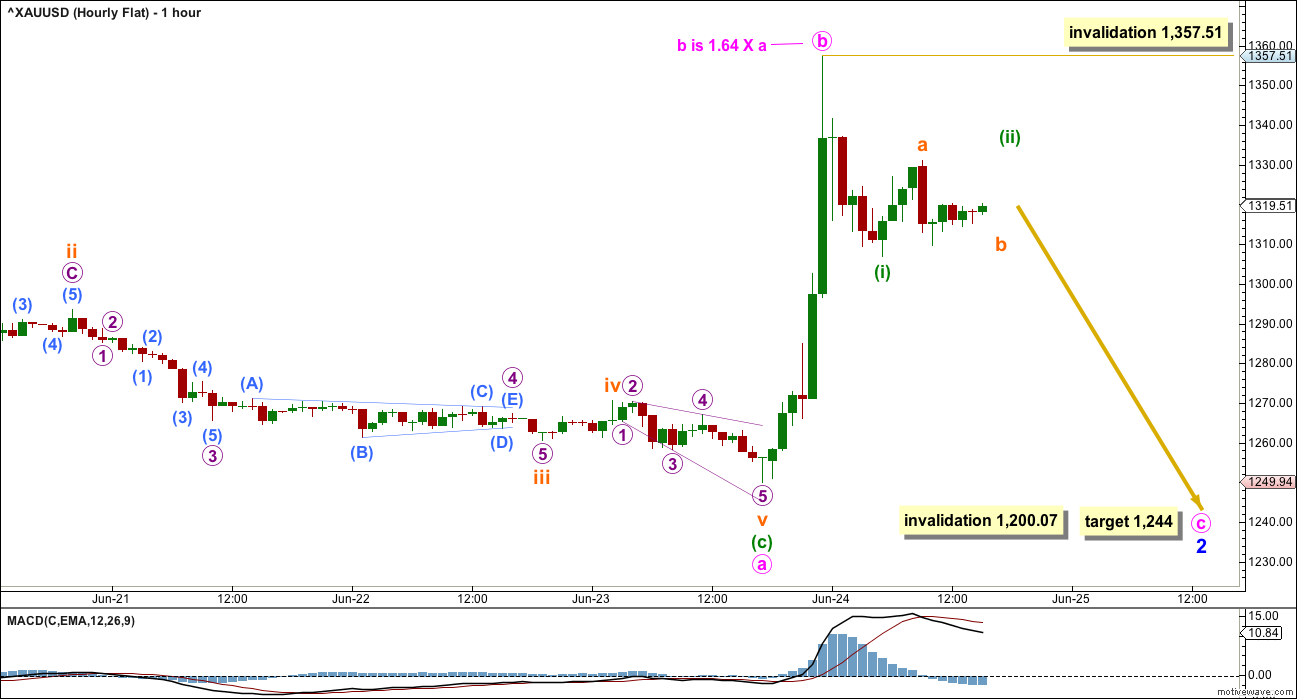
This idea was judged to have a good probability in last analysis. It is still entirely possible and this is the risk today to any long positions.
Minor wave 2 may be an incomplete expanded flat correction. Within minor wave 2, minute wave b is a 1.64 correction of minute wave a. This is longer than the common length of a B wave within a flat of up to 1.38, but within the allowable limit of up to 2 times the length of minute wave a.
Minor wave 2, if it continues lower, would most likely end about the 0.618 Fibonacci ratio of minor wave 1 at 1,244. If it is deeper than this, it may end when price comes down to touch the lower edge of the black channel on the daily chart.
TECHNICAL ANALYSIS
DAILY CHART
Click chart to enlarge. Chart courtesy of StockCharts.com.
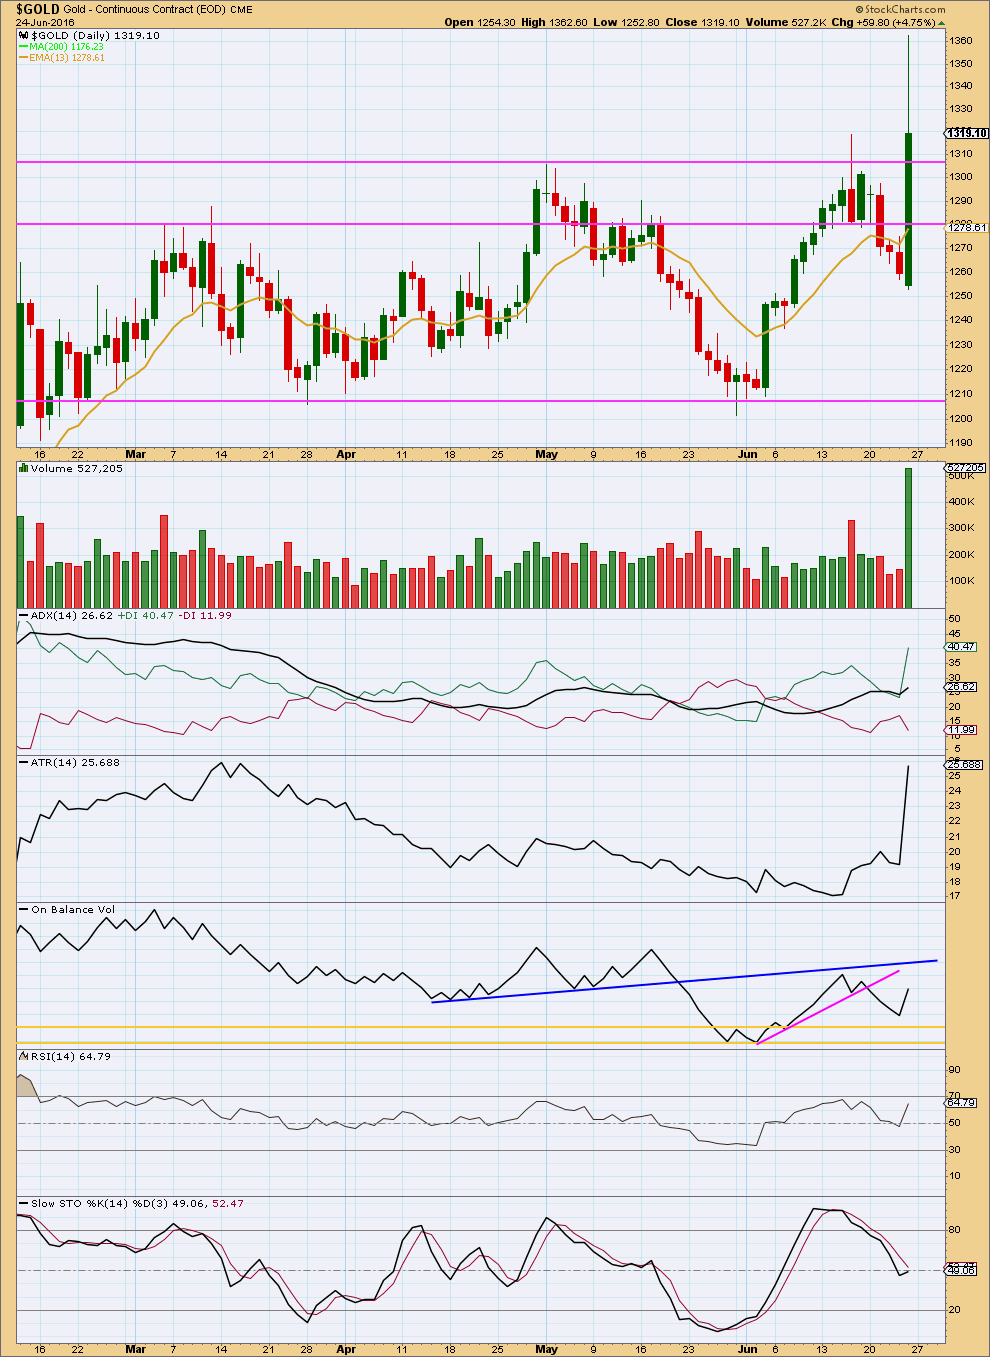
A strong upwards day comes with a strong increase in volume. The rise in price was supported by volume. This supports the main hourly Elliott wave count over the alternate.
ADX is increasing indicating an upwards trend. ATR agrees as it too is increasing. It seems clear the upwards trend has resumed.
On Balance Volume did not come down to find support at either of the yellow lines. There is divergence between the high of Friday and the prior high of 16th June between OBV and price; price made new highs on Friday but OBV did not. This indicates some weakness to upwards movement and supports the idea of a downwards reaction to move price lower early next week. It does not tell how low that reaction may go though, so it does not indicate which hourly wave count is correct.
There is some divergence between the high of Friday and the prior high of 16th June between price and RSI. Despite a very strong upwards day for Friday RSI indicates there was some weakness to upwards movement in price. This also supports the idea of a downwards reaction to move price lower early next week.
This analysis is published @ 09:15 p.m. EST.
Two ideas for main wave count which sees minor 3 underway.
Minute ii looks incomplete. Sideways movement looks like a B wave. It’s either this….
or this
Lara,
This sideways range bound correction seems like a minuette (iv) of Minute [i]
Normally a minute [ii] should have been deeper and likely a ZZ?
Any thoughts, thanks
Likely a running flat (BULLISH) for a minuette (iv) ending at 11:50 EST at 1320.80 low for GCQ (Aug. Gold)?
Minute 2 Minuette 3 Subminuette 2.
Simple zigzag.
Thanks Alan as usual you know your EW counts.
Hopefully it is your own personal Money Tree!
Has the professional TOS charting assisted you in any way?
Richard, no.
I was too tied up over the weekend to go into TOS.
Did any one noticed relationship of USD with Gold on Friday melt up for both?
So much for inverse relationship of gold with USD.
It may be very well over the long term but for daily or in short term one can not rely on it.
It’s not a surprise. Both are safe haven. Gold obviously. USD because British pound is sure to drop, and Euro is very dicey because of the French and Italian push for a referendum. If France and Italy goes, EU will unravel. Britain is not so bad. It does not even use the euro and is technically not a EU country. This constitutes social mood.
This time both safe heaven worked. Last time around Sept 2008 market crash was in the making thinking safeheaven assets should do well.
WELL!! USD and bond did well but Gold went down with the market in massive liquidation. Rest is history.
History did not repeat today?????LOL!!
GUNNER24 at end half of analysis discusses Gold, then GDX then HUI
Fw: Brexit opens Pandora’s Box
June 26, 2016
http://www.gunner24.com/newsletter/nl-062616/
Just so everyone knows, the video will be uploaded early my time Sunday morning (Saturday evening EST). I didn’t forget it, but it will be later this week than the text analysis.