
Sideways movement fits the expectations overall for the main hourly Elliott wave count in last analysis.
The picture today is a little clearer for the short term.
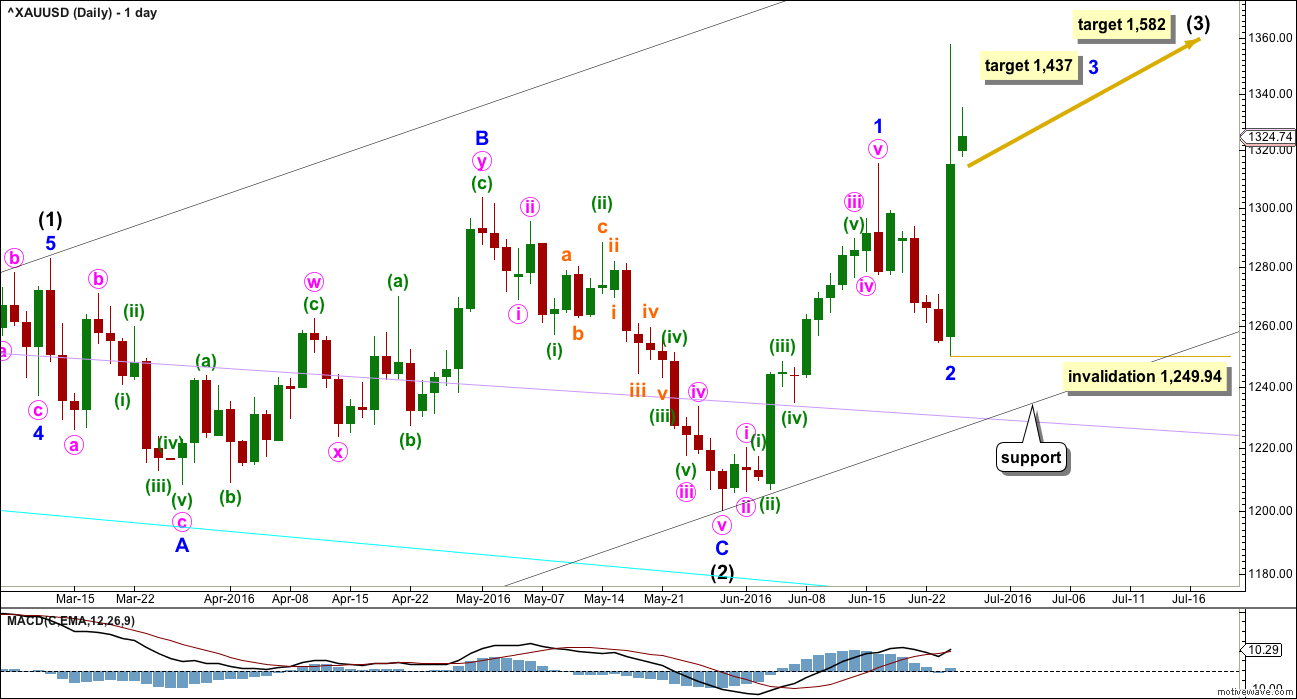
Summary: Minor wave 3 has very likely begun. In the short term, it looks very likely that price will move lower for a correction to end, with the target at about 1,291. If this is correct, then it would offer a good opportunity to join the upwards trend for a third wave up at three degrees.
Trading advice: If price does move lower as expected, then enter long if it gets down to 1,291. The difficult aspect today is where to set stops. Ideally, stops should be set just below 1,200.07 to allow the market room to move, but this is a large risk. Traders may like to set stops just below the black channel on the daily chart which would be about 1,240; this seems reasonable. Targets should be the end of intermediate wave (3) at 1,582 for position traders. This advice expects a trend following strategy to hold a position for some weeks. Any long positions entered here must accept the risk that a downwards correction may continue for several days and move price down to the black channel on the daily chart, so positions may be underwater for a few days. Invest no more than 3-5% of equity on any one trade and always use a stop loss.
New updates to this analysis are in bold.
To see last weekly charts click here.
DAILY ELLIOTT WAVE COUNT
Click chart to enlarge.
Intermediate wave (2) is a complete expanded flat correction. It is a shallow 0.350 correction of intermediate wave (1) lasting 56 days, just one more than a Fibonacci 55. There is no Fibonacci ratio between minor waves A and C. Minor wave C is a complete impulse.
I have looked back at the last two big cycle degree up movements within the last bull market: the first move from the low at 255.05 in April 2001, and the next move from the low at 682.75 in October 2008. Within the first move, the beginning series of corrections were 0.76, 0.6 and 0.96 in depth. Within the second move, the beginning series of corrections were 0.82, 0.68, 0.57 and 0.45. My conclusion is this current correction expected to have begun 16th of June is more likely to be deep than shallow, even though intermediate wave (2) was shallow. Early corrections within a new trend are most often deep.
Minor wave 2 may have been a quick, deep 0.57 zigzag over in just six sessions. If minor wave 3 has begun there, then at 1,437 it would reach 1.618 the length of minor wave 1.
Add a base channel (black lines) to intermediate waves (1) and (2). Draw the first trend line from the low at 1,046.27 on 3rd December, 2015, to the low labelled intermediate wave (2), then place a parallel copy on the high of intermediate wave (1). If price comes down to touch the lower edge of this base channel, then long positions should be entered there. If minor wave 2 is not over as per the alternate below, then it may end when price comes down to touch the lower black trend line.
Within minor wave 3, no second wave correction may move beyond the start of its first wave below 1,249.94.
At 1,582 intermediate wave (3) would reach 1.618 the length of intermediate wave (1).
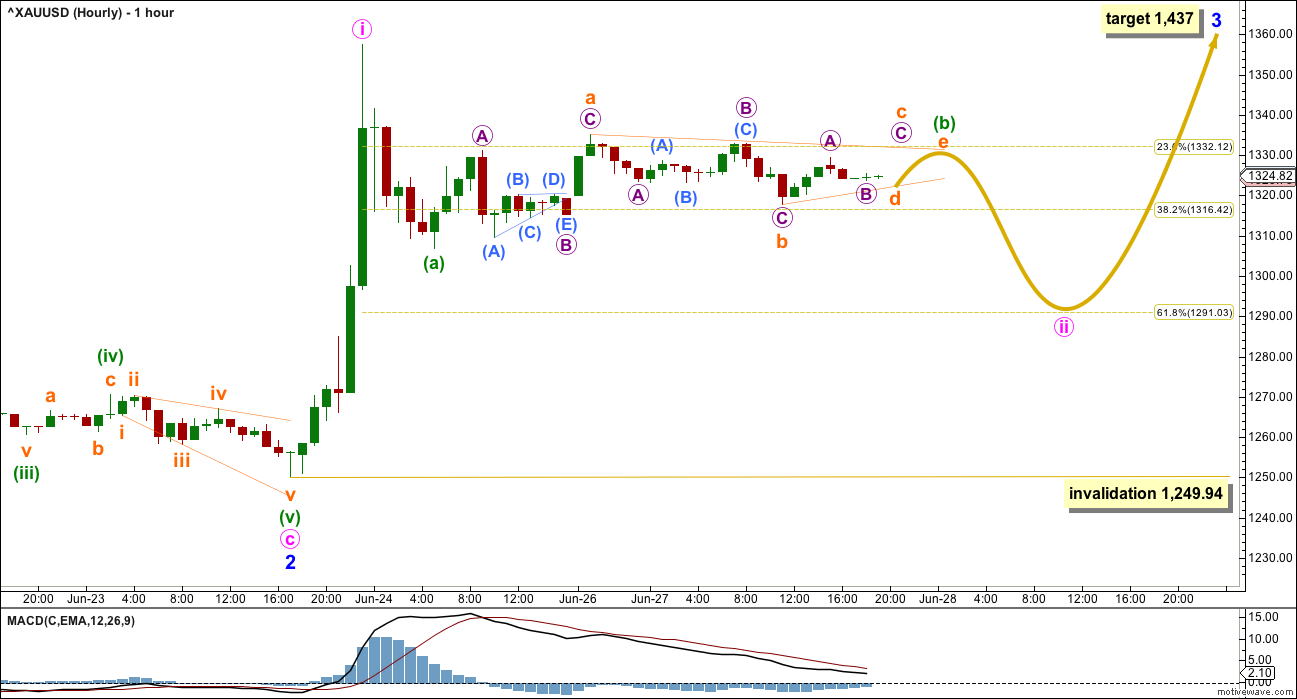
FIRST HOURLY ELLIOTT WAVE COUNT
Click chart to enlarge.
It looks more likely today that minor wave 2 was over at the last low. Within minor wave 3, minute wave i is complete and minute wave ii is incomplete. At its end, minute wave ii should offer a good opportunity to join the upwards trend.
I have two hourly wave counts today which look at minute wave ii in two different ways. This first hourly wave count has a better look. It expects that minute wave ii is a zigzag with minuette wave (b) an incomplete triangle. This wave count expects more sideways movement in an ever decreasing range while the triangle completes. A short sharp downwards thrust for minuette wave (c) may take minute wave ii down to the 0.618 Fibonacci ratio of minute wave i at 1,291.
Minute wave ii may not move beyond the start of minute wave i below 1,249.94.
The triangle for this first hourly wave count would remain valid only while price remains below 1,335.15. Subminuette wave c may not move above the end of subminuette wave a.
If price moves above 1,335.15, then use the second hourly chart below.
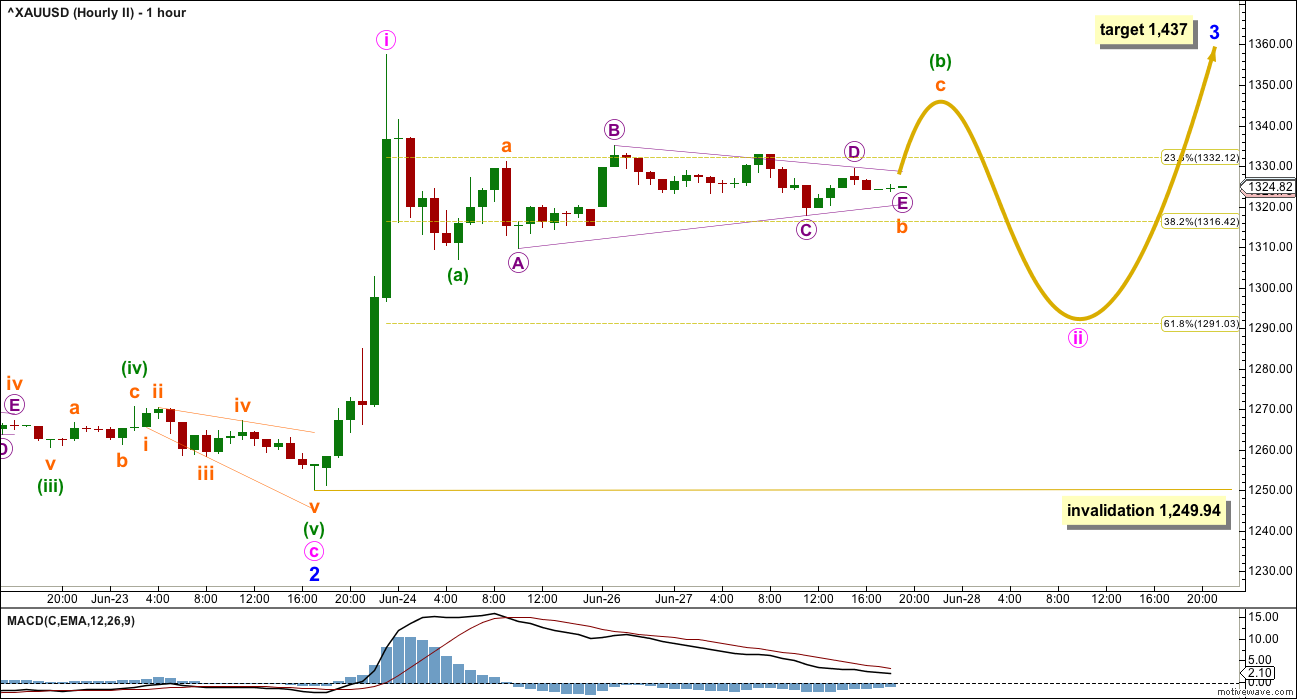
SECOND HOURLY ELLIOTT WAVE COUNT
Click chart to enlarge.
It is essential to consider alternates when a triangle is expected to be unfolding. Too often a triangle is expected only to be invalidated at the last hour, or to turn out to be incorrectly labelled.
What if the triangle is a B wave within a B wave? Then the breakout may be upwards.
Minute wave ii may be a zigzag or it may be a flat correction. Downwards movement for minuette wave (a) will subdivide as either a three or a five, so both possibilities must be considered. This means that minuette wave (b) may make a new high above the start of minuette wave (a) at 1,357.51. A new high does not mean that minute wave ii is over; it would still be more likely that minute wave ii is continuing.
The final target for minute wave ii is still the same, the 0.618 Fibonacci ratio of minute wave i.
Minute wave ii may not move beyond the start of minute wave i below 1,249.94. A new low below this point would see the first two hourly wave counts both invalidated and the alternate below confirmed.
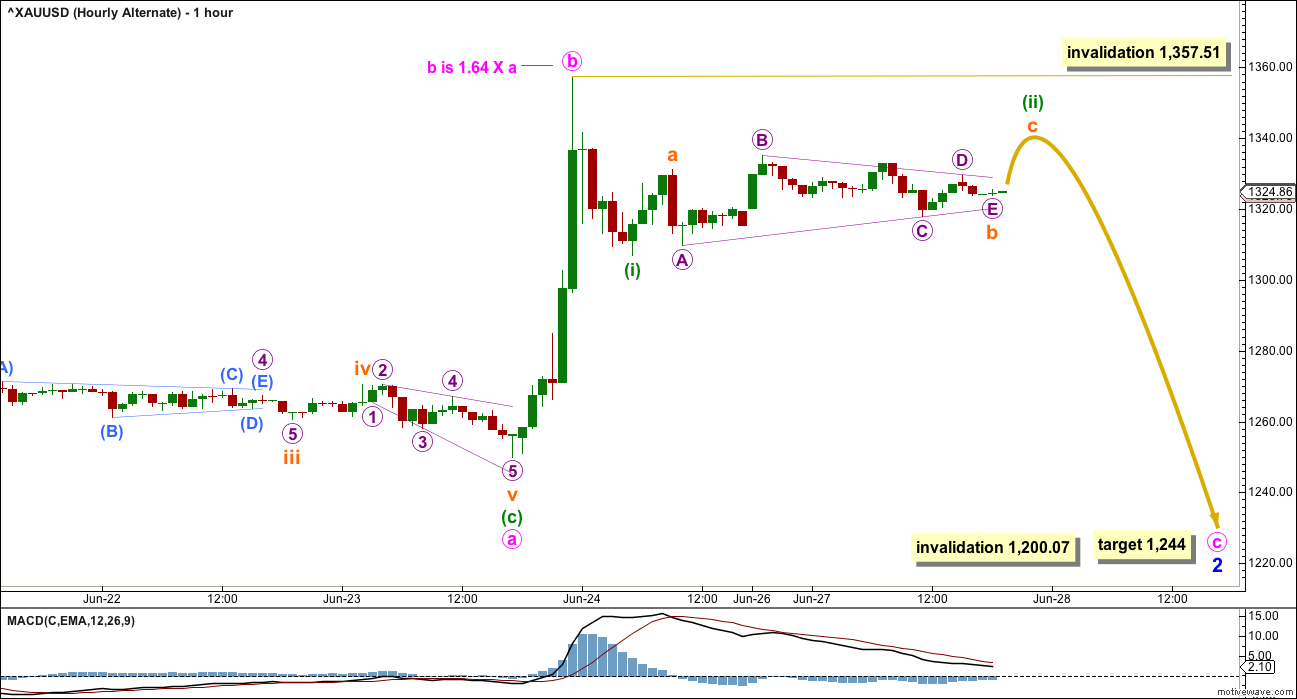
ALTERNATE HOURLY ELLIOTT WAVE COUNT
Click chart to enlarge.
This idea is still entirely possible and this is the risk today to any long positions.
Minor wave 2 may be an incomplete expanded flat correction. Within minor wave 2, minute wave b is a 1.64 correction of minute wave a. This is longer than the common length of a B wave within a flat of up to 1.38, but within the allowable limit of up to 2 times the length of minute wave a.
Minor wave 2, if it continues lower, would most likely end about the 0.618 Fibonacci ratio of minor wave 1 at 1,244. If it is deeper than this, it may end when price comes down to touch the lower edge of the black channel on the daily chart.
The time taken for minuette wave (ii) reduces the probability of this alternate a little, but it does remain valid. Minuette wave (ii) may not move beyond the start of minuette wave (i) above 1,357.51.
This wave count would expect a deeper longer lasting downwards reaction before the upwards trend resumes. It may continue now for another six sessions, so that minor wave 2 completes in a Fibonacci thirteen sessions in total. Downwards movement may end when price touches the lower edge of the black base channel on the daily chart.
TECHNICAL ANALYSIS
DAILY CHART
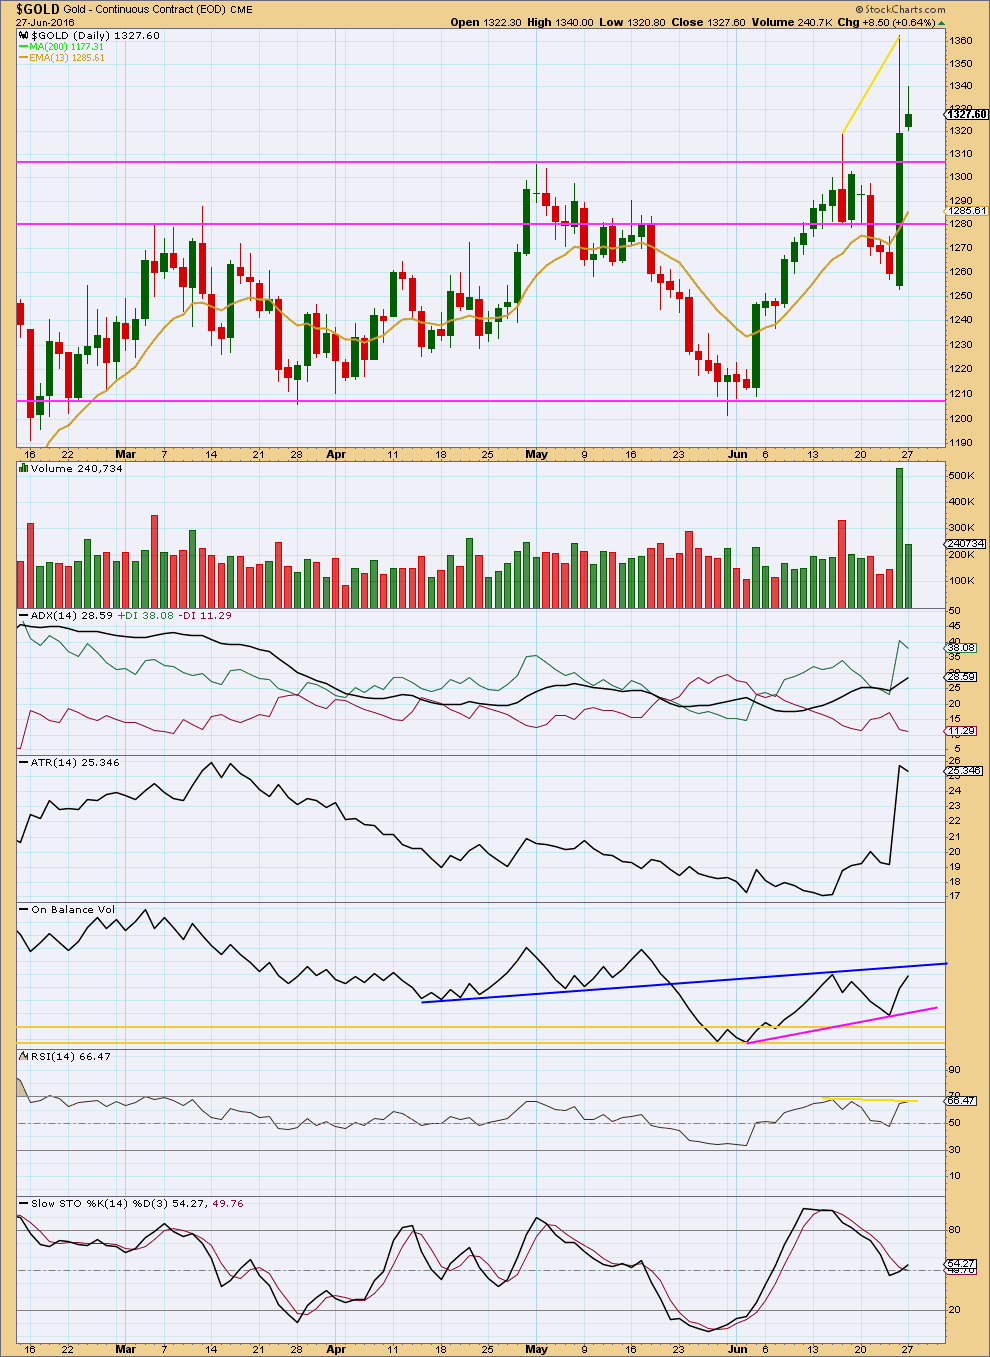
Click chart to enlarge. Chart courtesy of StockCharts.com.
A small inside day on light volume looks corrective and supports the idea of some more downwards movement. One small inside day is probably not enough to resolve the divergence with price and RSI at the last high, so more downwards movement should be expected.
This supports all three hourly Elliott wave counts as all expect some more downwards movement. Unfortunately, it is not clear how low this downwards movement may go.
Price may find support next at the horizontal line about 1,308, and thereafter at 1,280. The next support line would be about 1,208.
ADX is increasing indicating an upwards trend is in place. ATR overall still agrees. Gold is trending and the trend is upwards. Downwards movements should be expected to be corrective and offer an opportunity to join the upwards trend.
Yellow lines are added to the last two highs in price and corresponding points on RSI. Price came with a lower high from RSI while price made a strong new high. This indicates there was weakness to the last rise for price, so a downwards reaction should be expected to follow that weakness. Following divergence with RSI a few days at least would be expected to resolve it.
Stochastics is neutral. There is plenty of room for price to rise or fall.
The 13 day moving average may offer support while price is trending. That would expect price to move down to about 1,295 which fits with the first two hourly wave counts better than the alternate.
This analysis is published @ 08:28 p.m. EST.
I checked a half a dozen technical indicators on Gold from a month down to 15 minutes and overall the longer ones month, week and day at near the upper part of their range and the shorter times are heading down like 195, 78, 39, and 15 minutes.
Perhaps Gold may either stabilize in this price zone longer or drop some more.
The markets crashed Friday and Monday and lost a couple of trillion dollars and today markets bouncing back up. Gold may now be at a new normal so may not be dropping much. I wouldn’t be loading up on gold stock all at once now. Perhaps if one were to invest it may be wise to make multiple buys starting with one now since gold and miners did drop down from their peak at the Friday open.
Thanks Richard. That was pretty much my conclusion too.
I think I’ll open a small long position soon and then scale up with more later on.
Opening a long here risks the position being underwater for a few days and missing a possibly better entry price, but waiting also risks not being positioned for a strong move up.
On balance I think it is better to enter a small position now and put a stop where it will give the market room to move. With the understanding that the position may be underwater for a few days.
Good strategy Lara.
Thomas , on May 1 you posted ,I believe. a picture of a FRACTAL. Could you please tell me what this was? ie was it a fractal of an oil drop or WHAT ? also is it available in color?Thank you ,Stephen C of New London CT.
Updated hourly chart before I sleep. Looking for a long entry on Gold, I have an order to open long at 1,291.
Awesome, thanks for the alert and chart Lara, I’ll be watching for a technical analysis bottoming process to buy in.
Good morning Richard 🙂
Looks like the triangle completed but price hasn’t reached the target….
It could be over now. If this session closes with a red candlestick and light volume then I think I’ll cancel that order and jump in long here…..
I need volume data and RSI data to make a decision, can’t do that until the session has closed.
GLD has that: red candle and light volume.
Very good.
One piece of the puzzle looking good… now for RSI….. I think I’ll have to be looking at these now on the hourly chart.
Lara,
We did get red bullish sort of like a Hammer, low volume. Are you going long here? TIA
Nope, it’s not a hammer. The lower wick has to be minimum 2X the real body, that lower wick is too small.
A small red candlestick on lighter volume…. it could be part of a correction that is going to continue. TBH it just looks too brief and shallow on the daily chart… but then I thought that about minor wave 2 and I was wrong.
Haven’t gone through the process of analysis so I haven’t made a decision yet on what my trading approach will be today. Starting that process in more depth now….
Let me know what you see Richard.
Trying to pick the end of this correction to enter long….. not easy.
I may choose to jump in risking being early, and be prepared to be underwater for a few days.
Lara, just ran across this view from Elliottchart.com. Without dissecting the details, it seems to have a pretty good look. Do you see any possibilities with a count like this (or a variation thereof)? Maybe we just now completed Intermediate 1?
P.S. The big move Friday looks good as a strong 5th wave, no?
It does look like a blowoff top, yes.
And I was thinking that as I presented the analysis…. but those blowoff tops come after a parabolic movement, not just one day but over a while.
They come after a curved movement with a steep slope at the end. That is not what happened here. It went sideways for ages then blew it’s top. Not quite the same.
Lara, thanks for the 3 hourly wave count options and also your detailed technical analysis assessment, together they are a powerful combination as it helps with any surprises.
You’re welcome as always Richard.
I’m looking for an entry long… when I think I’ve found it I’ll post my trade here in comments.
Hopefully soon!