
Price moved lower as expected but did not reach the target.
Summary: A correction may be over at today’s low, or it may continue yet for a few days. The mid term target is at 1,437 and the long term target is at 1,582. Look out for surprises to the upside.
Trading advice: Long positions may be entered now, but it must be understood that they may be underwater for a few days before becoming profitable. Risk and stops may now be set just below 1,249.94. Do not invest more than 3-5% of equity on any one trade. With the risk that price may not have yet bottomed, adjust position size downwards closer to 3% to manage this risk. Waiting for a better entry price risks not being positioned if a surprise to the upside shows up; entering long now risks seeing an underwater position for a few days.
New updates to this analysis are in bold.
To see last weekly charts click here.
DAILY ELLIOTT WAVE COUNT
Click chart to enlarge.
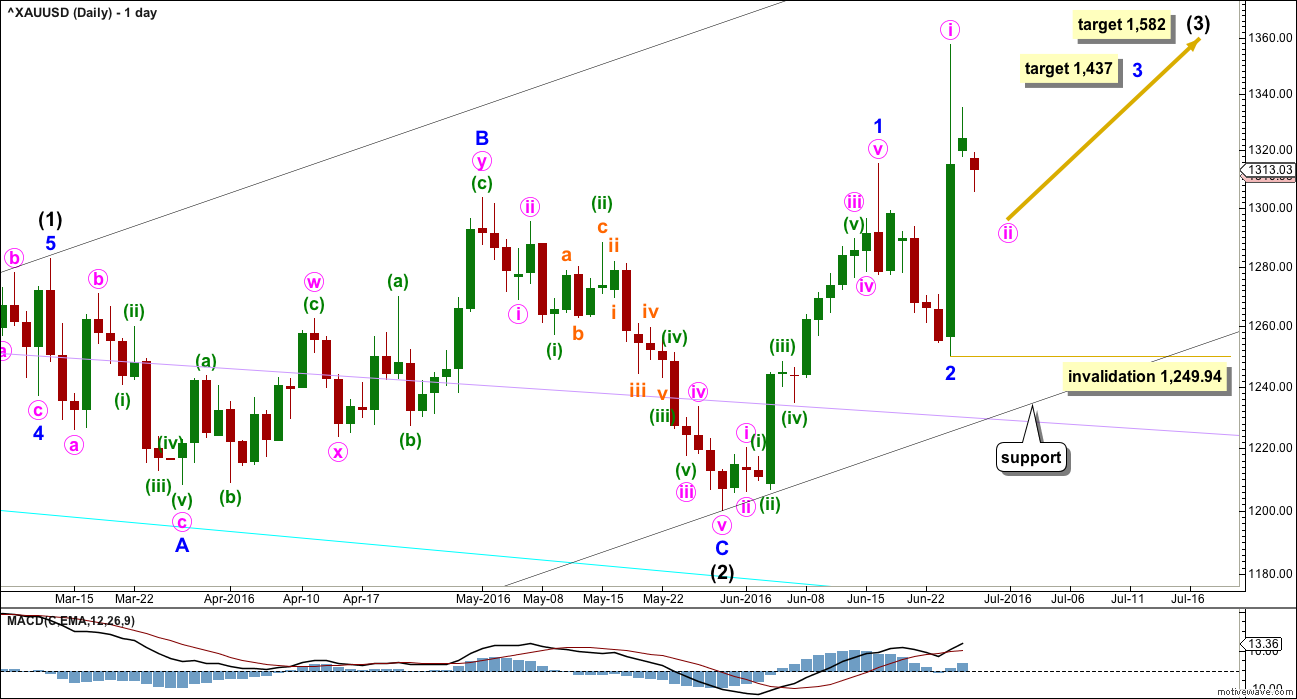
Intermediate wave (2) is a complete expanded flat correction. It is a shallow 0.350 correction of intermediate wave (1) lasting 56 days, just one more than a Fibonacci 55. There is no Fibonacci ratio between minor waves A and C. Minor wave C is a complete impulse.
I have looked back at the last two big cycle degree up movements within the last bull market: the first move from the low at 255.05 in April 2001, and the next move from the low at 682.75 in October 2008. Within the first move, the beginning series of corrections were 0.76, 0.6 and 0.96 in depth. Within the second move, the beginning series of corrections were 0.82, 0.68, 0.57 and 0.45. Early corrections within a new trend are most often deep.
Minor wave 2 may have been a quick, deep 0.57 zigzag over in just six sessions. If minor wave 3 has begun there, then at 1,437 it would reach 1.618 the length of minor wave 1.
Add a base channel (black lines) to intermediate waves (1) and (2). Draw the first trend line from the low at 1,046.27 on 3rd December, 2015, to the low labelled intermediate wave (2), then place a parallel copy on the high of intermediate wave (1). Along the way up, downwards corrections should find support at the lower edge of the base channel, if they get that low. At this stage, it looks like corrections are shallow and may not reach back down to the base channel.
Minute wave ii may not move beyond the start of minute wave i below 1,249.94.
At 1,582 intermediate wave (3) would reach 1.618 the length of intermediate wave (1).
Yesterday’s analysis had an alternate wave count which looked at the possibility that minor wave 2 may not be over and may continue lower as an expanded flat correction. This is still possible, but the probability today is judged to be too low for publication. It will be followed and published again if it shows itself to be correct.
MAIN HOURLY ELLIOTT WAVE COUNT
Click chart to enlarge.
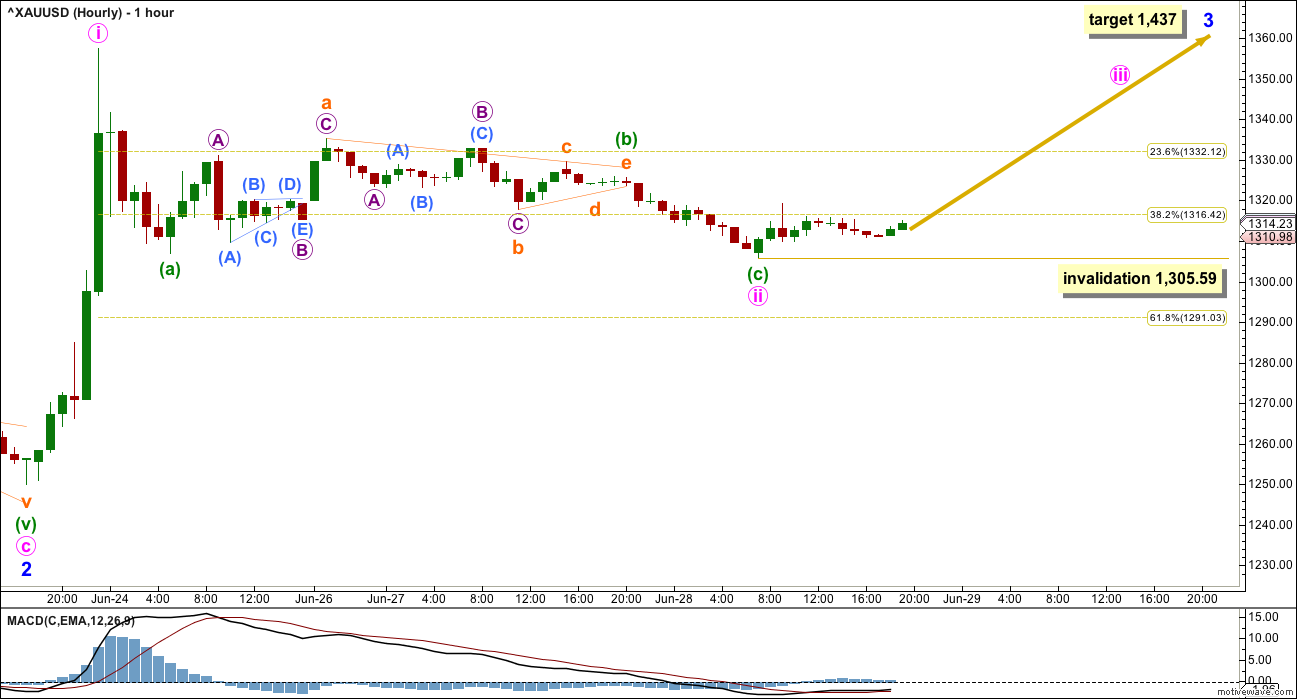
The main wave count today sees minute wave ii over as a complete zigzag ending just below the 0.382 Fibonacci ratio as a relatively shallow 0.48 correction.
If this is correct, then a third wave up at three degrees may begin now. The target for minor wave 3 remains the same. At 1,437 minor wave 3 would reach 1.618 the length of minor wave 1.
If minute wave ii was very quick as labelled, then minute wave iv may be quicker still. A target is not given for minute wave iii because the following correction for minute wave iv may be too quick to show up on the daily chart.
Within minute wave iii, no second wave correction may move beyond the start of its first wave below 1,305.59.
When minor wave 3 is complete, then the invalidation point will move up to the high of minor wave 1 at 1,315.35. The following correction for minor wave 4 may not move back into minor wave 1 price territory.
ALTERNATE HOURLY ELLIOTT WAVE COUNT
Click chart to enlarge.
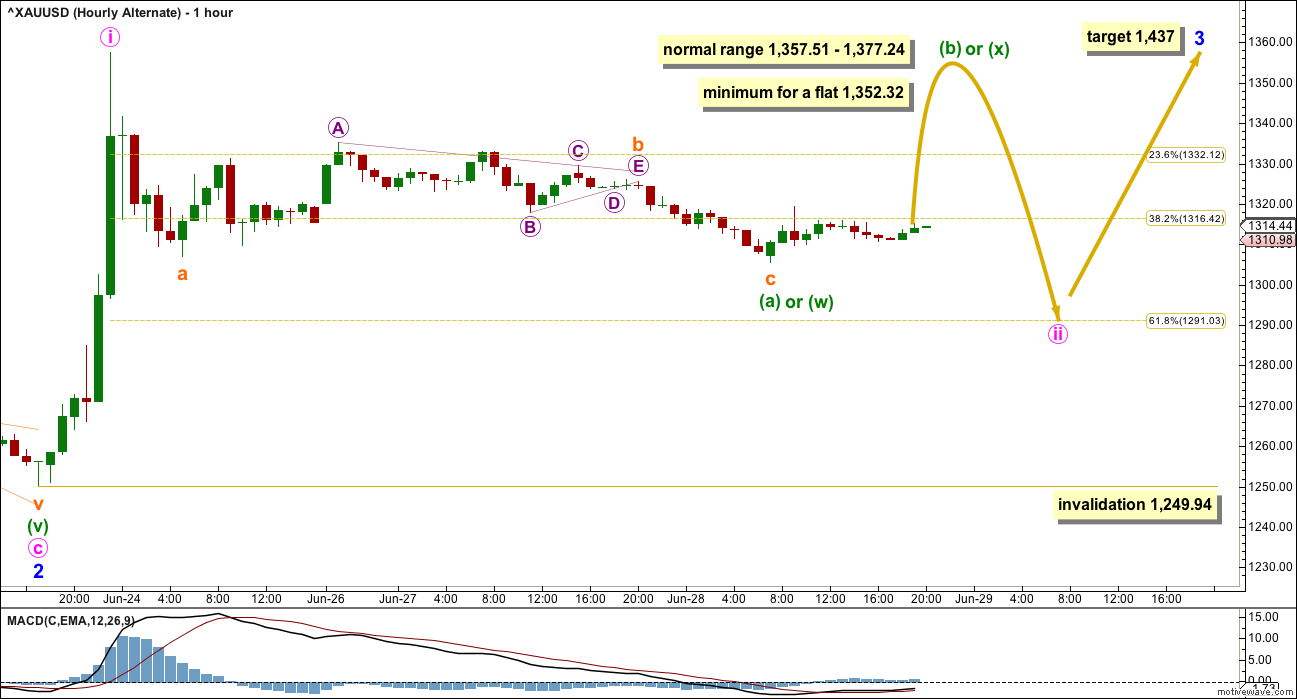
By moving the degree of labelling down one degree, it is possible that minute wave ii is incomplete.
If minute wave ii is unfolding as a flat correction, then within it minuette wave (b) must retrace a minimum 0.9 length of minuette wave (a) at 1,352.32. If minute wave ii is a flat correction, then the normal range for minuette wave (b) would be between 1 to 1.38 the length of minuette wave (a) at 1,357.51 to 1,377.24. A new high may be part of minute wave ii as in an expanded flat correction.
If minute wave ii is unfolding as a combination, then there is no minimum nor maximum for minuette wave (x). The first structure in a double combination may be a completed zigzag for minuette wave (w). The double may be joined by a three in the opposite direction which may make a new high above the start of minuette wave (w) at 1,357.51 and should be deep. The second structure in the double may be a flat or triangle.
If minute wave ii is unfolding as a double zigzag, then minute wave (x) within it should be relatively shallow. Minuette wave (y) should move price lower to deepen the correction, most likely to end about the 0.618 Fibonacci ratio at 1,291. In the short term, a new low below 1,305.59 would indicate a double zigzag would be most likely. At that stage, the target would be 1,291.
Minute wave ii may not move beyond the start of minute wave i below 1,249.94. This wave count still has a reasonable probability, and represents the risk to any long positions entered here.
TECHNICAL ANALYSIS
DAILY CHART
Click chart to enlarge. Chart courtesy of StockCharts.com.
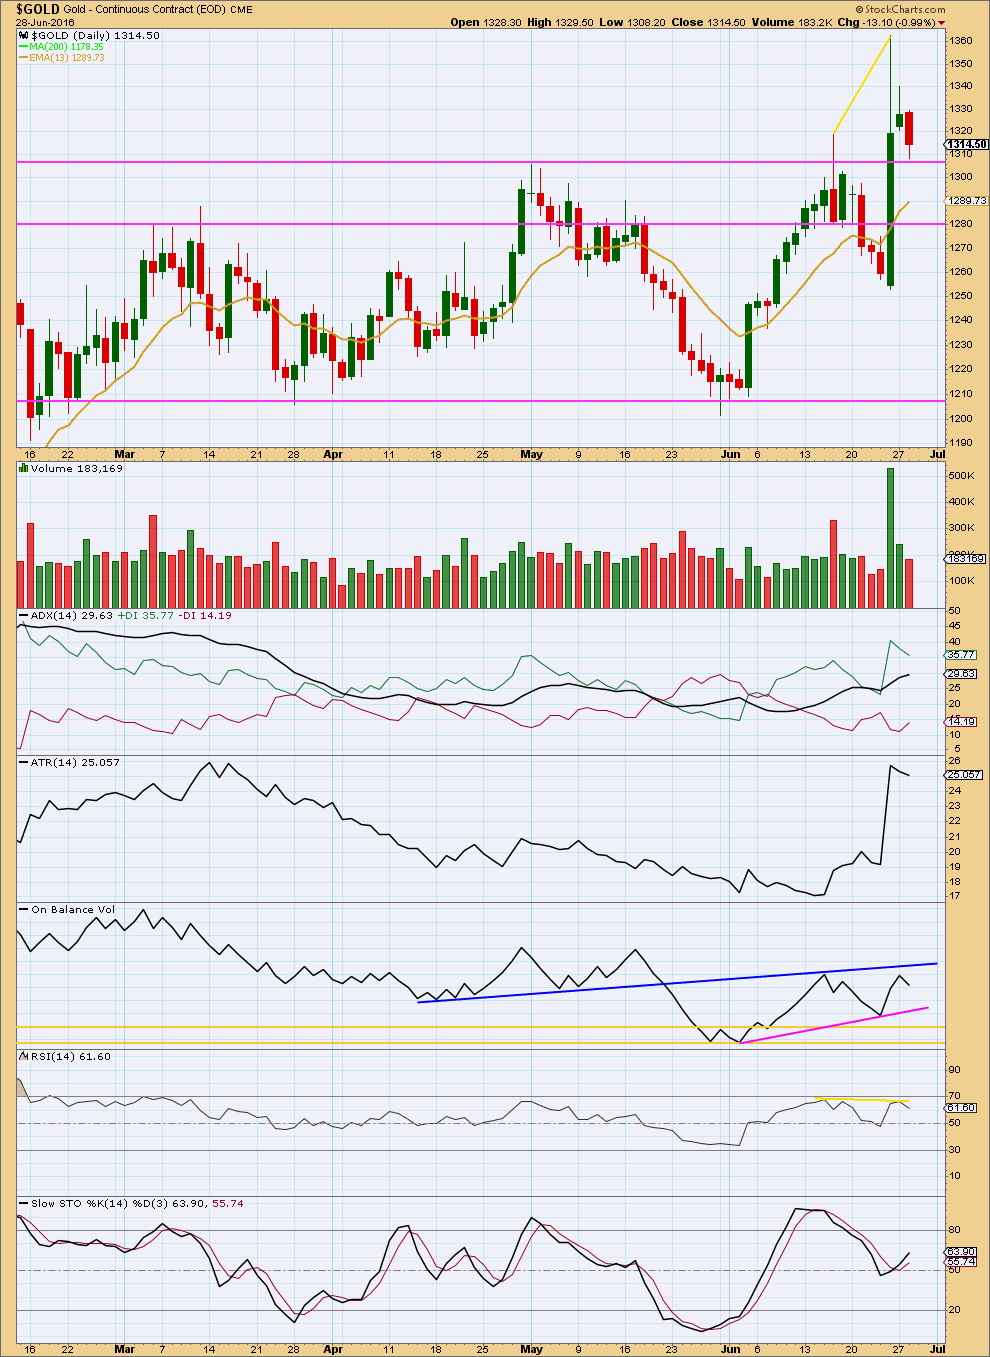
A downwards day on lighter volume looks very corrective. It does look clear at this stage that Gold is in an upwards trend, the only question is where exactly corrections against the trend may end. Price today is finding support about 1,308 which has previously provided resistance. The strong upwards day of 24th of June looks like an upwards breakout from a consolidation zone, and the two days afterwards look like a throwback to find support. This looks like a good set up to go long here.
It is entirely possible though that price could break back below the support line about 1,308, which is why risk to any long positions entered here must be carefully managed. What looks more likely at this stage is the line about 1,308 should hold.
ADX and ATR still agree. This market is trending and the trend is up. ATR remains high although it declined a little more today. This small decline looks like a small consolidation within a trend, not the end of a trend.
On Balance Volume is constrained within the blue and pink trend lines. A break above the blue line would be a bullish indicator. A break below the pink line would be a bearish indicator. The pink line is some distance away. There is room for price to fall a reasonable amount.
Two days of overall downwards movement from the high of Friday may be enough to resolve the divergence at the last high between price and RSI.
This analysis is published @ 09:10 p.m. EST.
Volume data is now available from StockCharts for the session and most concerning is it is low for an upwards session. That in conjunction with a problem of structure for this upwards movement on the hourly chart means it is my judgement that price will move lower short term.
The hourly wave counts will be swapped over. I expect now more downwards movement to complete minute ii before the upwards trend resumes.
This is still a counter trend movement. The problem is figuring out when and where it will end.
Long positions opened yesterday, if still held, may be underwater for a few days.
The trend is up. This is a counter trend movement.
I can’t see this upwards movement as a five yet. There is too much overlapping.
It looks like the hourly alternate has a reasonable probability today. If volume for that small up day was light then I may swap the main and alternate over.
Lara,
In August GOLD futures low of 1308.20 to high of 1331 can be seen as a
leading contracting diagonal of five waves for a (i) with a iv/i overlap ?
Are both hourly counts looking to go higher? TIA
No, they diverge.
The main wave count expects upward movement to increase in momentum now.
The alternate expects more downwards movement to a deeper correction first.
The conundrum is essentially the same as presented in this analysis. The trend is up, but how deep will this counter trend movement be first?
On Alternate hourly chart above, you have (b) or (x) showing higher first towards 1355-1372, than a (c) down? As noted by orange inverted U curves. thx.
Yes, but if it’s X then it’s over now.
Perhaps the 10:41 am high of 1,327.89 with a parabolic spike of $8 in the final 5 minutes, may of been a 5th wave after all?
Lara as usual will do her best to clarify everything under the Golden Sun :o)
Then with our new charts in hand we can set sail tomorrow over the gold and miners waves of sentiment and cast out our nets for a bountiful catch.
Was that a 5th wave that peaked at 1,327.89 at 10:41 am and than a 1st wave down to 1,321.58 11:10 and maybe just finished a 2nd wave down at 11:59 with a possible .618 retrace target of 1,314.08.
Or was 1,327.89 just the top of a 3rd wave and a 4th wave finished down at 11:10 am at 1,321.58 and heading up much higher now in a 5th wave?
Likely…5th of Minuette (i) of Minute iii
“Or was 1,327.89 just the top of a 3rd wave and a 4th wave finished down at 11:10 am at 1,321.58 and heading up much higher now in a 5th wave?”
Likely now may be a good time to buy Bullish before another hourly channel starts up and keeps moving up without breaking out for a correction.
Like the $100 rally up June 3rd to June 16th in an hourly channel.
A strong Miners rally leaves many chasing it if they wait for a correction.
Beware the Gold hourly channel that keeps going up.
Although not required to buy it all now.
I agree. I’ve opened a small long at 1,320.65, stop at 1,247, risking 3% of equity.
If price moves lower I’ll risk another 2%.
Target 1,582.
Lets see how that one works out.
Lara it appears you had good timing to take a position in gold.
Strangely gold and oil and the markets went up today basically all markets, commodities and currencies up except for natural gas, corn and the US dollar down a little.
I did make a profitable trade in NUGT today.