
Sideways movement was expected. A red candlestick with a small real body fits expectations for the session.
Summary: Another one to two days of sideways movement is expected at this stage, followed by a short sharp thrust lower to support at 1,190 or the target at 1,183. That should complete the first large correction within the new bull market.
New updates to this analysis are in bold.
To see last weekly charts click here.
DAILY ELLIOTT WAVE COUNT
Click chart to enlarge.
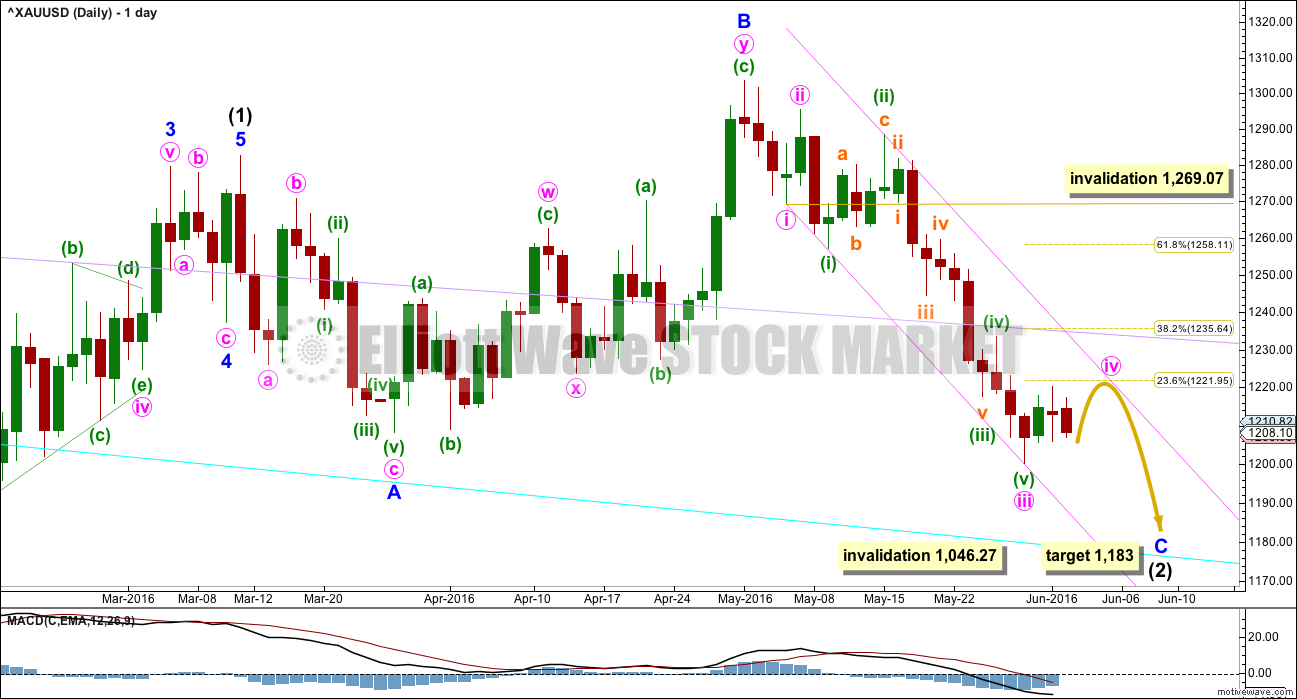
Intermediate wave (2) is not over.
Normally, the first large second wave correction within a new trend is very deep, often deeper than the 0.618 Fibonacci ratio.
Intermediate wave (2) may be an expanded flat correction. Minor wave A is a three, minor wave B is a three and a 1.28 length of minor wave A. This is within the normal range of 1 to 1.38.
At 1,183 minor wave C would reach 1.618 the length of minor wave A. This would be the most likely target. If price keeps falling through this first target, then the second target would be at 1,108 where minor wave C would reach 2.618 the length of minor wave A. When minute wave iv within minor wave C is complete, then the target may be calculated at two wave degrees. At that stage, the target may widen to a small zone or it may change.
Intermediate wave (2) may not move beyond the start of intermediate wave (1) below 1,046.27.
There are two structural options for minor wave C: either an impulse or an ending diagonal. Minor wave C does not look at this stage like an ending diagonal. It looks like the more common impulse.
Minute wave iv has begun and so far shows up on the daily chart with three candlesticks. The structure on the hourly chart still looks incomplete today.
Minute wave iv may not move into minute wave i price territory above 1,269.07.
Draw a channel about minor wave C as shown in pink: the first trend line from the ends of minute waves i to iii, then a parallel copy on the high labelled minuette wave (ii) so that all downwards movement is contained.
Minute wave iv may find resistance at the upper edge of the pink channel. It may also find resistance at the lilac trend line copied over from the weekly chart, if it gets that high.
For this main wave count, minute wave iii is 5.05 short of 2.618 the length of minute wave i.
There are no adequate Fibonacci ratios between minuette waves (i), (iii), and (v) within minute wave iii.
Ratios within minuette wave (iii) are: there is no Fibonacci ratio between subminuette waves i and iii, and subminuette wave v is 2.64 short of 2.618 the length of subminuette wave i. Subminuette wave ii is an expanded flat and subminuette wave iv is a zigzag.
HOURLY ELLIOTT WAVE COUNT
Click chart to enlarge.
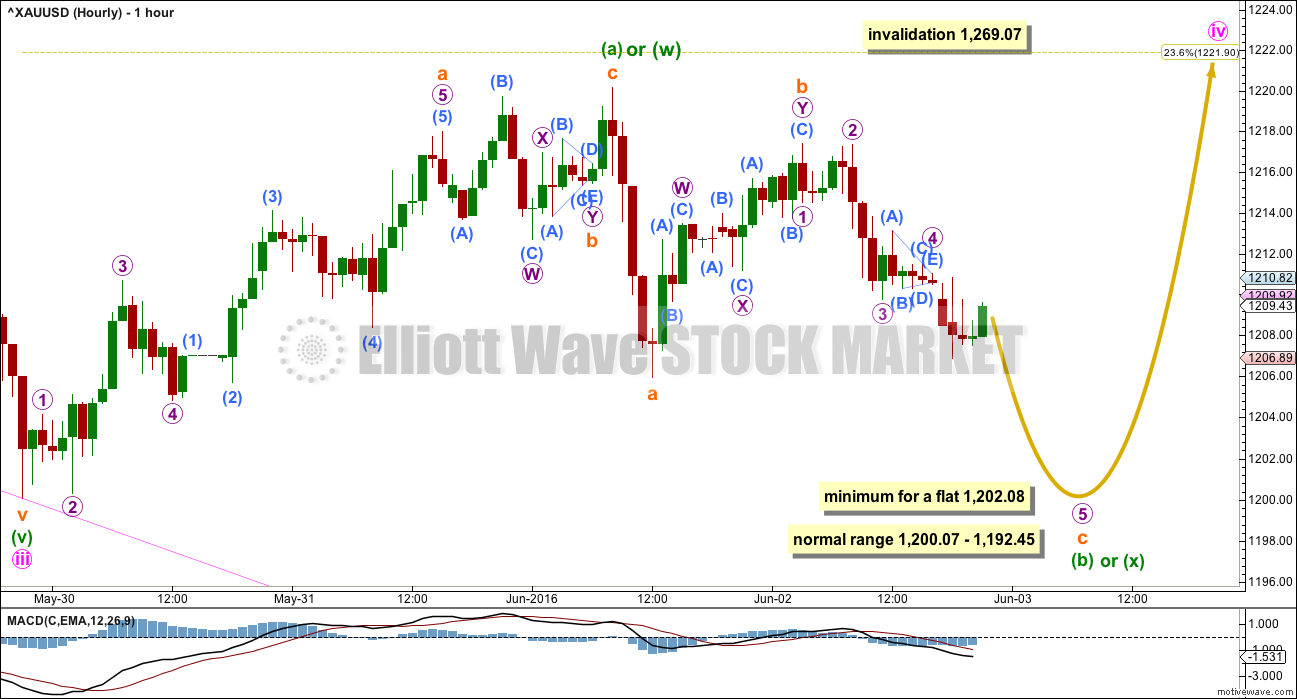
Minute wave ii was a quick deep 0.76 zigzag lasting 23 hours. Given the guideline of alternation, minute wave iv is most likely to be a shallow sideways structure and may be more time consuming than 23 hours. Minute wave iv is most likely to be a flat, combination or triangle. It is most likely to end about either the 0.236 or 0.382 Fibonacci ratios, so targets at 1,222 and 1,236 are reasonable.
If minute wave iv unfolds as an expanded flat (which is a very common structure), running triangle or combination, then it may include a new low below its start at 1,200.07. A new low below this point in the next one or two sessions does not mean minute wave iv is over; it would more likely be a part of minute wave iv.
At this stage, there are still multiple structural possibilities for minute wave iv. Alternate wave counts and flexibility while this correction unfolds will be essential. It is impossible to tell with certainty which structure will unfold, so it is impossible for me to give you an accurate road map for how price will move during this correction. Small corrections do not present good trading opportunities; they should be avoided. They present an opportunity to join the trend at their completion, so analysis over the next few days will focus on identifying if minute wave iv could be complete and what price points will confirm its completion.
So far a zigzag upwards may be complete. This is most likely minuette wave (a) of a flat or triangle, or minuette wave (w) of a double combination.
If minute wave iv is a flat correction, then the minimum requirement for minuette wave (b) is to retrace 0.9 the length of minuette wave (a) at 1,202.08. If price reaches down to this point, then the minimum requirement will be met; the rule that minuette wave (b) must be at least 0.9 the length of minuette wave (a) will be met. This is not the same as the normal range for minuette wave (b).
If minute wave iv is a flat correction, then the normal length of minuette wave (b) is 1 to 1.38 the length of minuette wave (a). This gives a normal range of 1,200.07 to 1,192.45.
If minute wave iv is a triangle, there is no minimum nor maximum for minuette wave (b); it must only be a three wave structure. It may make a new low below the start of minuette wave (a) at 1,200.07 as in a running triangle.
If minute wave iv is a double combination, then the first structure in the double may be a complete zigzag. Minuette wave (x) has no minimum nor maximum requirement; it must only be a corrective structure and would most likely be deep.
So far within minuette wave (b) or (x) the structure looks like it is most likely unfolding as a zigzag. Subminuette wave c has not yet moved below the end of subminuette wave a at 1,205.97, but it is most likely to do so to avoid a truncation.
As soon as a truncation is avoided, whether or not the minimum for a flat at 1,202.08 is met, then downwards movement for subminuette wave (b) or (x) may be complete.
Overall, more choppy overlapping sideways movement is expected for another two days most likely. That would see minute wave iv total a Fibonacci five sessions.
It is still impossible to tell which structure minute wave iv is unfolding as. It may still be either a flat, triangle or combination. This means it is still impossible to tell with any accuracy the pathway price will take over the next couple of days.
Just this one hourly wave count will be published today. There are alternate possibilities but they hardly diverge in expectations from this idea. At this stage, the most important point to note is minute wave iv does not yet look to be complete.
ALTERNATE DAILY ELLIOTT WAVE COUNT
Click chart to enlarge.
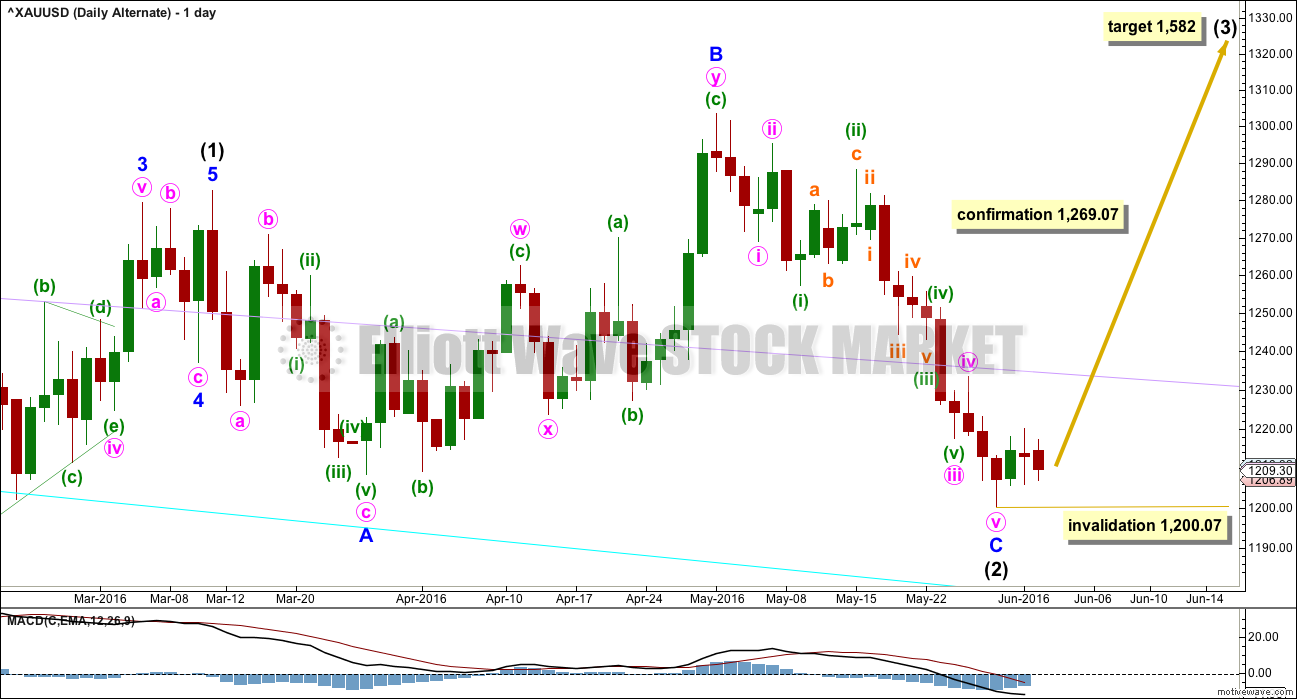
It is possible that intermediate wave (2) is over as a completed expanded flat. It would be a shallow 0.350 correction of intermediate wave (1) lasting 56 days, just one more than a Fibonacci 55. There would be no Fibonacci ratio between minor waves A and C.
For this alternate wave count, ratios within minor wave C are: there is no Fibonacci ratio between minute waves i and iii, and minute wave v is just 1.13 short of equality in length with minute wave i.
Within minute wave iii, there are no adequate Fibonacci ratios between minuette waves (i), (iii) and (v).
Ratios within minuette wave (iii) are: there is no Fibonacci ratio between subminuette waves i and iii, and subminuette wave v is 0.70 short of 0.618 the length of subminuett wave i. Subminuette wave ii is an expanded flat and subminuette wave iv is a regular contracting triangle.
On balance, there is no advantage for either wave count, this alternate or the main, in terms of Fibonacci ratios or alternation which would indicate one is more likely than the other.
What is problematic for this alternate is the structure of minuette wave (v): the fit on the hourly chart is not as neat for this alternate as it is for the main wave count. For this reason, in terms of Elliott wave, this alternate must be judged to have a lower probability. It requires confirmation with a new high above 1,269.07 before it may be used.
At 1,582 intermediate wave (3) would reach 1.618 the length of intermediate wave (1). No second wave correction may move beyond the start of its first wave below 1,200.07 within intermediate wave (3).
TECHNICAL ANALYSIS
WEEKLY CHART
Click chart to enlarge. Chart courtesy of StockCharts.com.
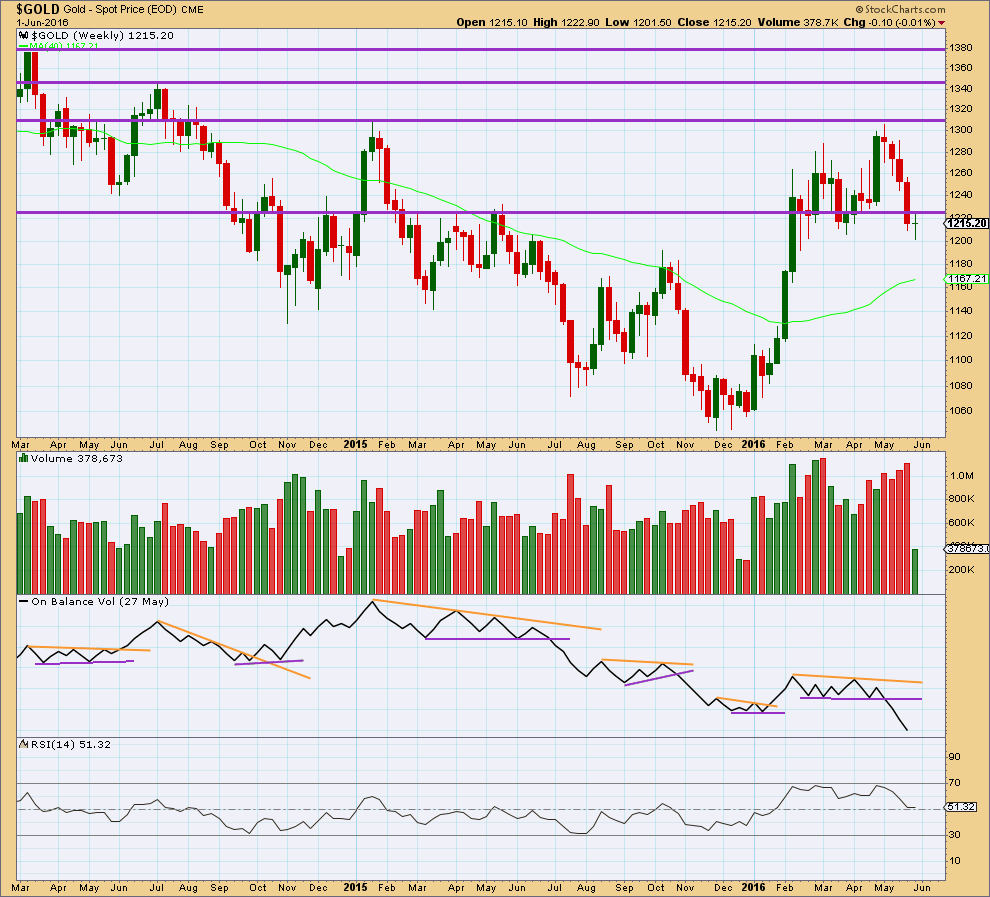
On Balance Volume is breaking below a reasonably long held and clearly defined consolidation zone. It would be entirely reasonable to expect price to follow by continuing lower for a few weeks. This piece of evidence strongly supports the Elliott wave count.
Price has broken below and closed below support about 1,225. Price has fallen on increasing volume for four weeks in a row. This supports a downwards trend.
RSI is neutral. There is plenty of room for price to fall.
DAILY CHART
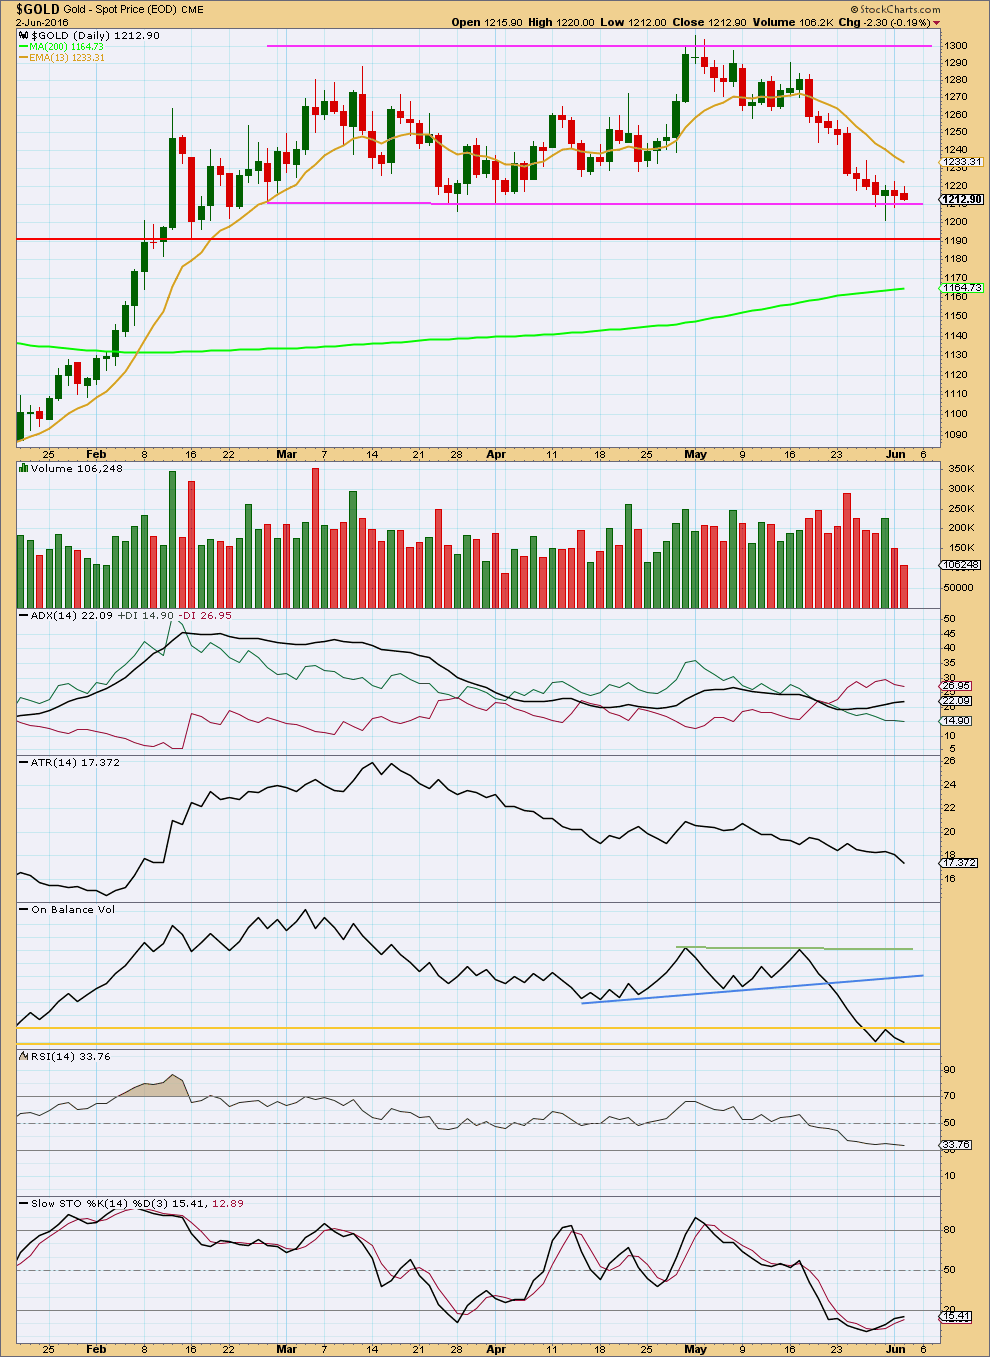
Click chart to enlarge. Chart courtesy of StockCharts.com.
Price is finding support at the lower pink trend line about 1,210. Volume for the last two sessions declines as price moves sideways, typical of a consolidation. During this small sideways movement, the strongest day is an upwards day which indicates an upwards breakout may be more likely than downwards. This favours the alternate daily wave count over the main daily wave count still.
ADX still indicates a downwards trend is in place. ATR still disagrees. ATR has consistently declined as price has been moving lower since the high of 2nd of May. Normally, ATR increases during a trending market. The decline of ATR indicates that this downwards movement is more likely to be a counter trend movement which supports the Elliott wave counts, which see it as the end of an intermediate degree correction.
Trend lines about the current movement for On Balance Volume can now be tentatively drawn. The two gold lines are horizontal. A break above would be bullish. A break below would be bearish. These would provide weak signals only though as the lines are not much tested.
There does not look to be any divergence still between price and RSI to indicate any weakness. RSI has not reached oversold. There is still room for price to fall further.
Stochastics is returning from oversold.
This analysis is published @ 10:55 p.m. EST.
Lara,
Somone had sent this Wave count, seems very feasible, any thoughts?
Thanks
GDX – 170 Million shares traded Friday,
the most-active stock traded on U.S. exchanges.
GDX had it’s best day is 7 1/2 years since November 2008.
If intermediate (2) is over then we have a first wave up unfolding. I would label that at this early stage minute wave i.
Within minute wave i the fourth wave correction of minuette (iv) may not move into first wave price territory below 1,220.16.
So now we have a range we need to see Gold break out of to have clarity between the two wave counts.
A break above 1,269.07 would confirm the next bull run. Then we would look for a correction against the trend to enter long.
A break below 1,220.16 would confirm the correction of intermediate (2) isn’t over, we would look for the downwards movement to end and find a long entry there.
That’s the plan folks.
For the main wave count which sees intermediate (2) incomplete:
There is now a problem. Minute iv is a zigzag, same structure as minute ii. It also is now outside the channel which contains minor C down. Sometimes fourth waves do that (which is why Elliott had a second technique to redraw the channel) but IME when they do probability is reduced.
For the main wave count minute iv should now be complete, minute v down should begin about here.
The invalidation point is going to remain at 1,269.07; minuette (c) of minute iv could extend higher. The higher it goes the lower the probability this count is correct.
I’ve just checked some longer SMA/EMA MACD time frames for gold and it may have already bottomed at 1,200.07
Yes, I’m thinking that may be the case, hence the alternate.
Gold has impulses which just don’t always look right at higher time frames, they end quickly with quick shallow fourth waves giving the impulse the wrong look because you can see the second waves, but not the fourth waves.
That tendency has caught me out before. Maybe it’s doing it again….
Volume is higher for today, strongly so. If that remains after StockCharts finalise their data (6:30pm EST) that will support the alternate count over the main.
After I’ve gone through the process I go through to do the analysis… I may decide to swap those two over today. We shall see.
Lara, Any chance of an hourly chart before the 4:00 pm EST close today , please?
Lara is it likely gold may retrace back down a lot over the weekend and back down by the Monday open in case any are inclined to buy a little DUST before close today due to the 30% loss in DUST today?
Or does this wave up today look strong enough to keep rising into next week?
Working on it right now Richard. Give me five minutes.
Excellent much appreciated thanks Lara.
Gold miner stocks blast off after weak jobs data
June 3, 2016 2:10 p.m. ET
Miners ETF on track for best gain since September 2007 as gold futures jump after weak jobs data
http://www.marketwatch.com/story/gold-miner-stocks-blast-off-after-weak-jobs-data-2016-06-03
NUGT action is so red hot today on todays $30 gold spike that NUGT price is now at $94.70 with gold at 1240 at 1:25 pm. the last time NUGT was at about $95 gold was about $25 higher around $1,265. NUGT closed cheap Thursday at $74.94 and now up over 26% and appears to be overpriced. What a difference one US news release can make.
Hard to believe that news doesn’t effect gold price.
The bullish sentiment on gold sure turned on a dime at 8:30 am, switching fast from bearish expecting under $1,200 to no rate hike so the gold bullish fever is on a gold rush up and miners demand is through the roof. I sure hope the miners discount shopping isn’t over already.
Either the main daily wave count is still valid and minute wave iv may of completed today at the 10:05 am high of $1,243.28
OR else
Perhaps the shockingly terrible US jobs report at 8:30 am that moved gold up $30 has shifted things to favour the alternate daily wave count and intermediate wave (2) has already bottomed at the May 30th low of $1,200.07 due to the strong support at the psychologically important $1,200 strong support area.
Maybe the Fed verified the classic technical analysis indicates a low may be in place.
I am curious why Alan yesterday mentioned this price point as a possible target,
“price could rise to test 1243.17 resistance levels.”
Gold did reach $1,243.28 high today at 10:05 am.
Gold definitely moved up a lot today. Gold up $30 GDX up 8% NUGT up 25 and DUST down 25%.
I was on the fence so no loss, now just looking for the next trade.
Now what happens how much is the next move and in which direction?
Retrace down before moving up to test the $1,269.07 confirmation of the alternate daily count?
Now that gold has been in bull trend it will follow credible EW counts to the point. Today’s action sort of proves the point.
Yes, Now what?? Wave v down or continue up thinking that int wave 2 is complete.
I do not have any way to determine by gold’s action.
Let wait for Lara to provide a report on this??????
Hi Richard. 1243.17 is a very strong resistance point. I followed my prediction and made a respectable profit from buying NUGT yesterday at the 1206 low; 75 to 93+.
From what I can see now, for the main count, Minute 4 has completed, and it just takes a fifth down to complete the down move.
Alternatively, for the alternate count, minuette 3 completed at 1243.28, and it is now the fourth wave. The slow steady consolidation favours a fourth wave. Fifth waves should not begin with this sort of behaviour.
From my analysis based on price and resistance/support levels, I would say that the next step is a drop, and where the drop terminates will decide which of the two counts is correct. 1205/1206 level is a strong support area. If price dropped and that level holds again, then the alternate is correct; the expected bullish trend will continue. If price falls below 1205/1206, it will open the way to 1198 followed by a final target of 1172 before resuming the bullish trend. I guess this cannot be resolved by today, probably early next week. So I’m off to bed. Enjoy your weekend.
Here is Alan Tham’s comment from Thursday where he mentioned if 1206 – 1205 held then trade could be buy NUGT and mentioned 1243.17 resistance level?
Since then gold low was 1,206.97 at 6:35 pm Thursday and gold high at 9:22 am today at 1241.17.
“Alan Tham June 2, 2016 at 12:21 pm
Agree with your first part. Subminuette b / x ended at 1217.78.
Subminuette c / y has to be 5 waves. I counted 1209.88 as the third wave. Target should be around 1206-1205. Which begs the question: does this end Minuette B or is Minuette B continuing as a combination?
The 1205-1206 region is very important. If breached to the downside, it opens up the floodgate to 1183 or lower.
If respected, price could rise to test 1243.17 resistance levels. In that eventuality, first resistance could be the intraday EMA 50 at 1224.65. I am tempted to do a scalp if 1205-1206 holds.”
Reply
U.S. jobs growth in May was slowest in more than five years 8:30 am Friday US news dropped US dollar pushed up gold
http://www.marketwatch.com/story/us-gains-just-38000-new-jobs-in-may-2016-06-03
HOURLY ELLIOTT WAVE COUNT
“… Minute wave iv is most likely to be a flat, combination or triangle. It is most likely to end about either the 0.236 or 0.382 Fibonacci ratios, so targets at 1,222 and 1,236 are reasonable.”
Alternate daily???
Alternate daily would only confirmed if goes above 1269.07.
Gold just slammed higher up to 1236 on weak US jobs data.
Wow, gold popped this morning on the jobs report; $1,237 at 8:50 ET. Just wondering if you have some thoughts on wave counts and if the 5th wave downward is still in effect within the next day or two per the analysis?
Worlds largest retailer bringing back the smiley face. A social mood sign suggesting a stock market top?
http://money.cnn.com/2016/06/02/news/companies/walmart-smiley/
Lara, your analysis is excellent. Truly awesome in so many ways.
A job very well done, thank you.