
Downwards movement was expected for the main hourly Elliott wave count, but this is not what happened. However, price remains below the invalidation point, so all three hourly wave counts remain valid.
Summary: It still looks more likely today that a correction will move price lower to 1,291 – 1,289. However, with a big third wave up approaching, look out for surprises to the upside. Any traders holding long positions which are profitable are advised to hold onto them. Also, understand there is a risk that any long positions entered here may be underwater for a few days. Risk is at 1,249.94. The trend is up, so downwards movement is a counter trend movement.
New updates to this analysis are in bold.
To see last weekly charts click here.
DAILY ELLIOTT WAVE COUNT
Click chart to enlarge.
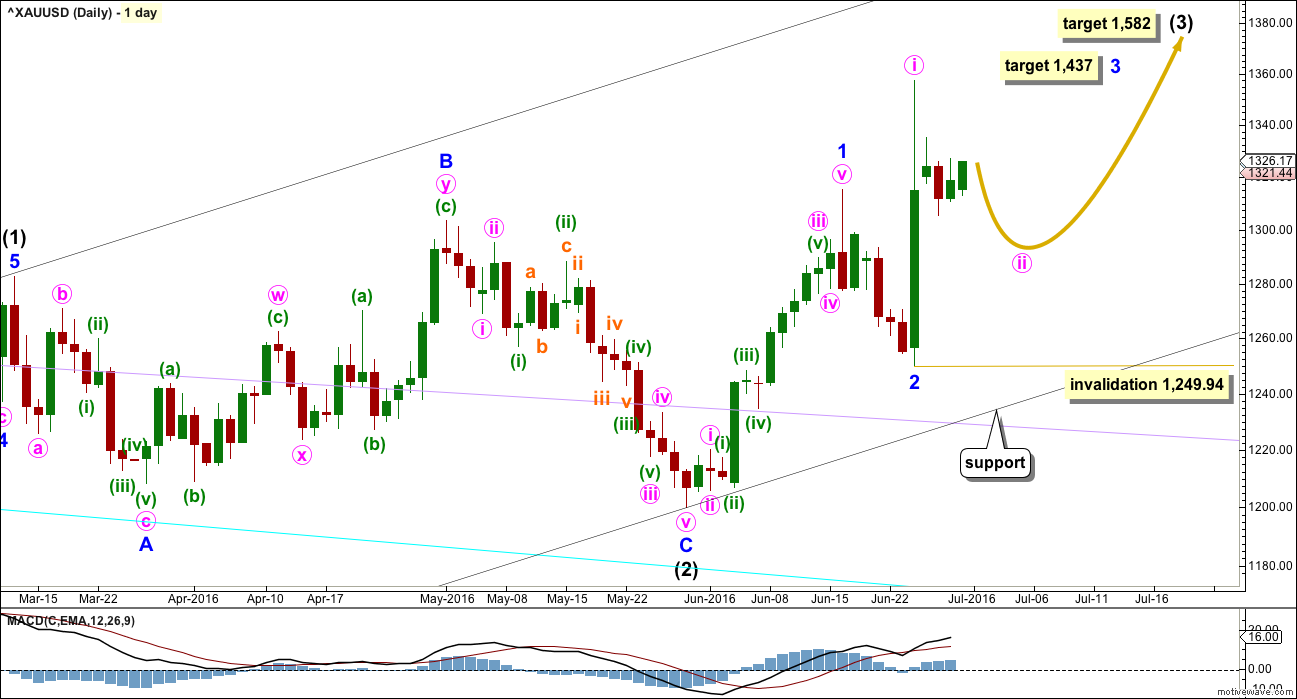
Intermediate wave (2) is a complete expanded flat correction. It is a shallow 0.350 correction of intermediate wave (1) lasting 56 days, just one more than a Fibonacci 55. There is no Fibonacci ratio between minor waves A and C. Minor wave C is a complete impulse.
I have looked back at the last two big cycle degree up movements within the last bull market: the first move from the low at 255.05 in April 2001, and the next move from the low at 682.75 in October 2008. Within the first move, the beginning series of corrections were 0.76, 0.6 and 0.96 in depth. Within the second move, the beginning series of corrections were 0.82, 0.68, 0.57 and 0.45. Early corrections within a new trend are most often deep.
Minor wave 2 may have been a quick, deep 0.57 zigzag over in just six sessions. If minor wave 3 has begun there, then at 1,437 it would reach 1.618 the length of minor wave 1.
Add a base channel (black lines) to intermediate waves (1) and (2). Draw the first trend line from the low at 1,046.27 on 3rd December, 2015, to the low labelled intermediate wave (2), then place a parallel copy on the high of intermediate wave (1). Along the way up, downwards corrections should find support at the lower edge of the base channel, if they get that low. At this stage, it looks like corrections are shallow and may not reach back down to the base channel.
Minute wave ii may not move beyond the start of minute wave i below 1,249.94.
At 1,582 intermediate wave (3) would reach 1.618 the length of intermediate wave (1).
Prior analysis had an alternate wave count which looked at the possibility that minor wave 2 may not be over and may continue lower as an expanded flat correction. This is still possible, but the probability today is judged to be too low for publication. It will be followed and published again if it shows itself to be correct.
MAIN HOURLY ELLIOTT WAVE COUNT
Click chart to enlarge.
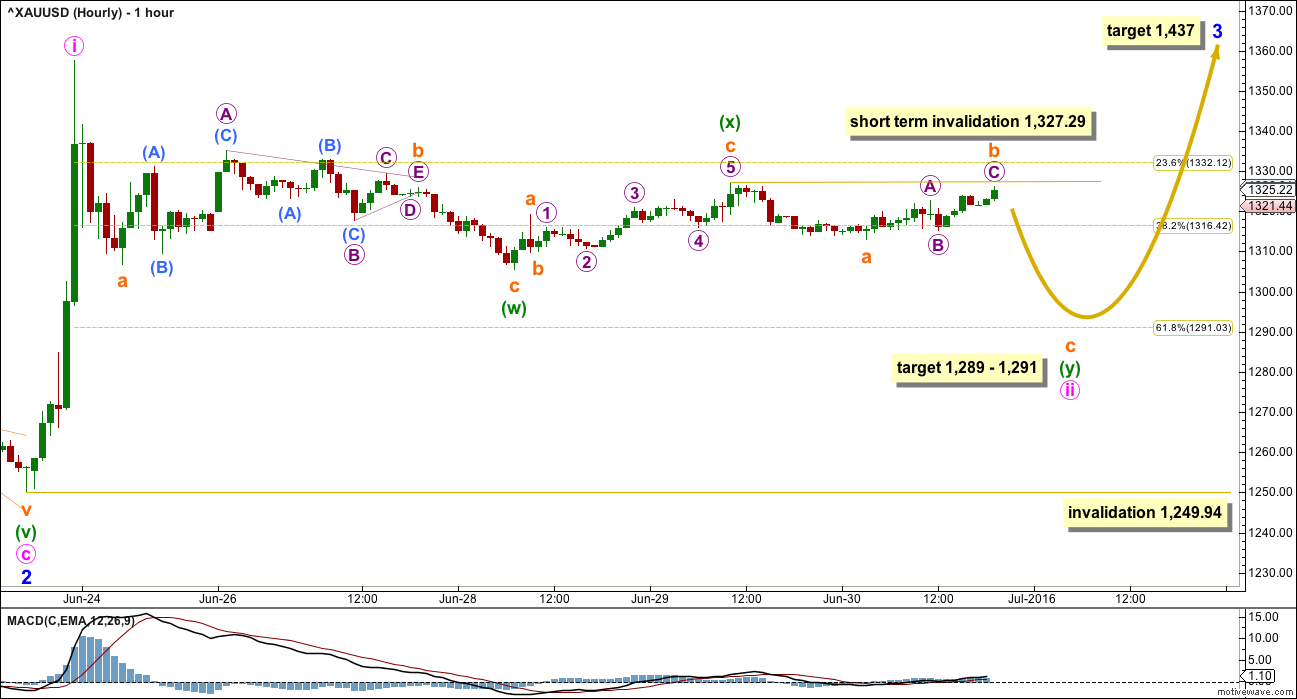
At this stage, this wave count still looks most likely of the three presented today. Minute wave ii may be an incomplete double zigzag. The first zigzag in the double was shallow, labelled minuette wave (w). The double is now joined by a three in the opposite direction, a zigzag labelled minuette wave (x) which is relatively shallow.
A second zigzag in the double may take price down to about the 0.618 Fibonacci ratio of minute wave i at 1,291.
When the second zigzag of subminuette wave b is over as labelled, then at 1,289 subminuette wave c would reach 2.618 the length of subminuette wave a. This gives a $2 target zone with a reasonable probability.
Minute wave ii so far has lasted four days. If it continues for one more, it may complete in a total Fibonacci five days and would be a more typically deep second wave correction.
The structure of upwards movement labelled minuette wave (x) fits best as a single zigzag. This slightly increases the probability of this wave count today and is one reason for swapping the wave counts over.
Within minuette wave (y), as a zigzag, no second wave (nor B wave) may move beyond its start above 1,327.29.
ALTERNATE HOURLY ELLIOTT WAVE COUNT
Click chart to enlarge.
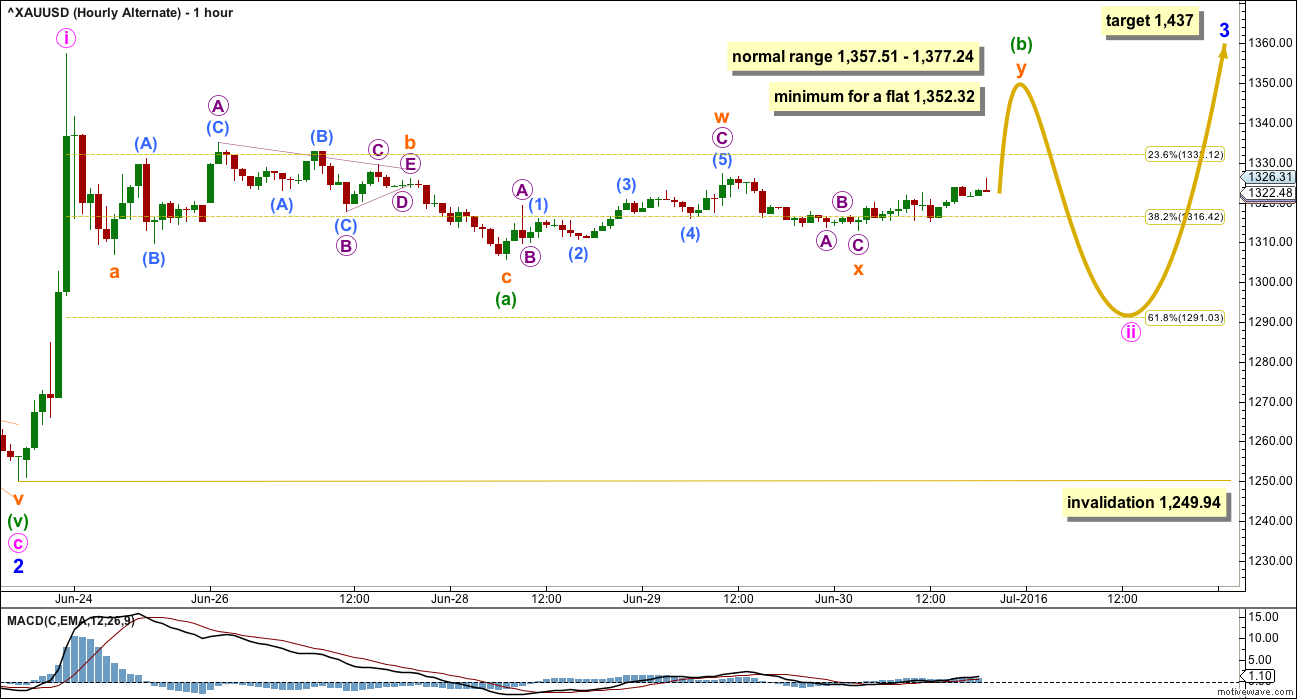
Minute wave ii may still be unfolding as a flat correction.
If minute wave ii is unfolding as a flat correction, then within it minuette wave (a) is a completed three, a zigzag. Minuette wave (b) must subdivide as a three and must be a minimum 0.9 length of minuette wave (a) at 1,352.32.
Minuette wave (b) may be unfolding as a double zigzag.
The normal range for minuette wave (b) within a flat is 1 to 1.38 the length of minuette wave (a) giving a range of 1,357.51 to 1,377.24. A new high above 1,357.51 may still be part of minute wave ii as in an expanded flat, which are very common structures.
If a new high is seen, then careful attention to volume and RSI will indicate the probability of this wave count vs. the second alternate hourly wave count.
SECOND ALTERNATE HOURLY WAVE COUNT
Click chart to enlarge.
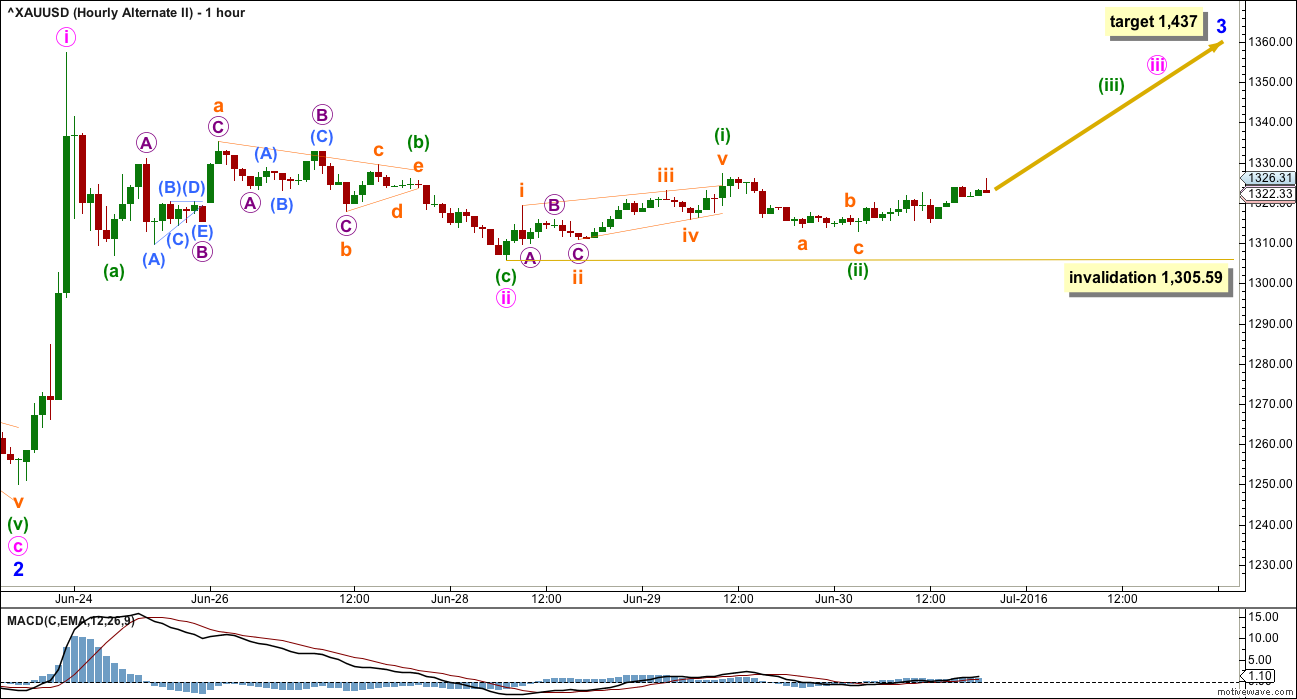
This wave count today sees minute wave ii over as a complete zigzag ending just below the 0.382 Fibonacci ratio as a relatively shallow 0.48 correction.
If this is correct, then a third wave up may be underway. The target for minor wave 3 remains the same. At 1,437 minor wave 3 would reach 1.618 the length of minor wave 1.
If minute wave ii was very quick as labelled, then minute wave iv may be quicker still. A target is not given for minute wave iii because the following correction for minute wave iv may be too quick to show up on the daily chart.
Within minute wave iii, no second wave correction may move beyond the start of its first wave below 1,305.59.
I am concerned with the subdivisions of minuette wave (i) as a leading contracting diagonal. This structure meets all Elliott wave rules, but for it to fit micro wave C within subminuette wave ii is truncated. This reduces the probability of this wave count to an alternate (along with a concern about volume).
At this stage, volume is light and the range is low although price is moving higher. At this stage, price behaviour does not look typical of a third wave, although they can begin stealthily.
This wave count today illustrates the risk to not having a long position at this time. It is possible that price may move surprisingly fast up to new highs as a big third wave gets underway. It is up to each member to manage risk and make your own judgements on how to approach this market at this time.
When minor wave 3 is complete, then the invalidation point will move up to the high of minor wave 1 at 1,315.35. The following correction for minor wave 4 may not move back into minor wave 1 price territory.
TECHNICAL ANALYSIS
DAILY CHART
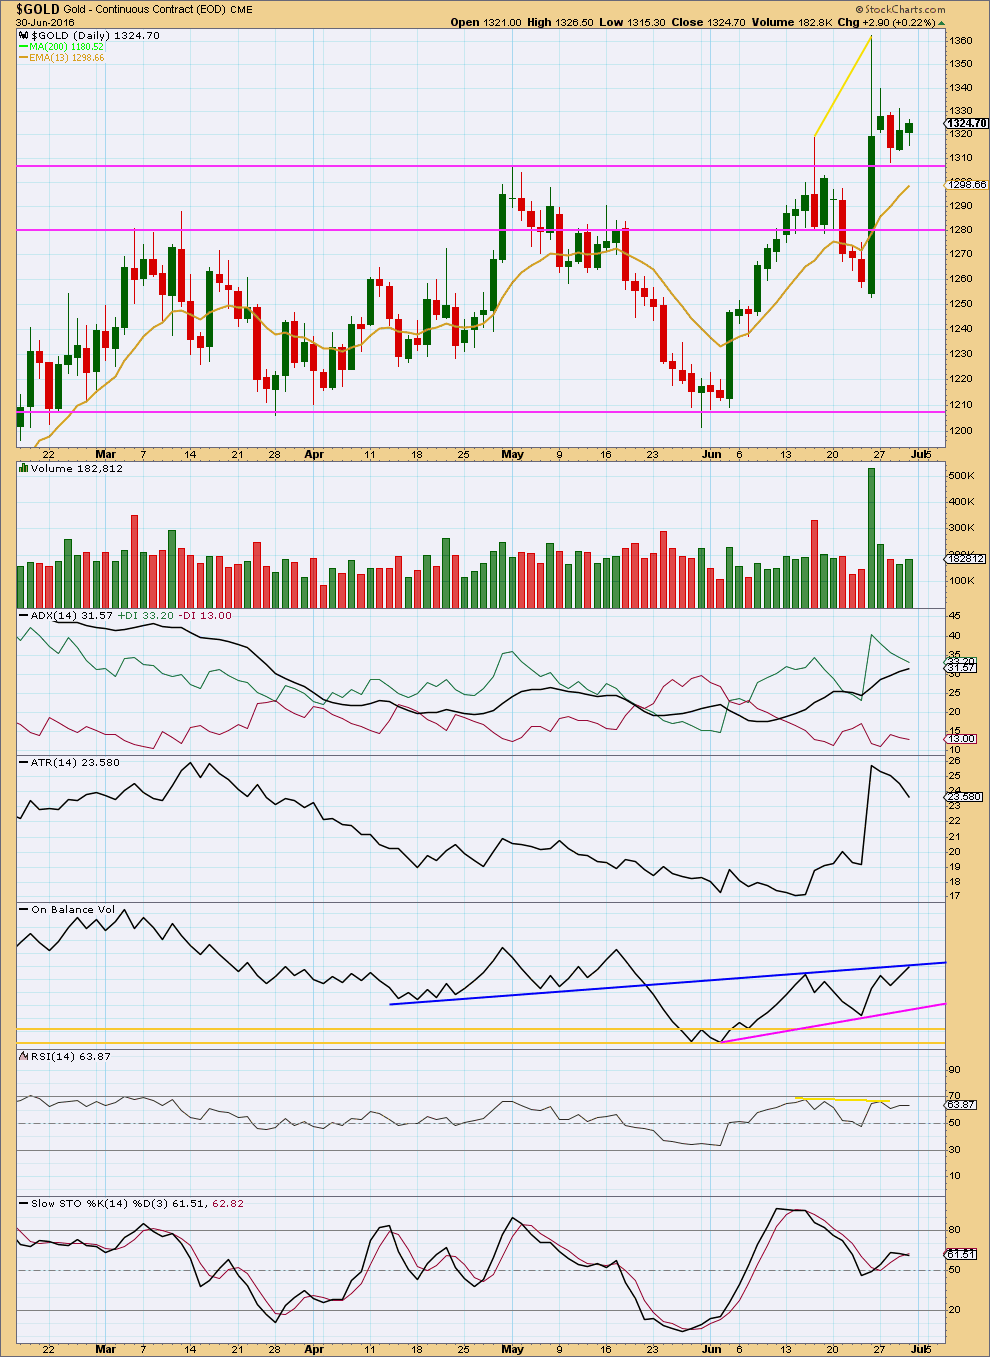
Click chart to enlarge. Chart courtesy of StockCharts.com.
There was some small increase in volume for the small upwards day of Thursday, but volume remains relatively light.
The strong upwards day of 24th of June still looks like a classic breakout from a consolidation zone, and it is strongly supported by volume. Price broke above the horizontal trend line at 1,308 and then turned down to find support. Price may be coming back down to this area for a second test. On throwbacks price usually ends at a support / resistance line but not always. Price may move below 1,308 to back into the consolidation zone before the correction is over.
ADX remains clear. There is a trend and it is up. ATR today is clearer; it disagrees with ADX as it is declining. It looks like there is most likely an upwards trend and the last four days are a smaller counter trend movement.
If this market is trending as ADX suggests, then price may find support about the 13 day moving average. This is now at 1,298 which closely fits with the target for the Elliott wave count and the Fibonacci ratio of the last wave upwards.
On Balance Volume has come up to test the dark blue line. This line has reasonable technical significance as it is reasonably long held, relatively shallow and repeatedly tested. If the main hourly wave count is correct, then this trend line on OBV may serve to halt the rise in price here. A break above the dark blue line would be a reasonably strong bullish indicator from OBV. If OBV turns down from here, then it should find support at the pink trend line.
The lower limit for OBV is the lower yellow line. That should provide support, particularly if the larger picture for the Elliott wave count is correct and Gold is in an upwards trend.
RSI is not extreme. There is room for price to rise or fall. RSI and price showed bearish divergence (yellow lines) at the last high. Four days may or may not be enough to resolve that divergence, but it should be resolved soon.
Stochastics is relatively close to neutral. There is room for price to rise or fall.
This analysis is published @ 08:26 p.m. EST.
A fairly nice up day for Gold. Only two wave counts now. I’ve opened a long position in case this is the start of a big third wave up. I will consider moving my stop up to breakeven to eliminate risk when it looks nicely positive. Then see how that goes.
So this is either a slow start (relatively) to a big third wave up, or its wave B of a flat correction. It could be either TBH. I’ll let volume help decide which is more likely.
If todays up day has support from volume then I’d say it’s more likely a third wave.
If when price makes a new high there is any weakness from volume, divergence from oscillators and particularly RSI then I’d say it’s a B wave. If not, then a third wave.
For now, it would pay to be positioned in case its a third wave.
Thanks Lara. Two requests, can you take a look at GDX for atleast chart updates? And could you please post us new weekly charts for gold? Thank much for your diligence.
If you were in US — well I’ll still say it, Happy 4th of July!!
May you too have a very happy holiday weekend 🙂
I have had some horrible pain in my neck from too much computer use this week, and I need to rest it if I’m to keep going. (4th July offers a small rest)
So I’ll update the weekly chart for Gold and see what I can do about GDX, but no promises there.
I have to push back a little on the requests for my health.
I SO understand (and sorry to hear it – didn’t know). My neck injuries affect computer use even decades later. TG for chiropractic early on and the advent of computer voice command input. Life changes things. Winners know how to adapt! And when to ride a winning trade. 🙂 We are winners.
FWIW: After gold made a double bottom and FINAL bottom , of the last down wave (or Cycle) in 2015, I went long selected gold stocks in February 2016. I am still holding and have held all the following since then ( I am a position trader ,NOT A DAY TRADER. ) They are Kinross ,KGC at $2.00 now $5.2 (looking for $22.00), Golden Star Resources at $0.21 cents, now $0.67 cents (looking for $3.50), Coeur De Alene Mines,CDE at $2.50,now $11.00 (looking for $32.00) NUGT (exchange traded fund long gold( triple ) at $52.00 now $138.00, Yamana Gold, AUY, at $2.20,now $5.40 (looking for mid $20,s) El Dorado Gold,EGO at $2.10, now $4.60; New Gold ,NG at $4.10,now $6.46; CEF (Canadian Exchange Fund) at $10.8, now $14.175; Fuel Cell Energy,FCEL at $4.75, now $6.42 (an energy company); EDIT Editas Medicine (gene technology) long term breakthrough in erasing,cancer,heart disease etc.,bought in Feb as new stock offering at $18.5,now $25.4. Silver Trust ,symbol,USLV, at $12.00, now $25.4, and now short the Standard and poor 500 through purchase of SPXS and short crude oil through purchase of SCO. THIS IS NOT A RECOMMENDATION, there is risk of loss in any stock investment. Sincerely, and happy fourth of July (240th) to everyone!!! NEW LONDON ROCKS! Stephen C. New London CT.
Good for you Stephen, in your prosperous trades!!,!
Do you have a time expectation for the targets mentioned in the gold mines?
thank you.
U may also try this site for miners to get 10 to 100 baggers juniors .
U did well.
https://spockm.com/
https://goldtadise.com/?p=368457
Thank you Stephen for sharing this. It gives me encouragement for my future. Congrats on your positioning, and Happy 4th to you too — and everyone!
Gold, silver futures jump to kick of July trading – July 1, 2016 8:57 a.m. ET
http://www.marketwatch.com/story/gold-silver-futures-soar-as-global-growth-worries-persist-2016-07-01
Silver has risen spectacularly.
Yes it has . Having been in the silver mining business ,I bought CDE at a little over $2.50 some time age (looking for a move to at least $30 . It is now over $10 per share . Stephen of New London CT.
Peter Brandt is one of the most successful pattern traders ever. Audited 40%+ returns a year for 30 years. His gold target is 1430 with this breakout which matches Lara’s wave 3 target. POG has an opportunity to close strong today which would verify the breakout.
Cup and handle pattern could align with the alternate flat idea. Chart by Tradingoffthecharts
US bond market is ripping higher overnight. The big move up looks close at hand. Will be watching out for expanded flat scenario just in case though.
It does not appear that the miners are going to give us a low entry point. Looks like the iH&S will play out.
Monday NYSE closed US Independence Day July 4
https://www.nyse.com/markets/hours-calendars
Lara,
You Second hourly ALT. is in play, GCQ August future hit a high of 1332.50, cash is about -$2.6, also it matches Silver, has been in Minute [iii]. It did correct 48% in four days, can not see it correct for more as Minor 2 took just 5 days .
First ALT. will make it too long for more than 7-10 days up and down?
Main count got invalidated.
Also Intermediate (2) only corrected 35% as you mentioned.
Excellent thorough analysis, thank you.
Main hourly invalidated
Yes. The probability of price continuing higher from here has increased. I’ve opened a long.
Lara , thank you ,belatedly for adding a K to the other stephen,s name. Also I know you have made the right move in going long gold here. You did caution that positions could be opened at 1271 (before we dropped to 1253) . I was long at 1210 back in March but held on through the final wave down in June and added to my positions at 1310 (on equity build up) Now pyramiding on the houses money. Sometimes you just have to have the courage of your convictions and bite the bullet. As you may have guessed ,I am not in the gold and silver INVESTING business (NOT A GAME) for peanuts. Keep up the good work ! Stephen Charles MacLeod Payer, of New London CT.(Home of the Brave!)
Stephen – Miners this year is a huge profit event for the longs such as you, congratulations.
You’re welcome. Stephen K was happy with that too 🙂
Very nicely done on your stock purchases and long trades. Very nice indeed.