
The main Elliott wave count yesterday expected more upwards movement to a target at 1,255 or 1,267.
So far price has moved higher as expected reaching 1,263.97.
Summary: The main wave count has a higher probability. It expects an upwards wave to end about 1,267. Thereafter, a second wave correction may begin which may last about one or two weeks. The alternate requires downwards movement from here, but today it has further reduced in probability because it no longer has the right look.
New updates to this analysis are in bold.
To see last weekly charts click here.
MAIN DAILY ELLIOTT WAVE COUNT
Click chart to enlarge.
Volume analysis favours this wave count, which is now more likely than the alternate.
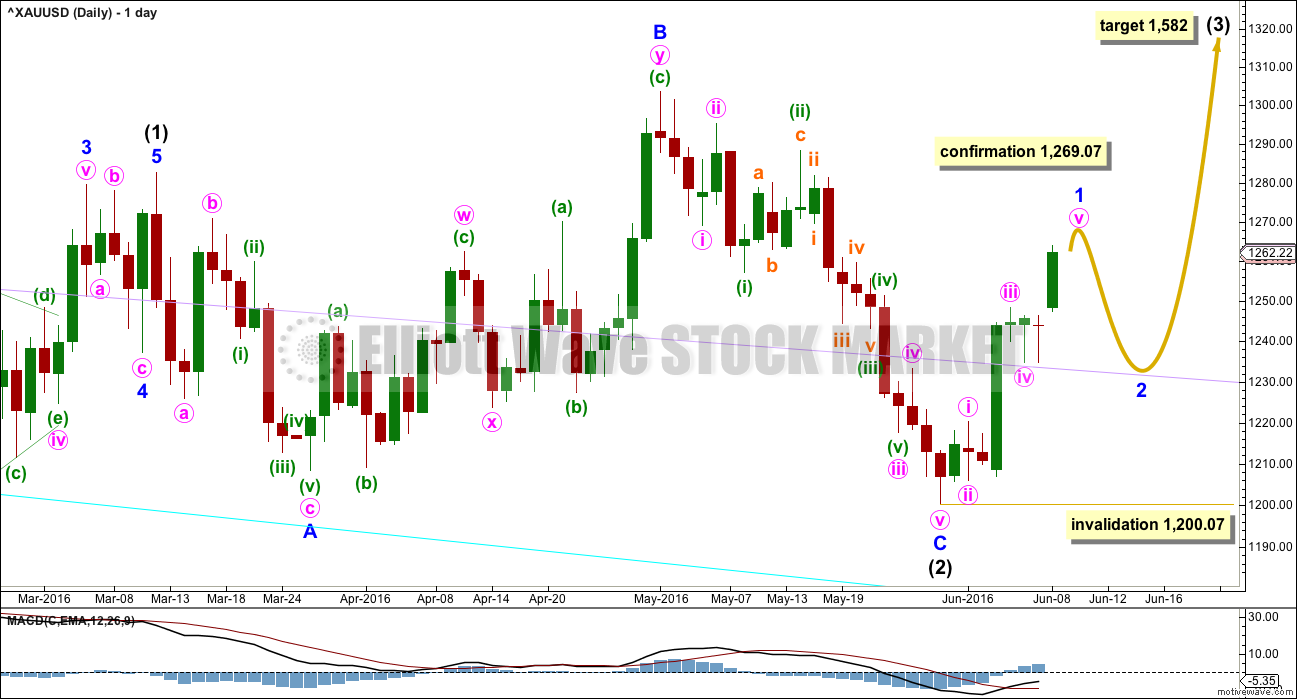
Intermediate wave (2) may be a complete expanded flat correction. It would be a shallow 0.350 correction of intermediate wave (1) lasting 56 days, just one more than a Fibonacci 55. There would be no Fibonacci ratio between minor waves A and C. Minor wave C is a complete impulse.
Within intermediate wave (3), no second wave correction may move beyond the start of its first wave below 1,200.07.
The first wave up within intermediate wave (3) may now be very close to completion; the degree of labelling today within it is moved up one. When it is complete, then a following second wave correction should unfold and last about one to two weeks. If this wave count is correct, then the upcoming second wave correction may offer an opportunity to join the upwards trend at a good price.
At 1,582 intermediate wave (3) would reach 1.618 the length of intermediate wave (1).
MAIN HOURLY ELLIOTT WAVE COUNT
Click chart to enlarge.
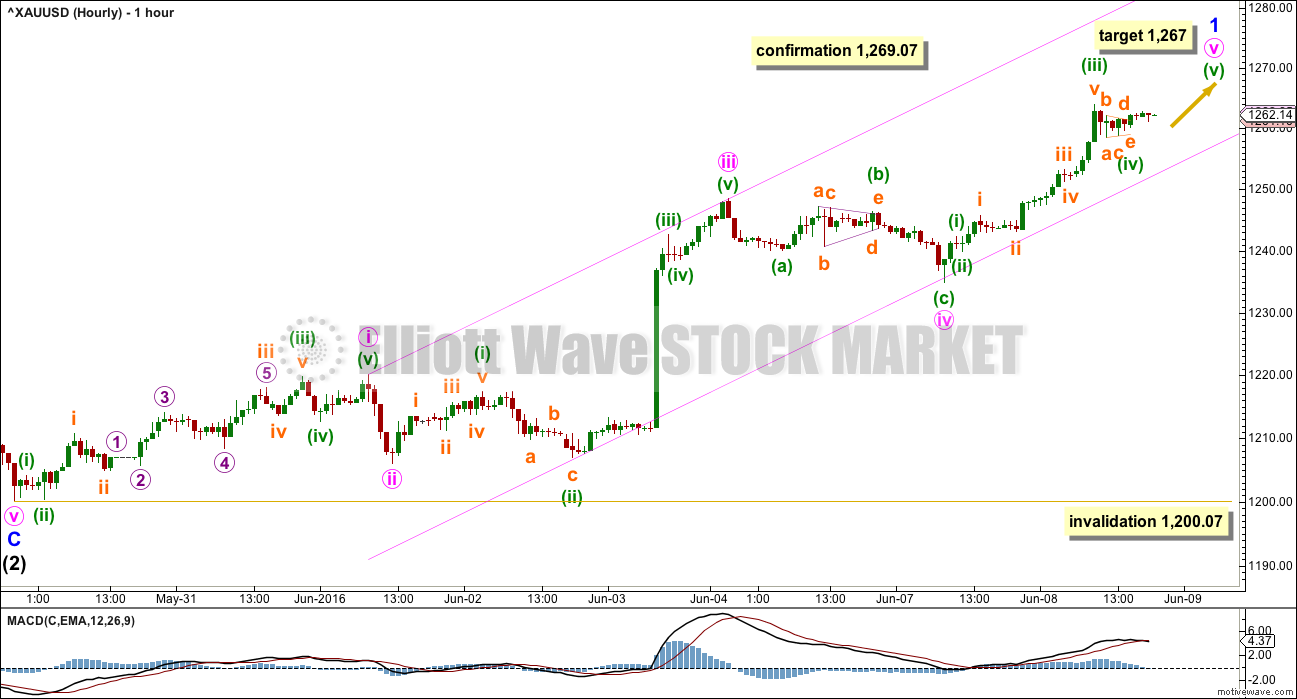
The degree of labelling has been moved up one given the size of this movement now on the daily chart.
An impulse looks like it is unfolding upwards at both the daily and hourly chart levels. This increases the probability of this wave count over the alternate below.
There is no Fibonacci ratio between minute waves i and iii so far within the impulse. This makes it more likely that minute wave v will exhibit a Fibonacci ratio to either of i or iii. Minute wave v has passed equality in length with minute wave i. The next likely ratio is 1.618 the length of minute wave i which would be achieved at 1,267. If this target is too low and if price manages to reach above 1,269.07, then this main wave count would be confirmed by price and the alternate below would be invalidated.
Draw a channel about this upwards movement: draw the first trend line from the ends of minute waves i to iii then place a parallel copy on the end of minuette wave (ii) so that most upwards movement is contained. The lower edge of this channel perfectly showed where downwards movement found support, so the channel is reinforced.
Sometimes Gold exhibits swift strong fifth waves. Look out for this tendency here. If price breaks above the upper edge of this channel, then that would be what is happening. At that stage, targets may be too low. However, swift strong fifth waves for Gold are more commonly seen to end its third wave impulses and not often for its first wave impulses. Be aware of this possibility, but in this instance it is not the most likely scenario.
When minor wave 1 is complete, then a Fibonacci retracement may be drawn along its length. The 0.618 and 0.382 Fibonacci ratios would then be targets for minor wave 2 with the 0.618 Fibonacci ratio favoured.
ALTERNATE DAILY ELLIOTT WAVE COUNT
Click chart to enlarge.
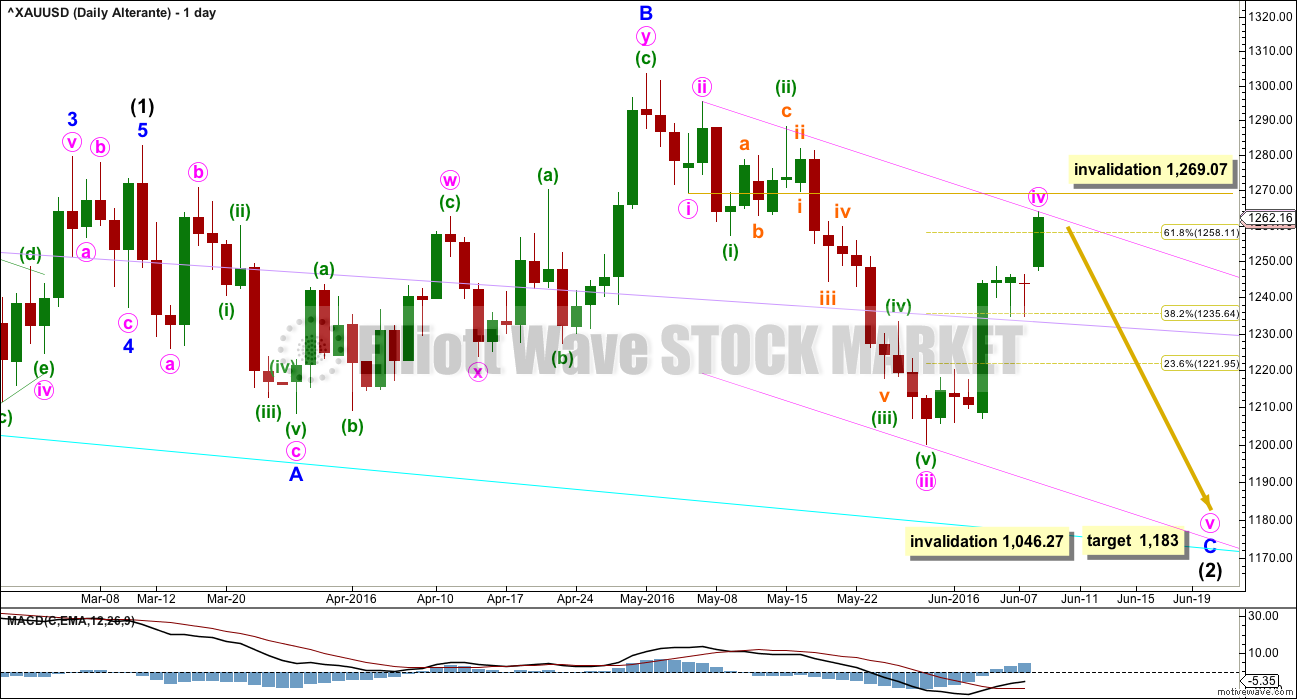
This wave count is now an alternate because volume and short term structure do not favour it at this stage. Further upwards movement today leaves this wave count with the wrong look: minute wave iv is now far too deep and large and looks like a five wave impulse and not a zigzag. Probability of this alternate is further reduced today. Probability is now very low.
Intermediate wave (2) may still be incomplete; minute wave v downwards may still be required to complete it. At 1,183 minor wave C would reach 1.618 the length of minor wave A.
Minor wave C may be an incomplete impulse. Minute wave iv may be over. If minute wave iv continues any higher, then it may not move into minute wave i price territory above 1,269.07. That must remain the final invalidation point for this wave count.
To the downside, intermediate wave (2) may not move beyond the start of intermediate wave (1) below 1,046.27.
ALTERNATE HOURLY ELLIOTT WAVE COUNT
Click chart to enlarge.
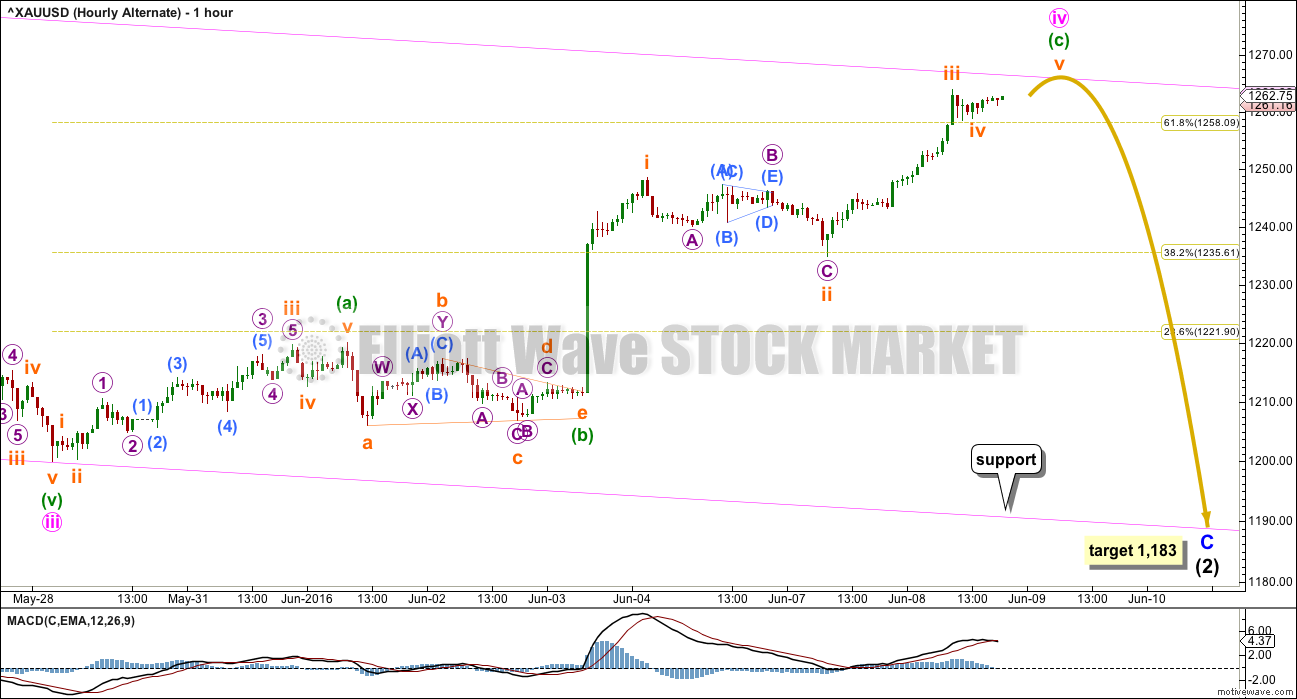
Minute wave ii was a quick deep 0.76 zigzag lasting 23 hours. Minute wave iv exhibits no alternation in structure with minute wave ii: both are zigzags. Minute wave iv no longer exhibits good alternation in depth because it is now relatively deep at 0.68 of minute wave iii.
The lack of alternation in structure reduces the probability of this wave count. The reduction in alternation in terms of depth reduces probability further.
Sideways movement labelled minuette wave (b) fits perfectly as a triangle. There is no Fibonacci ratio between minuette waves (a) and (c).
This wave count would be invalidated with a new high above 1,269.07. In the short term, both wave counts expect the same direction next: downwards movement. How low that wave down goes and its structure will indicate which wave count is more likely.
TECHNICAL ANALYSIS
DAILY CHART
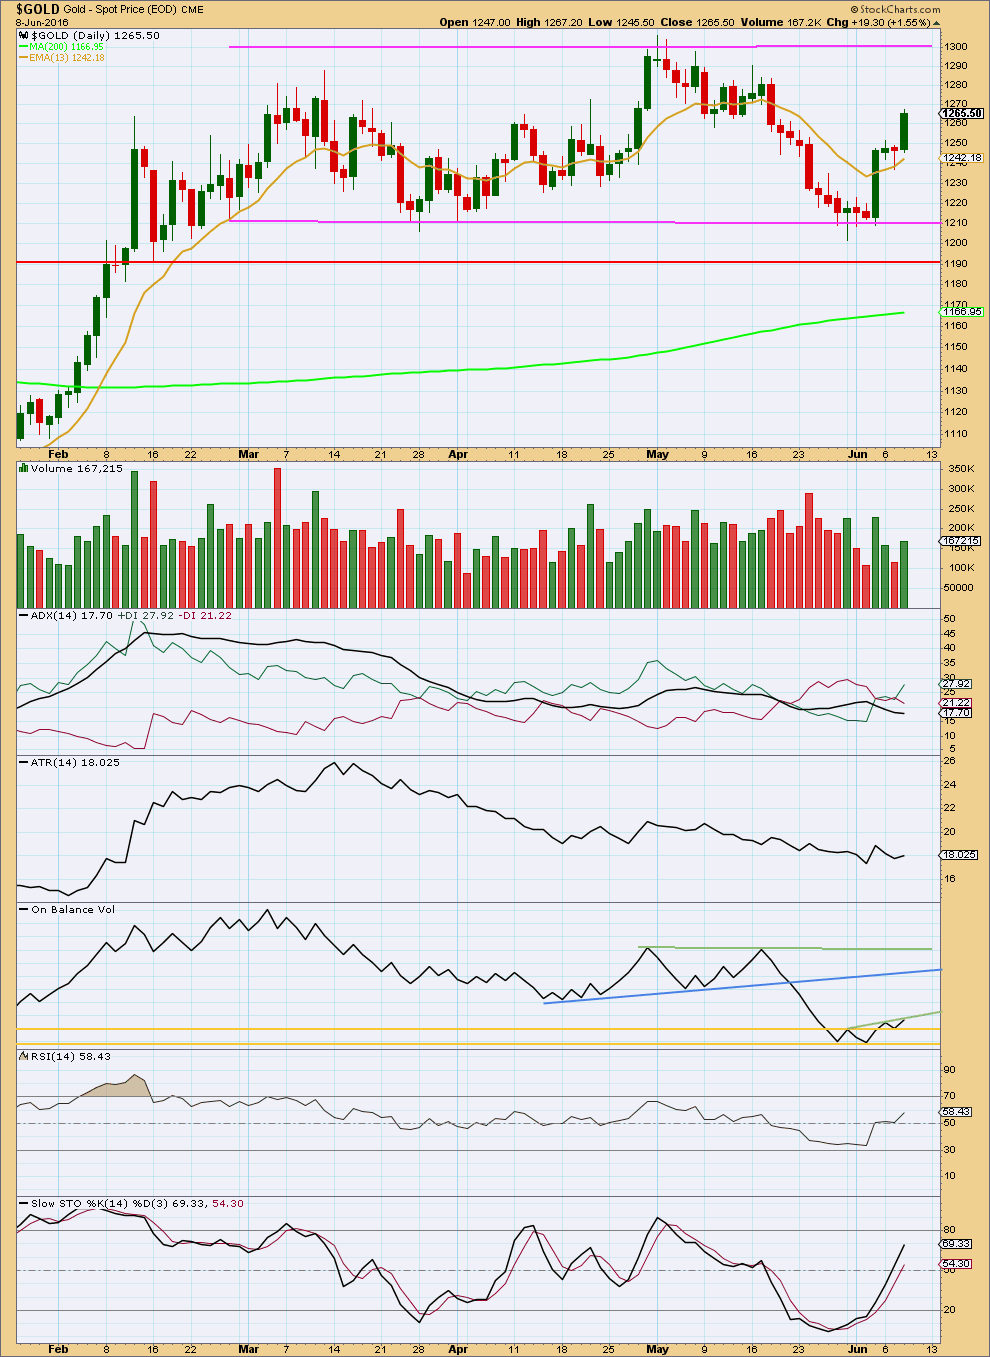
Click chart to enlarge. Chart courtesy of StockCharts.com.
There is some increase in volume to support upwards movement today. This supports the main wave count over the alternate again.
Price found support at the 13 day moving average. This average usually provides reasonable support or resistance when Gold is trending.
ADX still is declining indicating the market is not yet trending. ATR is overall still flat, so these two indicators are still in agreement. However, they are both lagging as they are based on 14 day averages.
On Balance Volume offered a weak bullish signal with a break above the upper yellow horizontal line. A retest of that line was another bullish signal now that OBV has moved up and away from it. A new green line is drawn across the last two highs from OBV. A break above this line would be another weak bullish signal.
There is no divergence between price and RSI to indicate weakness in upwards movement. RSI is not yet extreme. There is room for price to rise further.
If this market is range bound as ADX and ATR suggest, then a range bound approach would expect a continuation of this upwards swing from here to end only when price finds resistance and Stochastics is overbought at the same time. Stochastics is not yet overbought.
This analysis is published @ 08:15 p.m. EST.
Well that last target didn’t work did it.
The hourly wave count is adjusted. New target, 1,277.
Minute wave iii may have ended at the last high as a long extension. There’s no ratio between minute i and iii, so it’s likely minute v would exhibit a ratio. At 1,277 minute v = minute i, the most common ratio.
At least we now have confirmation of an intermediate degree trend change, and only one wave count left.
The channel is still working really well so keep drawing it in the same way.
Only when the lower edge of this channel is clearly breached by at least one full hourly candlestick below and not touching (and preferably with obviously downwards movement, not sideways) will it be telling us that Gold has likely ended the first five up and begun the first three down.
Also: in my response to Richard below about a concern (and a valid one) that Gold may not have a reasonable correction and you may miss a good trend.
If that is a concern then use this channel on the hourly chart. Each time Gold touches the lower edge enter long with a stop quite close, a little below the trend line.
The theory is this: if this trend is going to continue with only small corrections for a while then support is so far shown to be at that trend line. Buy the dips.
As soon as that line is properly breached then long positions should be exited, particularly if they are losing positions, cut the loss there short.
As always, never ever anything ever invest more than 3-5% of your equity on any one trade, and always use a stop loss.
Gold now still looks bullish month, week and gold.
I’m concerned this may repeat before when we waited for gold dip to get in for missed it.
I meant bullish month week and daily all SMA/EMA BUY.
That’s a valid concern. One approach may be to buy the dips. Each time price touches the lower edge of the channel enter long with a stop a little below the channel. If this trend is continuing and won’t have a larger correction for a while then such a position should be profitable quickly.
It’s a low risk approach that may well work.
Dollar hits 1-month low versus yen as nervous investors seek safety –
Also UK Brexit pushes dollar down and gold up safe haven
http://www.marketwatch.com/story/dollar-weakness-persists-as-fed-rate-cut-expectations-soften-2016-06-09
Billionaire investors back a gold rally in 2016
Oilprice.com | about 2 hours ago
http://www.mining.com/web/billionaire-investors-back-a-gold-rally-in-2016/
Yesterday gold got a SMA/EMA BUY on the Daily time frame.
Yesterday morning Gold got a BUY firing on the 195 minute time frame, which is very strong and long. Today got BUY firing on all the shorter time frames and an SMA/EMA BUY on NUGT still.
Gold may be bullish until the close today.
Maybe before close Lara can give us a new chart.
In the meantime the gold trend is up until trend channel confirmation of at least one hourly candlestick below the hourly channel.
Check pmbull.com and see that gold is right this minute in the middle of the hourly channel.
I wouldn’t short this, especially since surprises are to the upside. Maybe buy some fast intraday dips unless you are already lucky enough to be bullish and letting your profits run.
Day high of 1271.80 at 12:38 pm still remains the high, however GDX and NUGT made another day high since then aaround 2 pm as the investors are very bullish buying up miners.
Gold just hit day high of 1,271.55 at 12:36 pm.
Alan’s target explained below – M5 could end at 1271.25
August gold futures at 1274 and change ,This is the ACTIVE month to be watched . Where does it stop Lara? Would like to short ,BUT?????
Minute 5 of Minor 1 revisited: could the wave count be like this?
I have a slightly different view of Minute 5. My Minuette 1 is where Lara placed her SM1; Minuette 2 is where SM2 is. Minuette 3 ended at 1266.45; Minuette 4 is at today’s low of 1256.84. Minuette 5 should theoretically end at 1267.98 (where M5 = M1). Alternatively, M5 could end at 1271.25 (M5 = 0.618*M3). This concludes Minor 1. Obviously the alternate has been invalidated.
Now that it seems Minor 1 completed at 1269.55, this would indicate that Minor 2 retraces to 1226.51 (0.618 Fib), with a slight chance at 1242.94 (0.382 Fib).
* As I mentioned before, I could not find a (free) software that allows annotation speedily. So, I cannot furnish a graph. If anyone knows of one such software, I would appreciate that you could let me know. I could then post with graphs. That is easier than describing in verbose words. Thank you.
Thanks for the update.
Apologies. I made a mistake. Minuette 5 may not have ended yet. On closer scrutiny, 1269.55 was only the third wave up at subminuette level. So, I’m plumbing for 1271.25.
Hi Alan/ Richard,
Just wondering if you think gold is being stubborn after hitting its M5 target and/ or if you can offer any insight of what behavior you might expect from this point and time?
Thanks!
Hi Stephen.
The day high at 1271.80 ought to be Minuette 5 of Minute 5 of Minor 1.
If this is correct, the next move would logically be the Minute 2 correction. Minor 2 would be in 3 waves terminating most probably at 0.618 Fib, which is currently 1227.37.
Ok… this is what I picked up from the notes as well. Thanks! I guess I was thinking that gold wouldn’t be hovering around the 1270 mark for the next couple of hours after reaching the target. I also know that trying to predict gold’s behavior is difficult and we get spoiled with your updates and the accuracy of expectations.
Try Invesring.com or Tradingview. Works for me.
Thanks Dreamer. I’ll give them a try during the weekend.
Sorry for the typo. That was Investing.com or Tradingview.com.
Alternate daily and alternate hourly wave counts have both just been invalidated.
Gold just hit a high of 1,269.55 at 10:35 am
Lara’s invalidation point was 1,269.07.
10:36am Stocks retreat after 3-day climb as oil eases off highs
Wasn’t expecting this wave back up this morning so high to 1267.18 at 10:26 above the overnight high of 1266.45 at 7:48 pm
Hopefully that was the morning high and down gold moves?
No breach yet for trend channel confirmation.
Any wave counts does the move up look complete from the overnight low of 1256.84 at 6:10 am?
http://www.pmbull.com/gold-price/
1 hour chart is now lined up perfectly with Lara’s hourly chart.
Gold needs to breach below bottom trend line by at least 1 full hourly candlestick for trend channel confirmation gold price is dropping.
LARA – “seriously, until the trend channel is breached this fifth wave may still be continuing.
No confirmation that it’s over yet”
Good night Richard, and everybody else too!
So far so good…. and yes, a full hourly candlestick please below that lower trend line.
If that happens from here then the targets are 0.618 Fibonacci ratio = 1,225, or 0.382 Fibonacci ratio = 1,241.
Favouring the 0.618 because this is a second wave.
It’s a counter trend movement (most likely) so not a good trading opportunity for trend followers. Only the adventurous and experienced should attempt to trade it down for a quick scalp.
Good luck!
Spot gold today was strong throughout the trading day while GDX gap up and sold off. GDX didn’t hold up as well as gold. Looks like the strong hands are selling to the weaker hands.
What Goes Up, Must Come Down . . .But Sometimes, Only A Little
Avi Gilburt – June 8, 2016
http://www.gold-eagle.com/article/what-goes-must-come-down-sometimes-only-little
GDX FORECAST $40+ as per Elliott Wave
Avi Gilburt (see link above) new article today but initially released to his subscribers last Saturday night called this week right – GDX target wave i about $26.25. Wednesday GDX high $26.50 and his wave ii target for GDX maybe about $24.10.
With last Friday’s break out, it gives us a lot more confidence that the rally to the 40+ region in the GDX. It becomes much more likely that we are on our way to the 40+ region for GDX , but still needing a wave (ii) pullback/consolidation over the next week or two.
Lara’s top target is $1,267 and I think it topped tonight at $1,266.45 at 7:48 pm and 1 or 2 weeks to minute ii target about $1,225.43
Lara is losing her magic touch. She was off by 0.55. :))
Devastating 😉
but seriously, until the trend channel is breached this fifth wave may still be continuing
no confirmation that it’s over yet
This is just my observation not EW but look at pmbull on the daily time frame it hit top trend line, where Lara forecast a top.
http://www.pmbull.com/gold-price/