
A breach of the small channel on the daily Elliott wave chart indicated a correction had arrived.
Summary: A third wave is underway. The mid term target is at 24.22. Risk and the invalidation point is at 15.818. In the short term, a correction has arrived and should continue lower for several more days (at least three more and probably eight more) to about 16.565. At its end, it should offer a good opportunity to join the upwards trend.
New updates to this analysis are in bold.
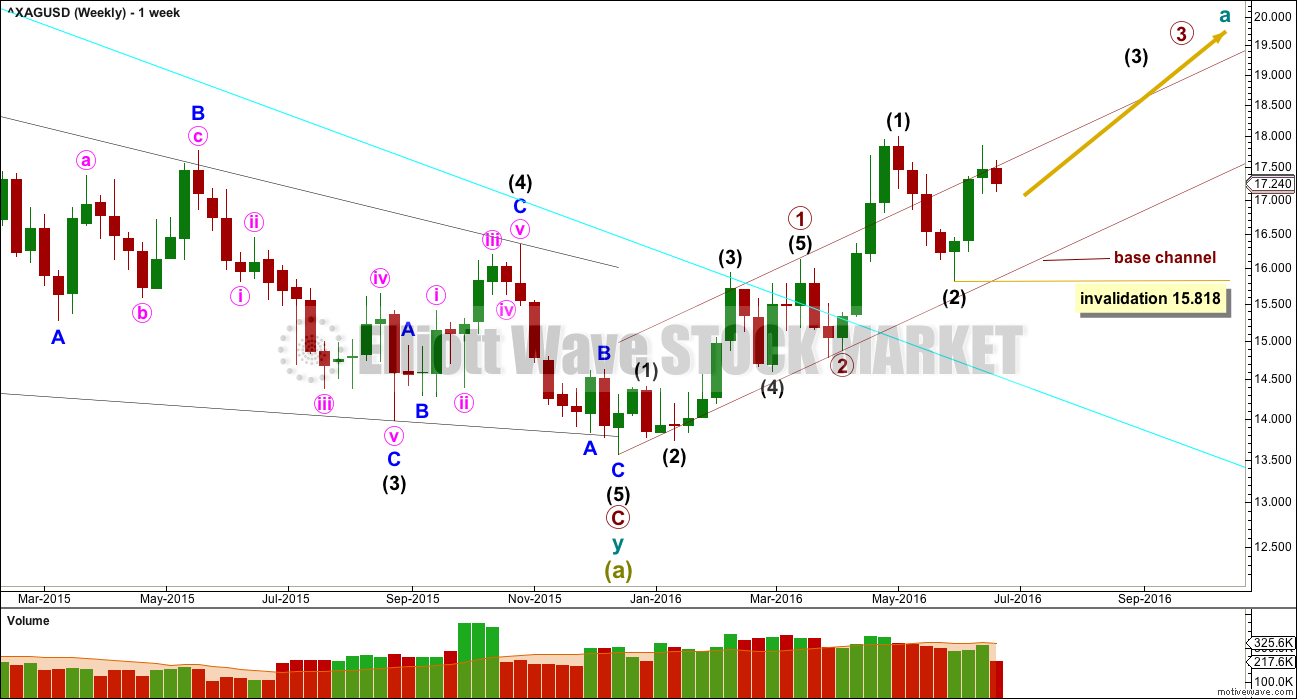
WEEKLY WAVE COUNT
Click chart to enlarge.
Two first and second wave corrections may be complete. Silver may be ready to move into a strong third wave up.
If this is correct, then within intermediate wave (3) no second wave correction may move beyond the start of its first wave below 15.818.
Draw a base channel about primary waves 1 and 2 as shown. The lower edge should provide support for any deep corrections along the way up.
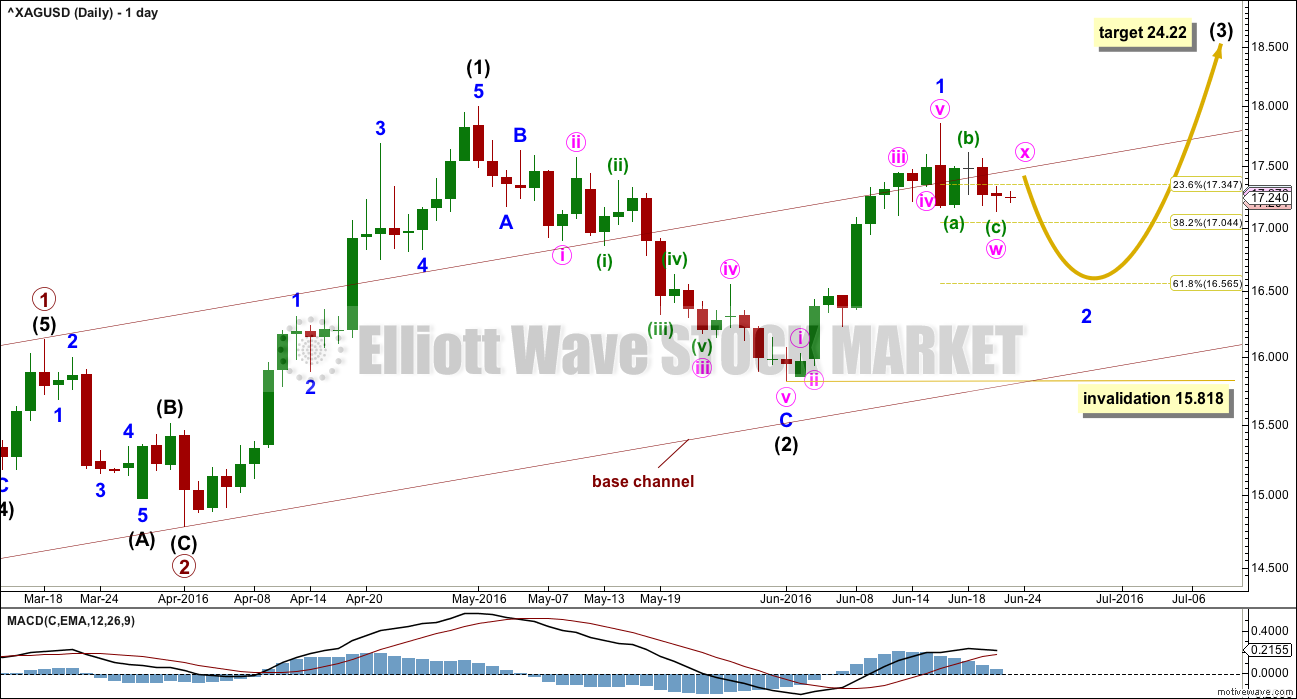
DAILY WAVE COUNT
Click chart to enlarge.
At 24.22 intermediate wave (3) would reach 2.618 the length of intermediate wave (1).
A small channel about minor wave 1, which was drawn on last week’s daily chart, was breached by downwards movement indicating that minor wave 1 was over. Minor wave 1 lasted eleven days.
Minor wave 2 is most likely to be a relatively deep single or multiple zigzag. The most likely target for it to end would be the 0.618 Fibonacci ratio at 16.565. So far it has not reached the 0.382 Fibonacci ratio.
So far a single zigzag downwards may be complete. Minor wave 2 may be unfolding as a double zigzag. If minor wave 2 is a double zigzag, then minute wave x would most likely be a quick shallow zigzag.
So far minor wave 2 looks to be too brief and too shallow to be complete. It would be a reasonable expectation for it to continue to move lower and take more time to be better in proportion to minor wave 1.
If it is deeper than the 0.618 Fibonacci ratio, then minor wave 2 may find final support at the lower edge of the base channel.
Minor wave 2 may not move beyond the start of minor wave 1 below 15.818.
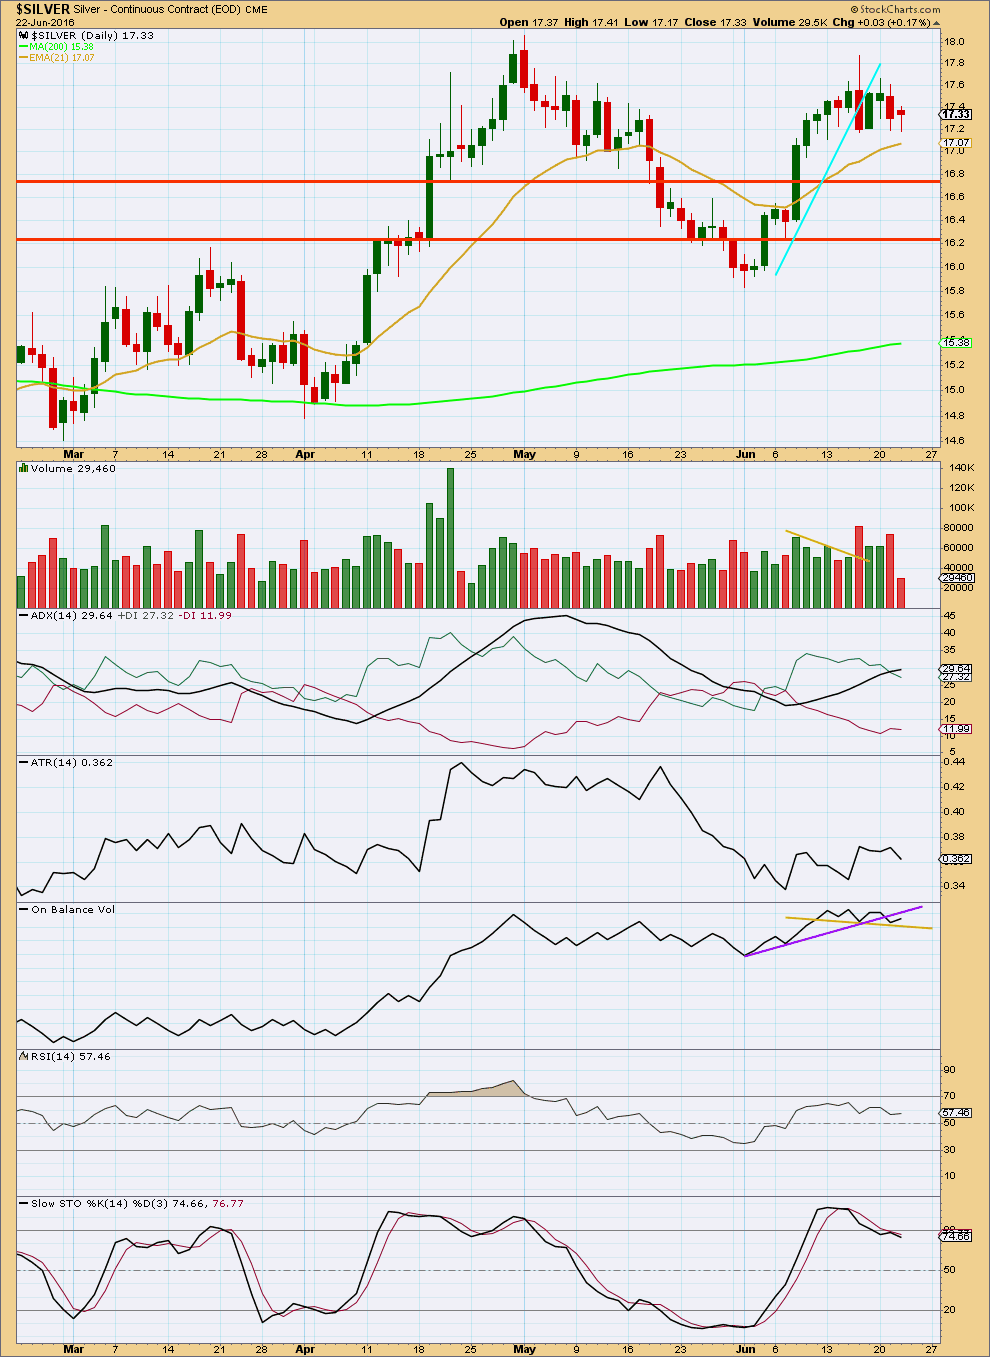
TECHNICAL ANALYSIS
DAILY CHART
Click chart to enlarge. Chart courtesy of StockCharts.com.
Downwards movement for the session of 22nd June comes with very light volume. The fall in price was not supported by volume. This suggests some upwards movement may unfold short term for one to a few days.
Price broke below the short term cyan support line indicating a trend change. A small consolidation looks to have begun. So far strongest volume within it is downwards which suggests a downwards breakout is more likely than upwards. This is not always reliable for Silver. Support may be found about 16.70, and 16.25 below that.
ADX is still increasing indicating an upwards trend is in place. ATR is declining in disagreement. It is not clear if Silver is trending or not at this stage, and as price has been essentially moving sideways for five sessions price suggests a consolidation.
RSI is just above neutral. There is room for price to rise or fall. Stochastics is returning from overbought. If the market is consolidating, then more downwards movement would be expected overall to continue until price finds support and Stochastices is oversold at the same time.
This analysis is published @ 02:16 a.m. EST on 23rd June, 2016.
Lara,
Can the wave count be subdivided so that Minor 1 topped on Thursday night when Brexit was announced? This means that where Minor 1 is labelled on the chart, it will be relabelled Minute 3 with Minute 5 topping on Thursday night. Is it possible we are now in Minor 2 pullback?
Thanks.