
Last week’s analysis expected more downwards movement towards a target at 15.933 or 15.113.
Downwards movement continued and so far has reached 15.818.
Summary: The structure may now be complete but a trend change is unconfirmed. Assume the trend remains down, until proven otherwise.
New updates to this analysis are in bold.
WEEKLY WAVE COUNT
Click chart to enlarge.
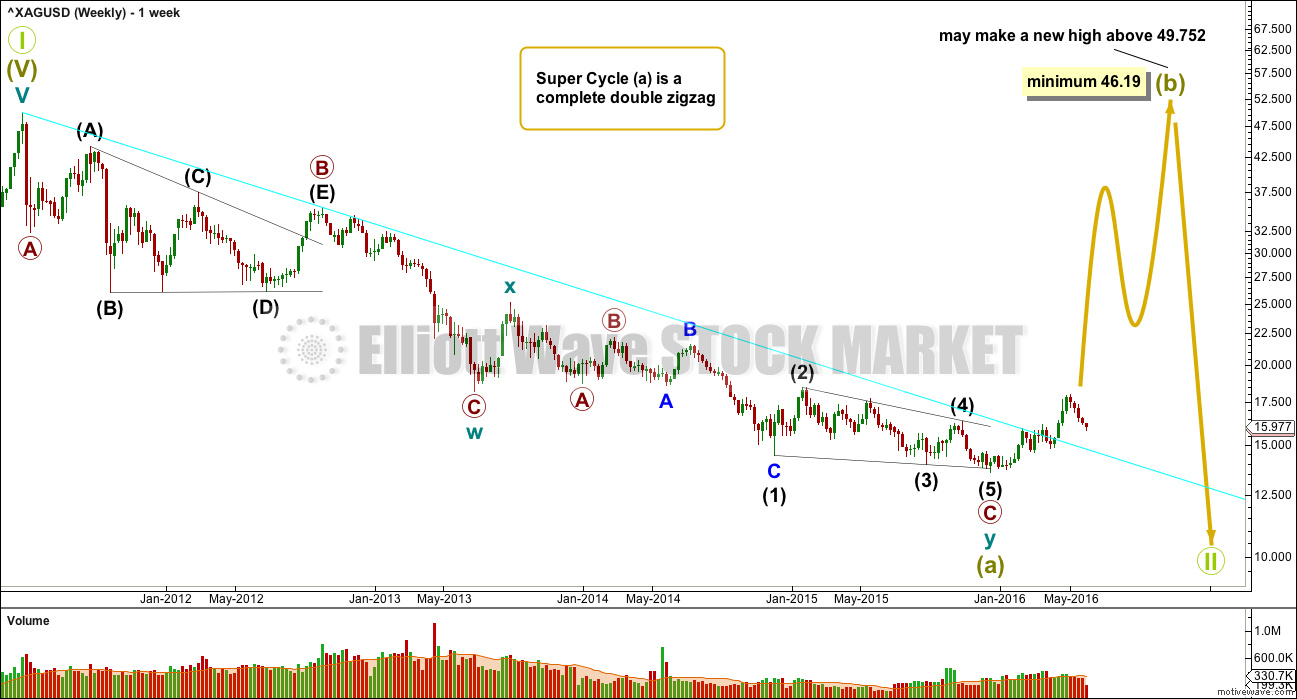
If super cycle wave (a) is a double zigzag, then within the second zigzag of the double labelled cycle wave y the structure may be complete.
Primary wave C is an ending contracting diagonal within the zigzag of cycle wave y. All subwaves subdivide as zigzags. The third wave is shorter than the first, the fifth wave is shorter than the third, and the fourth wave is shorter than the second. The trend lines converge.
There is a small overshoot of the (1)-(3) trend line at the end. This indicates the contracting diagonal structure is very likely to be complete.
If this wave count is correct, then super cycle wave (a) has subdivided as a three wave structure. That indicates Grand Super Cycle wave II may be a flat correction.
If this correction at Grand Super Cycle is a second wave (as opposed to a fourth wave), then a triangle may be eliminated.
A combination may also be eliminated because the first wave is a multiple. Combinations may only consist of a maximum of three corrective structures, so within each of W, Y and Z they may only subdivide into simple A-B-C structures (or A-B-C-D-E in the case of triangles). To label multiples within multiples increases the maximum beyond three, violating the rule.
Super Cycle wave (b) must retrace a minimum 90% of super cycle wave (a) at 46.19. Super cycle wave (b) may make a new price extreme beyond that seen for super cycle wave (a) above 49.752 as in an expanded flat.
Super cycle wave (b) may be any one of 23 possible corrective structures. It is impossible to predict at this early stage which one it will be, only to say it is unlikely to be a rare structure such as a running flat, expanding triangle or triple combination. That still leaves multiple structural possibilities. The most likely structure which would be able to meet the minimum price requirement at 23.945 is a zigzag.
The first movement up for a wave of this large degree must subdivide as a clear five at the daily chart level, and probably at the weekly chart level also.
FIRST DAILY WAVE COUNT
Click chart to enlarge.
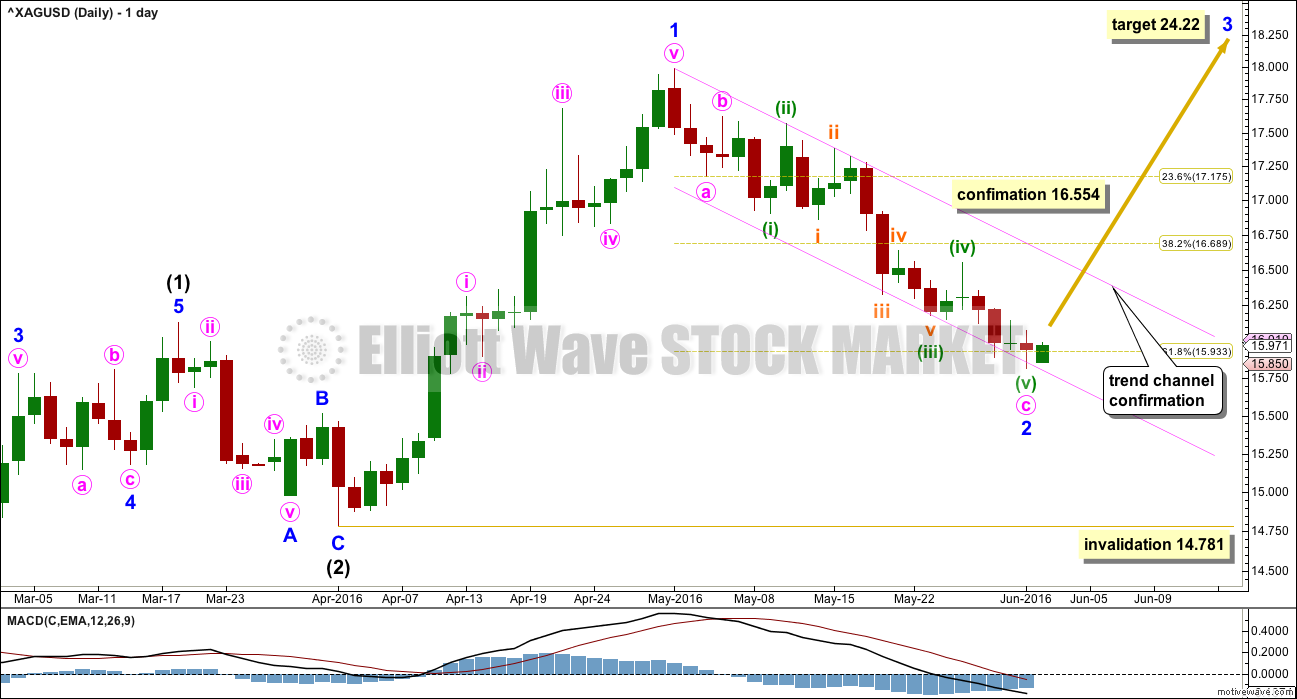
Minor wave 2 may be a complete zigzag. There is no Fibonacci ratio between minute waves a and c.
The pink channel is a best fit. So far it shows where price is finding resistance and support. When this channel is breached by a full daily candlestick above and not touching it, then it will provide trend channel confirmation of a trend change.
A new high above 16.554 would provide price confirmation of a trend change.
At 24.22 minor wave 3 would reach 2.618 the length of minor wave 1. That is the ratio I am using for this target because the middle of a third wave is often a stretched out extension.
It must be accepted that price movement could continue lower while it remains within the channel. Minor wave 2 may not move beyond the start of minor wave 1 below 14.781.
SECOND DAILY WAVE COUNT
Click chart to enlarge.
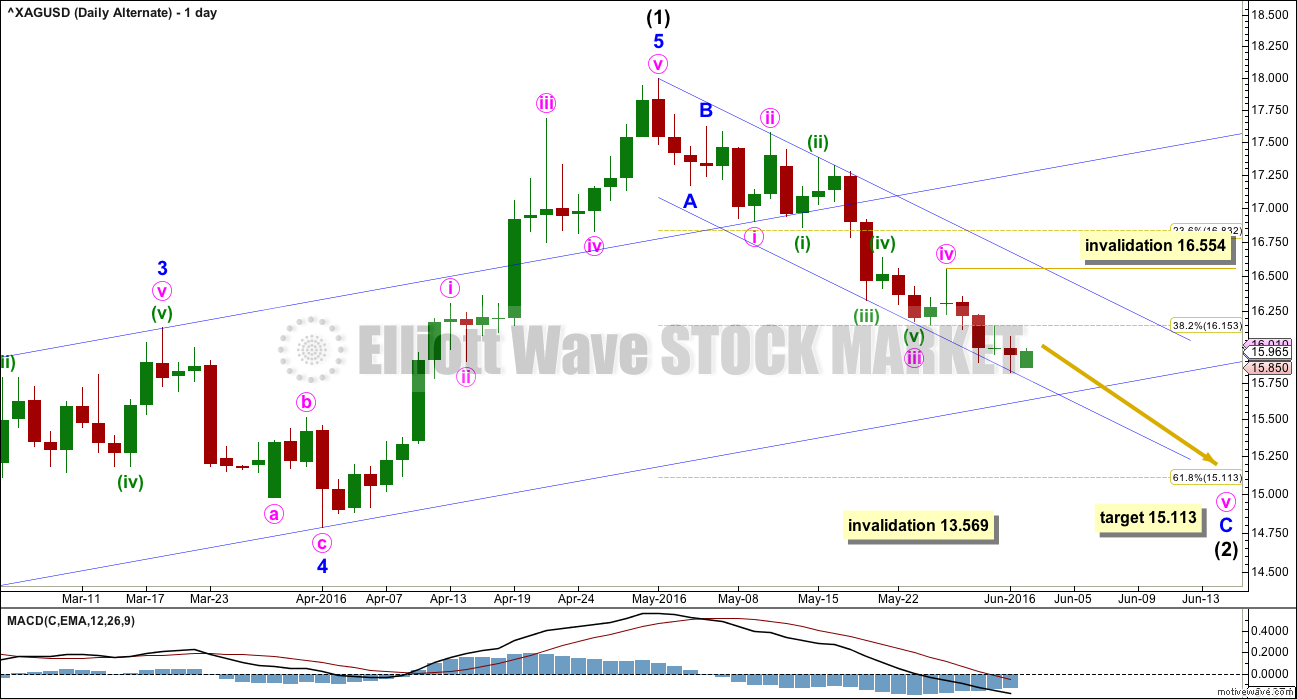
The structure for the downwards correction is the same for both wave counts. If intermediate wave (2) corrects to the 0.618 Fibonacci ratio of intermediate wave (1), it would end about 15.113.
If this correction is intermediate wave (2), then the invalidation point is lower. Intermediate wave (2) may not move beyond the start of intermediate wave (1) below 13.569.
This second wave count expects more downwards movement because it would be most likely that intermediate wave (2) would break below the lower edge of the dark blue channel which is drawn about intermediate wave (1).
Price may not provide clarity between these two wave counts if the target is correct. Momentum and structure in coming weeks may indicate which wave count is correct.
TECHNICAL ANALYSIS
DAILY CHART
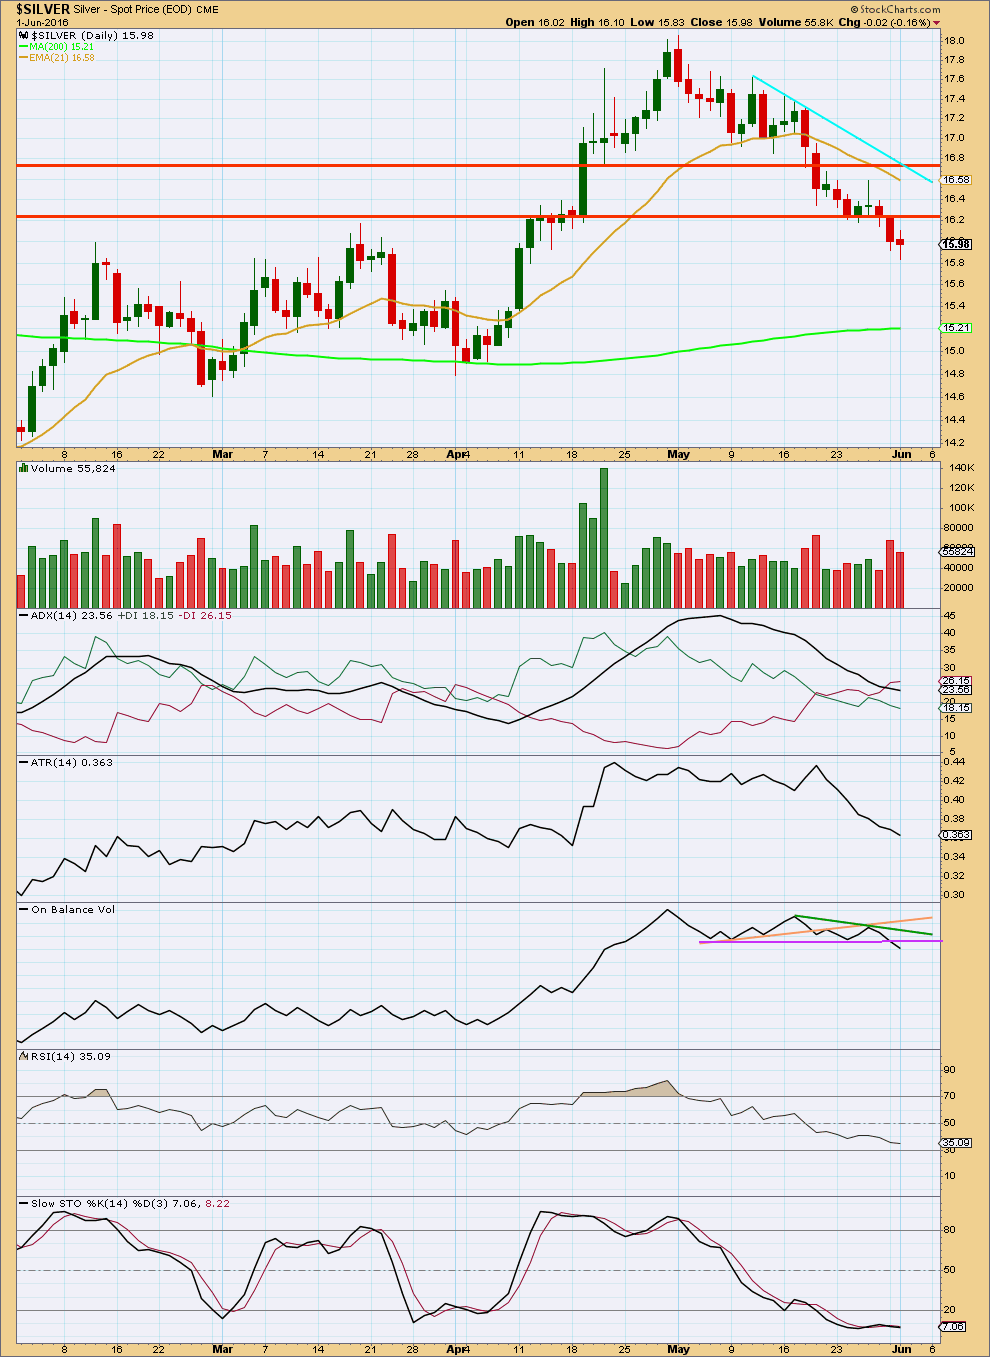
Click chart to enlarge. Chart courtesy of StockCharts.com.
ADX has been declining for the entire downwards trend from the high on 2nd of May, indicating the market is not trending while it clearly is trending.
There is something wrong with this trend. ATR too is declining. Normally, during a trending market ATR will increase and during a consolidation ATR normally declines.
This downwards movement from price must be concluded to be a counter trend movement.
On Balance Volume has just broken below the lower purple line. This indicates more downwards movement may yet unfold.
There is no divergence between price and RSI to indicate a low is in place. RSI is not yet extreme. There is still room for price to fall further.
There is some divergence between price and Stochastics, between the low of 25th May and 1st June. While price made a new low Stochastics made a slightly higher low. This divergence is bullish and indicates weakness to downwards movement.
Overall, the conclusion from this classic technical analysis must be the same as the Elliott wave analysis: the downwards movement looks like a counter trend movement and the upwards trend should be expected to resume. Downwards movement may end here, or it may continue a little lower. The best way to tell when it has ended would be a trend line. When the cyan line is breached by upwards movement, then a trend change would be indicated.
This analysis is published @ 03:17 a.m. EST on 2nd June, 2016.
Hi Lara. I’m new to your Silver and Oil as well as Gold.
One question: At what time do your charts begin new days? Is it at the beginning of each session at 6:00 PM EST? I’d like to synchronize my charts with yours if possible. I know they will be a little off as all my trading goes through CME so we probably aren’t trading the exact same instruments, but I’m here mainly to learn more about Elliott Wave.
Thank you!
I’ve set my time zone on the computer I use Motive Wave to EST.
So my daily candlesticks begin with the start of the New York session.
Thanks