
Last analysis expected a correction to continue lower for a few days. This is not what happened. Price has made new highs towards the longer term target.
Summary: An upwards trend is intact. A third wave up is underway. The short term target is at 19.384. The longer term target remains the same at 24.22. Corrections are an opportunity to join the trend. If a small correction unfolds about here, it may find support about 18.00.
New updates to this analysis are in bold.
WEEKLY WAVE COUNT
Click chart to enlarge.
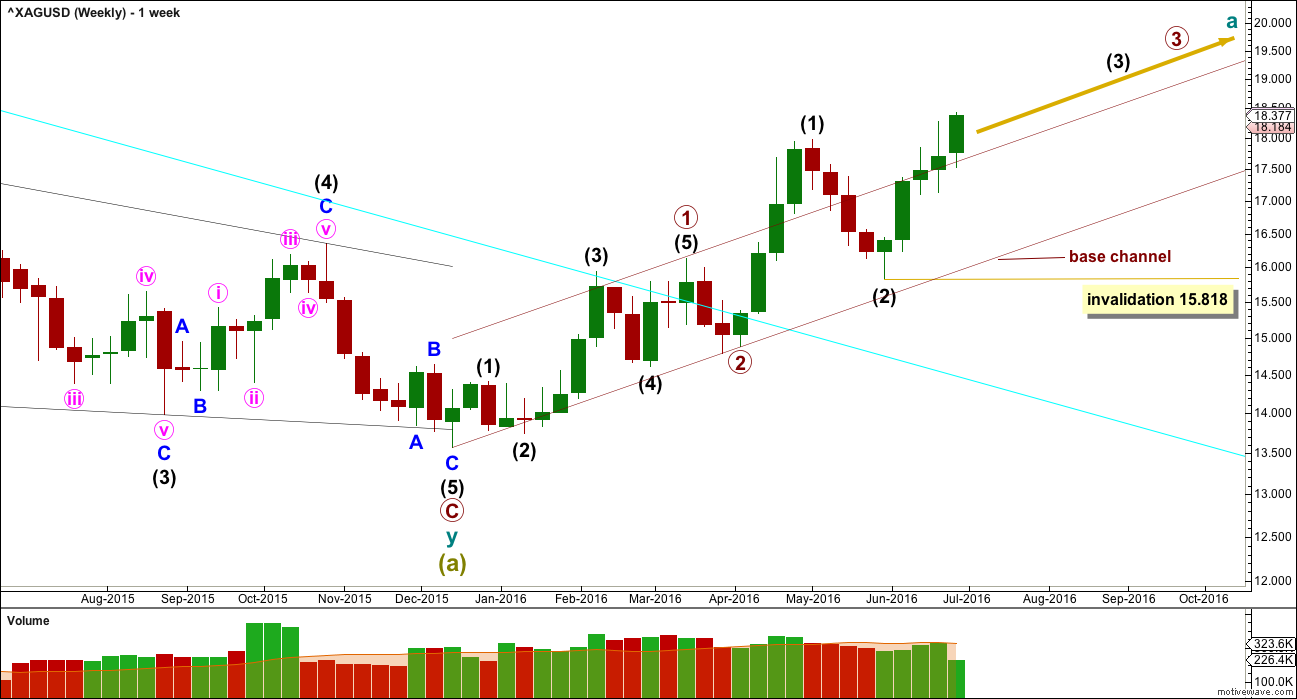
Two first and second wave corrections may be complete. Silver may be ready to move into a strong third wave up.
If this is correct, then within intermediate wave (3) no second wave correction may move beyond the start of its first wave below 15.818.
Draw a base channel about primary waves 1 and 2 as shown. The lower edge should provide support for any deep corrections along the way up. Price has broken above the upper edge confirming a third wave. The upper edge is now providing support and may continue to do so.
DAILY WAVE COUNT
Click chart to enlarge.
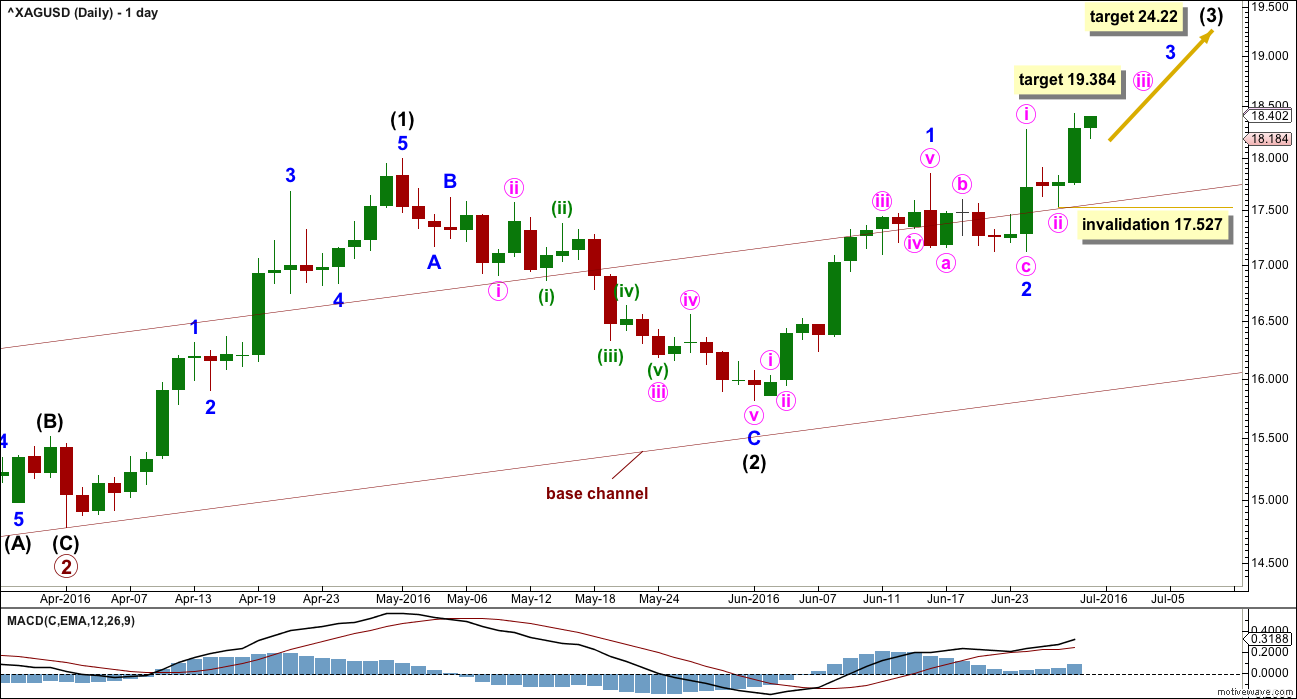
At 24.22 intermediate wave (3) would reach 2.618 the length of intermediate wave (1).
Minor wave 2 was remarkably brief and shallow but must now be complete. Upwards movement looks too long to be part of minor wave 2.
Minute waves i and ii also now look complete within minor wave 3. Minute wave ii has found support perfectly at the upper edge of the base channel.
At 19.384 minute wave iii would reach 1.618 the length of minute wave i.
No second wave correction may move beyond the start of its first wave below 17.527 within minute wave iii. If another deep second wave correction unfolds, it may also find support at the upper edge of the base channel. If that maroon trend line is touched again, then a long position should be entered there.
TECHNICAL ANALYSIS
WEEKLY CHART
Click chart to enlarge. Chart courtesy of StockCharts.com.
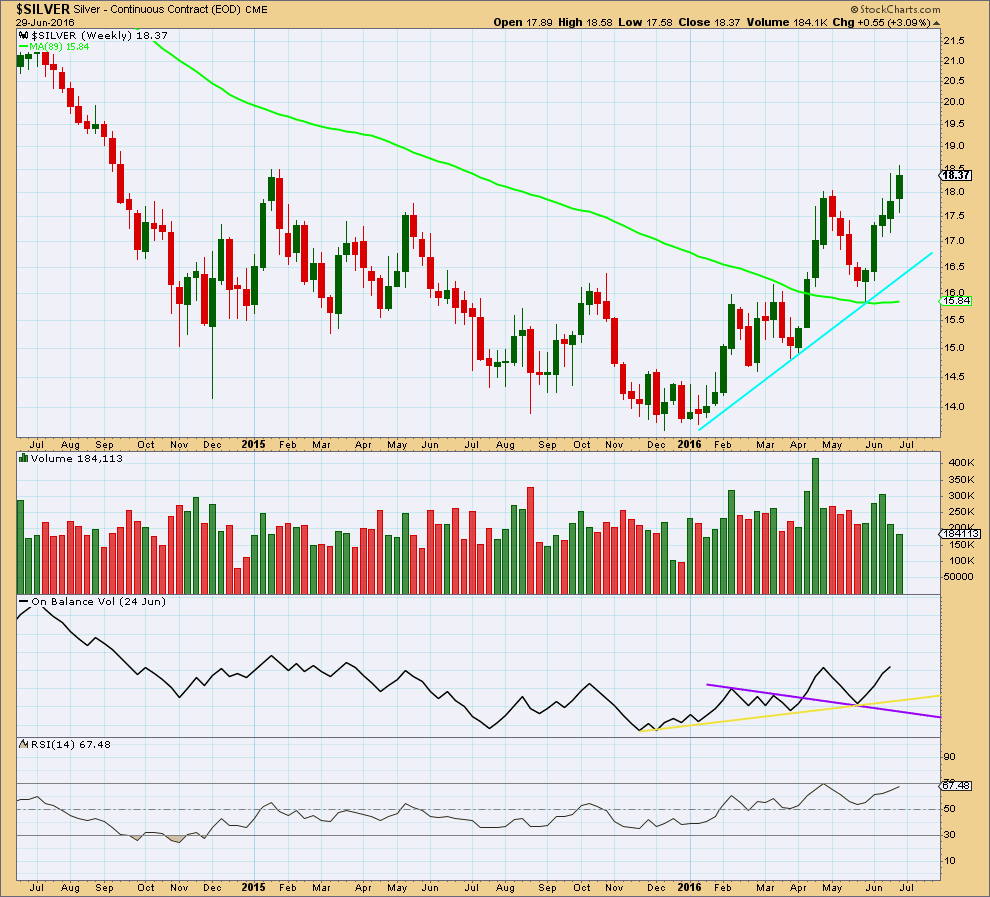
From the low in January, as price rises volume also rises and as price falls volume declines. The volume profile is bullish which supports the wave count.
A support line is added in cyan. If price again comes down to touch it, price should find strong support there.
On Balance Volume is bullish at the weekly chart level.
RSI currently exhibits slight divergence at the current high and the last swing high from April. This indicates a deeper correction may unfold, although this divergence may yet disappear by the end of this week.
DAILY CHART
Click chart to enlarge. Chart courtesy of StockCharts.com.
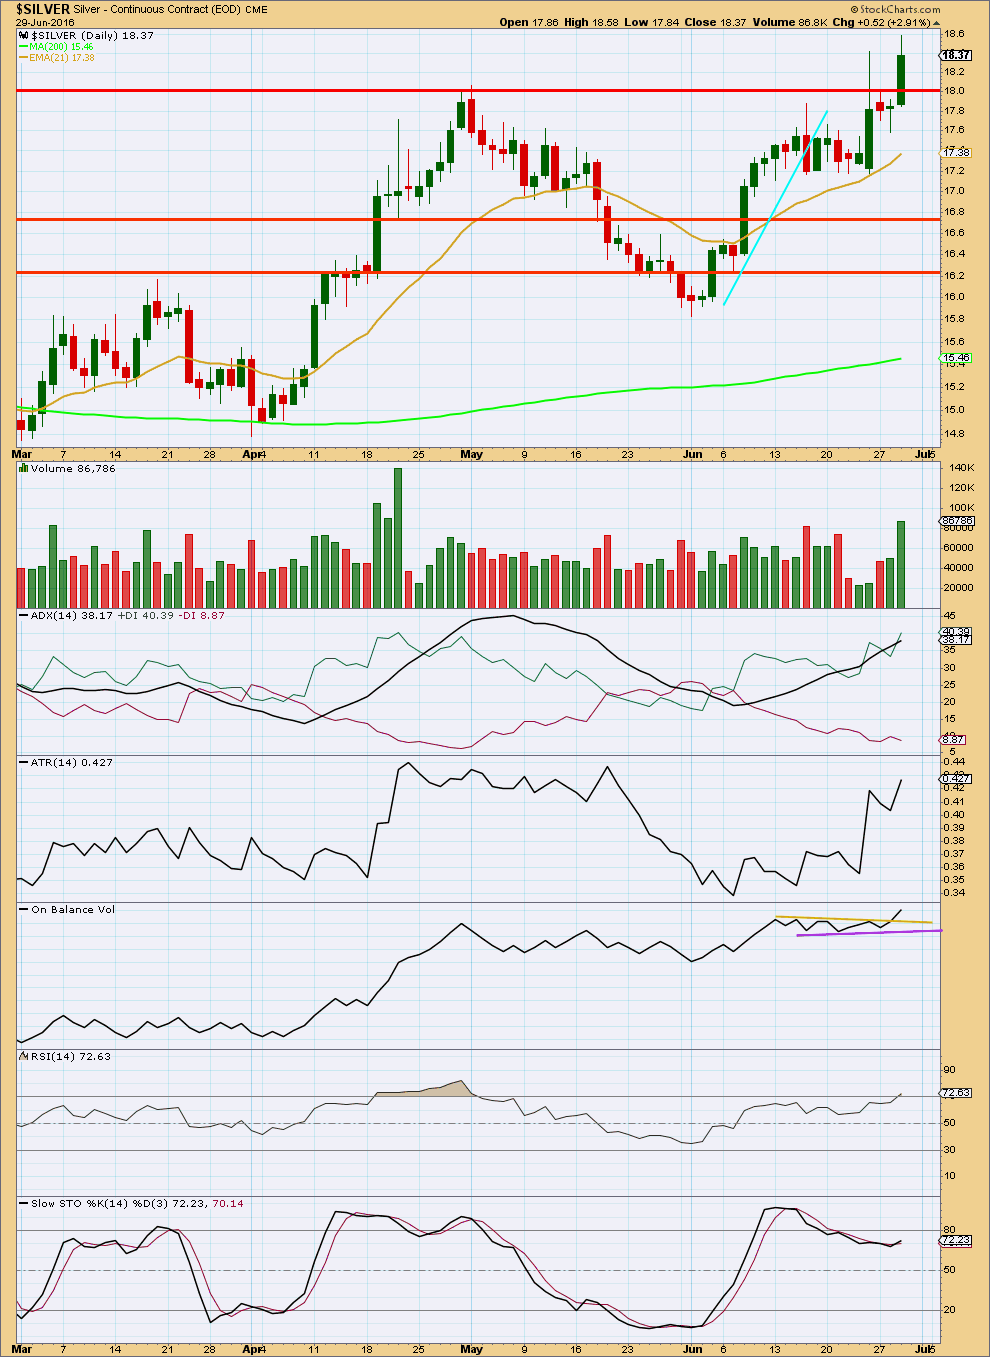
There was support for upwards movement of 29th of July. It looks like price has just broken out of a consolidation which had resistance about 18.0 on a day with increased volume.
Price often turns to retest support / resistance following a breakout. Here price may turn down short term to retest 18.00. If it does, then it should find support there before moving up and away.
ADX still indicates an upwards trend is intact and ATR agrees. ADX is nearing extreme. Above 45 and the trend may be tired. For now there is still room for the trend to continue.
On Balance Volume is bullish with a break above resistance from the yellow line.
RSI is just entering overbought, but this may remain extreme for some time during a trending market. If RSI exhibits divergence with price, then a correction should be expected. At this stage, there is no divergence.
Stochastics is not extreme. There is room for price to rise. Stochastics does exhibit divergence with price today, but this is not always reliable. In conjunction with the breakout above 18.00 this may support the idea of a little downwards movement to find support and to resolve this divergence.
This analysis is published @ 03:15 a.m. EST on 30th June, 2016.
Lara,
Does it look like minor 3 is over at 21.21 or is that just minute 3? Any fibonacci relationship at 21.21? That was quite the move by silver, definitely looked like a wave 3!
Thanks.