
The channel was breached, but price thereafter made another new high. Now the channel is breached again, this time by clearer downwards movement.
Summary: This week Oil looks clear. Price has turned and now confidence may be had in a downwards trend to last weeks if not months. The target range is 26.06 to 16.33.
New updates to this analysis are in bold
MONTHLY ELLIOTT WAVE COUNT
Click chart to enlarge.
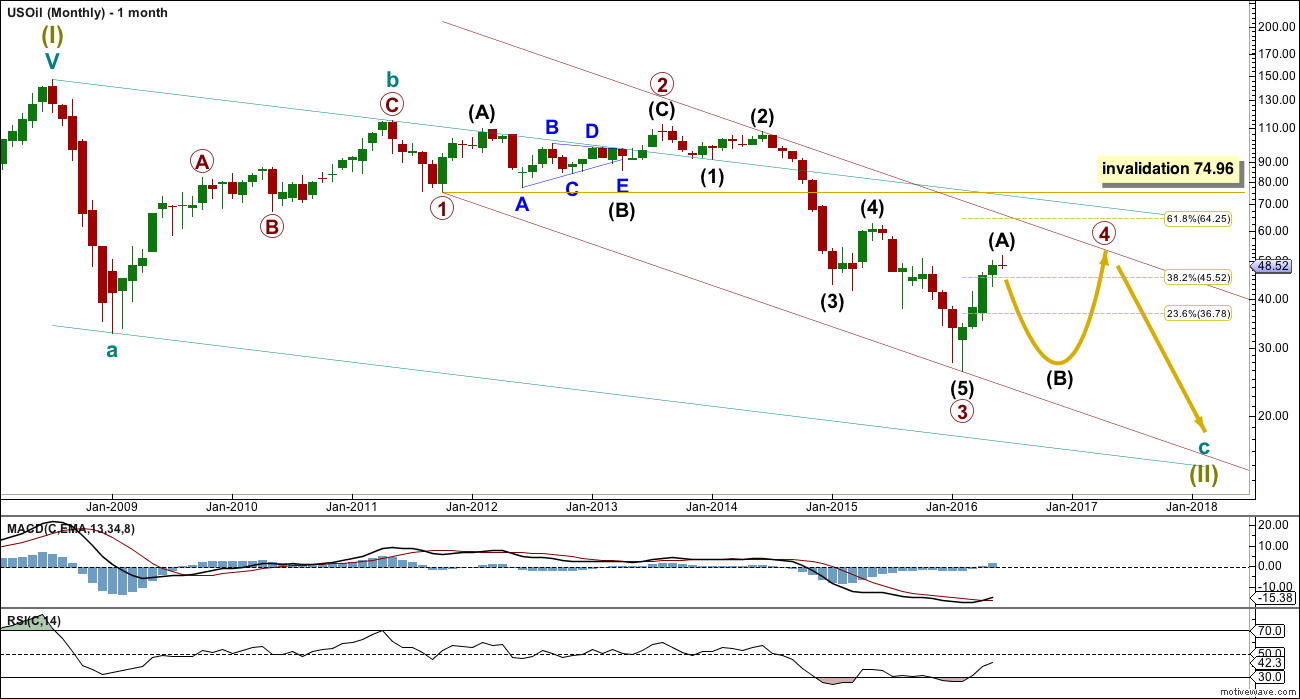
Within the bear market, cycle wave b is seen as ending in May 2011. Thereafter, a five wave structure downwards for cycle wave c begins.
Primary wave 1 is a short impulse lasting five months. Primary wave 2 is a very deep 0.94 zigzag lasting 22 months. Primary wave 3 is a complete impulse with no Fibonacci ratio to primary wave 1. It lasted 30 months.
Primary wave 4 is likely to exhibit alternation with primary wave 2. Primary wave 4 is most likely to be a flat, combination or triangle. Within all of these types of structures, the first movement subdivides as a three.
Primary wave 4 is likely to end within the price territory of the fourth wave of one lesser degree; intermediate wave (4) has its range from 42.03 to 62.58.
Primary wave 4 may end if price comes up to touch the upper edge of the maroon channel. The upper edge of this channel has been pushed up to sit on the end of intermediate wave (2) within primary wave 3.
Primary wave 4 is most likely to be shallow to exhibit alternation in depth with primary wave 2. So far it has passed the 0.382 Fibonacci ratio at 45.52. It may now move mostly sideways in a large range.
Primary wave 4 may not move into primary wave 1 price territory above 74.96.
DAILY ELLIOTT WAVE COUNT
Click chart to enlarge.
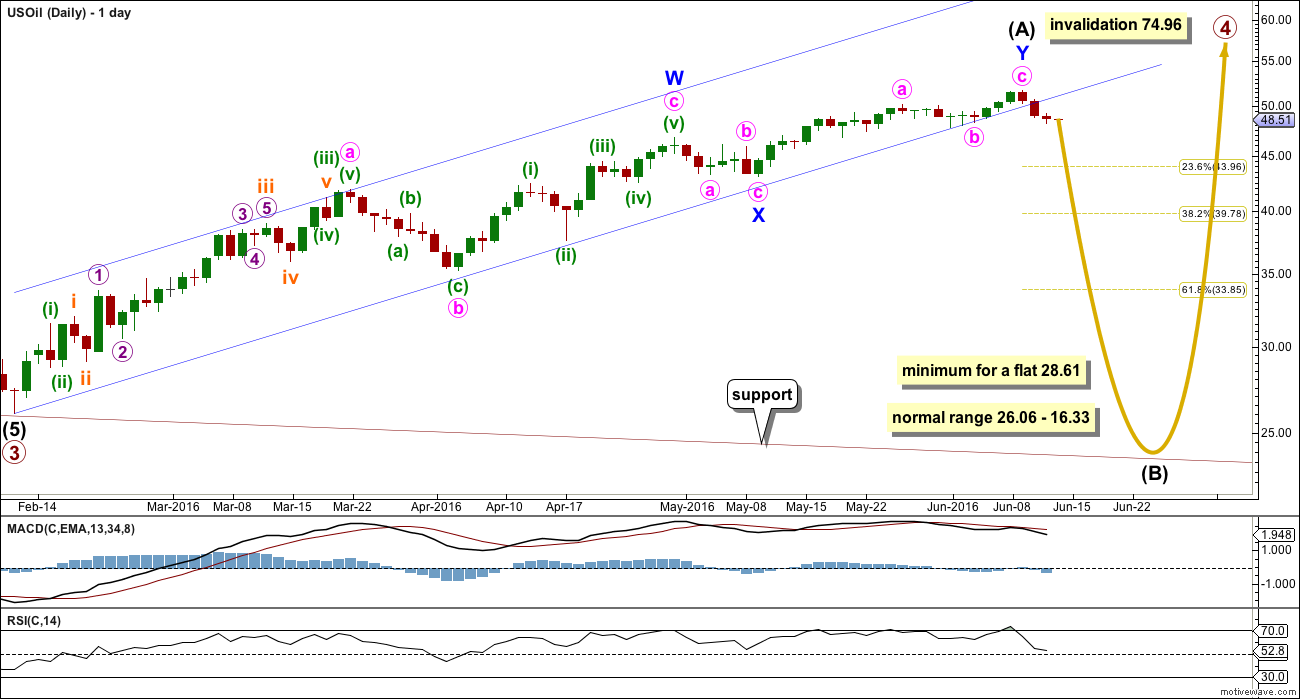
Intermediate wave (A) looks like it may be complete as a double zigzag. The best fit channel about intermediate wave (A) has now been breached by downwards movement. This may indicate a trend change.
Price breached the channel as it was drawn in last week’s analysis. However, this was followed by a new high which invalidated the equivalent of this wave count last week. Intermediate wave (A) moved higher.
The channel is redrawn as a best fit to be more conservative. Downwards movement from the last high looks decisive, RSI is overbought, so it looks like there is now a high in place for Oil.
If intermediate wave (A) is a three, then intermediate wave (B) is most likely to be a very deep correction. It may make a new low below the start of intermediate wave (A) at 26.06.
If primary wave 4 is to be a flat correction, then intermediate wave (B) must be a minimum 0.9 length of intermediate wave (A) at 28.61. The normal range for intermediate wave (B) would be 1 to 1.38 the length of intermediate wave (A) at 26.06 to 16.33.
If primary wave 4 is to be an expanded flat correction, then intermediate wave (B) should be 1.05 the length of intermediate wave (A) or longer, at 24.78.
If primary wave 4 is to be a triangle, then intermediate wave (B) has no minimum nor maximum. It must only subdivide as a three wave structure. It may make a new low below the start of intermediate wave (A) at 26.06 as in a running triangle.
Primary wave 4 may not move into primary wave 1 price territory above 74.96.
ALTERNATE DAILY ELLIOTT WAVE COUNT
Click chart to enlarge.
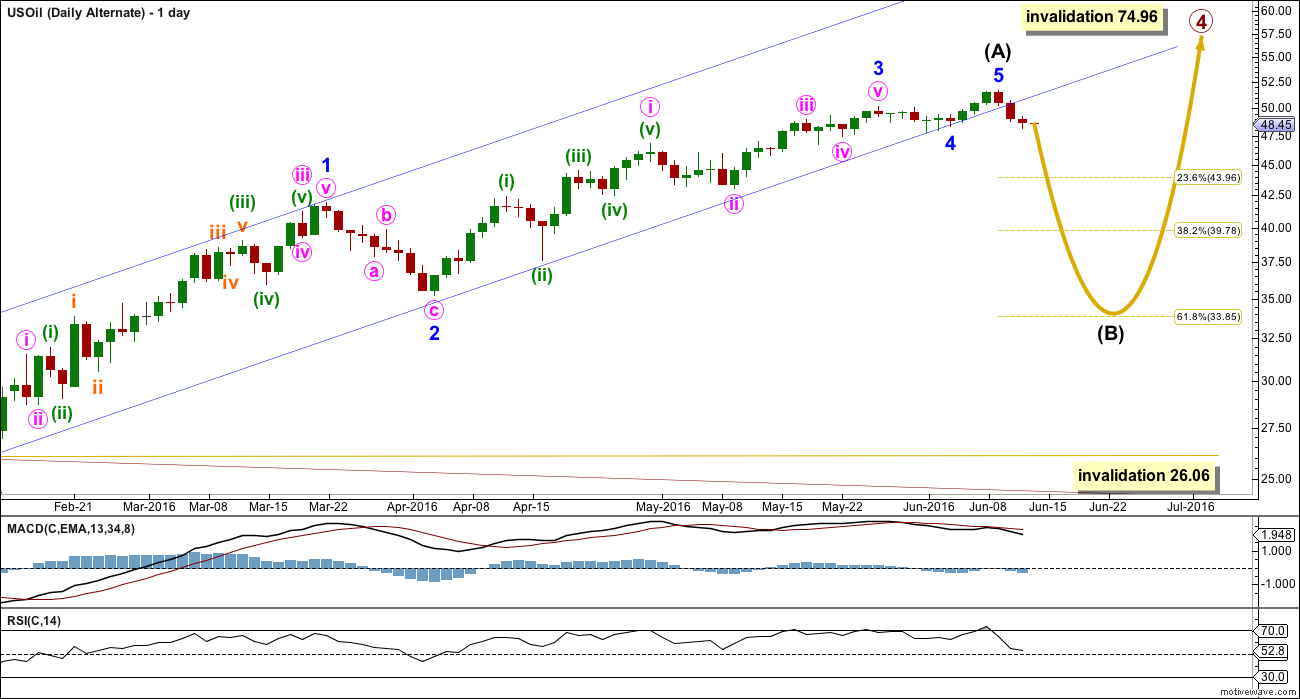
It is still possible that primary wave 4 could be a zigzag, but the probability is low because this would see no structural alternation between primary waves 4 and 2. Low probability does not mean no probability, so this alternate must be accepted as possible.
If primary wave 4 unfolds as a zigzag, then intermediate wave (A) within it must unfold as a five wave structure; it may be a complete impulse.
Within the impulse, minor wave 3 may have ended just 0.88 short of equality in length with minor wave 1. Minor wave 5 is just 0.18 short of 0.236 the length of minor wave 3.
If intermediate wave (A) is a five wave structure, then intermediate wave (B) may not make a new low below its start at 26.06.
Targets for intermediate wave (B) would be the 0.382 and 0.618 Fibonacci ratios of intermediate wave (A) at 39.78 and 33.85.
TECHNICAL ANALYSIS
MONTHLY CHART
Click chart to enlarge. Chart courtesy of StockCharts.com.
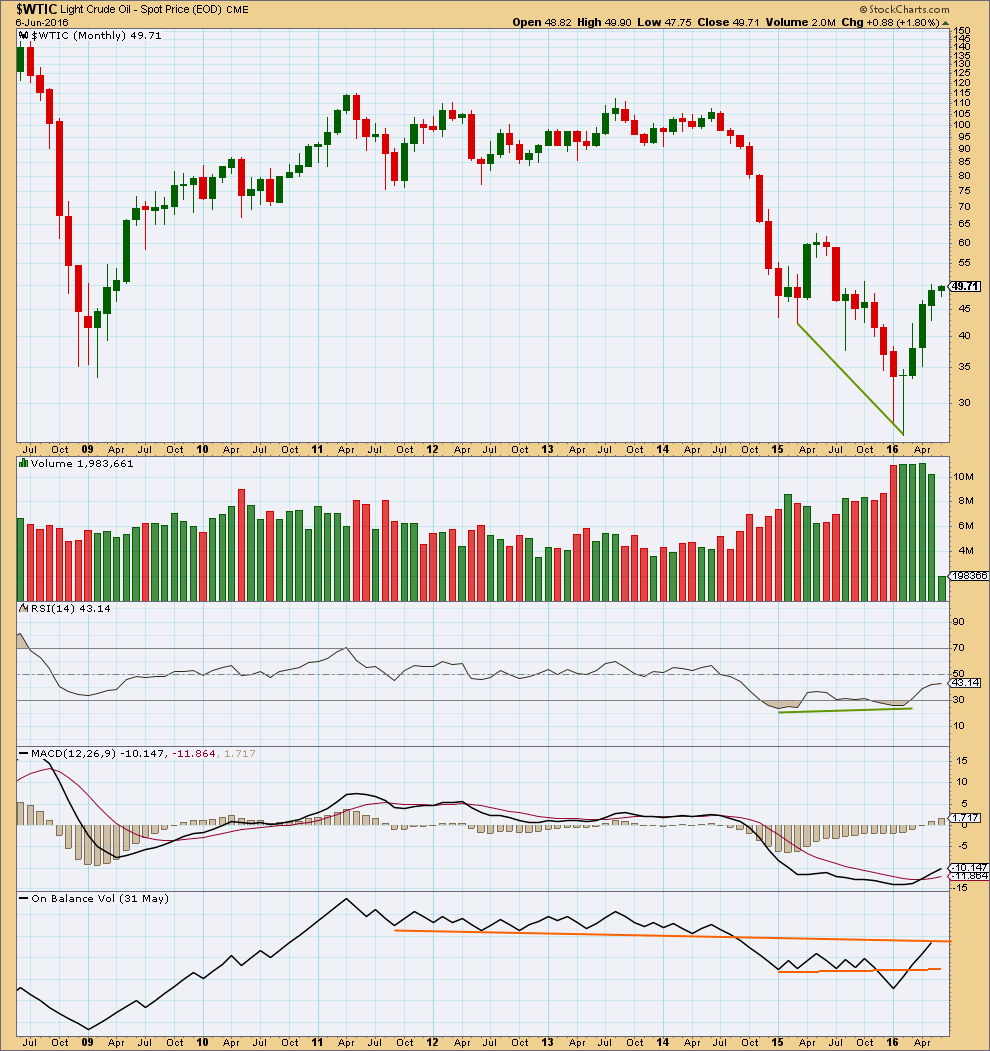
The month of May shows a decline in range and volume. This supports the idea of a mid term high in place. A pullback from here seems reasonable.
On Balance Volume may assist to hold price about here. It has come up to find resistance at the upper line.
DAILY CHART
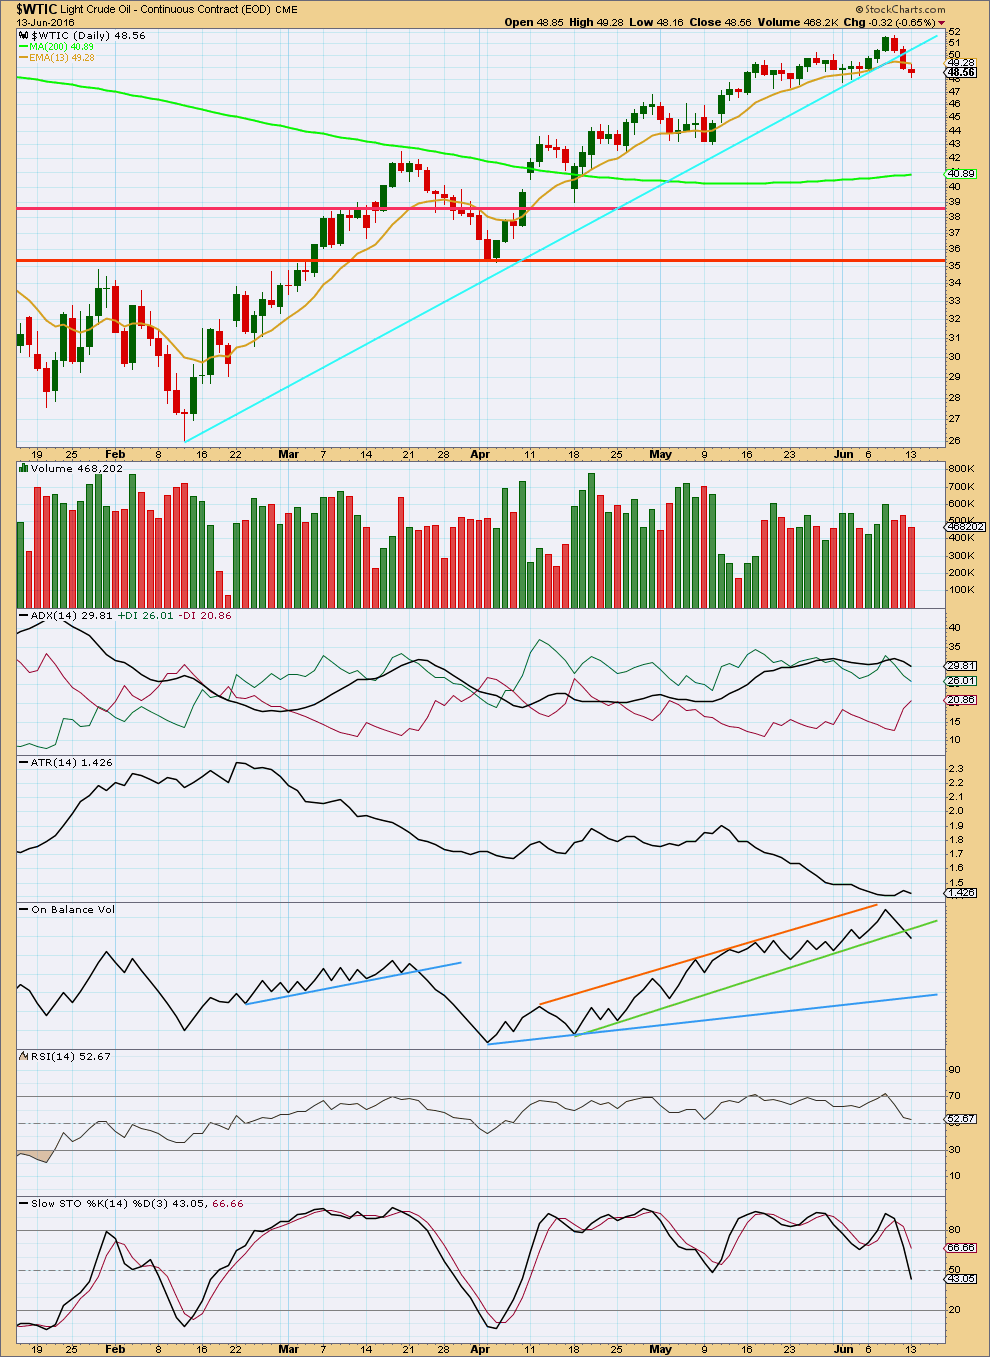
Click chart to enlarge. Chart courtesy of StockCharts.com.
The cyan trend line is slightly redrawn. It is again breached giving some confidence in a new downwards trend.
Price has just printed a full daily candlestick below the 13 day moving average giving further confidence in a trend change.
ADX is declining indicating no clear trend at this time. ATR is flat to declining. Both these indicators are lagging as they are based on a 14 day average. If they again come to agreement that there is a trend, then more confidence may be had.
On Balance Volume today is giving a bearish signal with a break below the green trend line. OBV breaks of trend lines are usually reliable, so this supports the Elliott wave count.
At the last high, RSI finally reached overbought and has turned down. This also supports the Elliott wave count. RSI may be expected to continue now to move lower until it reaches oversold. When it gets there, if the wave structure is complete, then a low may be in place. If not, then RSI may exhibit divergence with price before a low is in place. For now there is plenty of room for price to fall.
Stochastics is returning from overbought; it exhibited divergence with price at the high. This also supports the Elliott wave count.
This analysis is published @ 07:17 p.m. EST.
Looks like oil is getting crushed!!! Shorted oil about 4 days ago, looking good so far!
Lara, are we expecting a 5 wave down for the main count?
For both counts, the move down is a “b” wave, so it will likely be a 5-3-5 for an overall 3 wave down. Good luck with your trade.
Thanks dreamer, hopefully the main count plays out.