
The channel is breached.
So far price has not made a new high after the breach.
Summary: Downwards movement looks most likely from here for several weeks. The target range is 26.06 to 16.88.
New updates to this analysis are in bold
MONTHLY ELLIOTT WAVE COUNT
Click chart to enlarge.
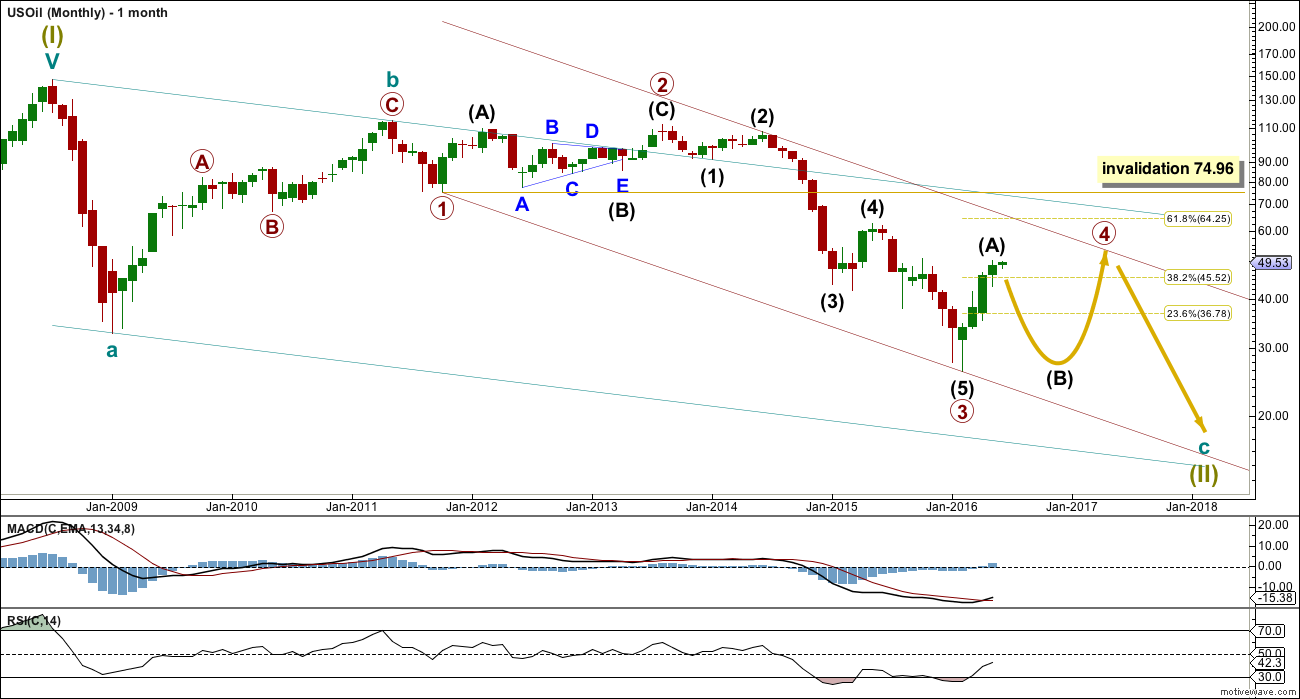
Within the bear market, cycle wave b is seen as ending in May 2011. Thereafter, a five wave structure downwards for cycle wave c begins.
Primary wave 1 is a short impulse lasting five months. Primary wave 2 is a very deep 0.94 zigzag lasting 22 months. Primary wave 3 is a complete impulse with no Fibonacci ratio to primary wave 1. It lasted 30 months.
Primary wave 4 is likely to exhibit alternation with primary wave 2. Primary wave 4 is most likely to be a flat, combination or triangle. Within all of these types of structures, the first movement subdivides as a three.
Primary wave 4 is likely to end within the price territory of the fourth wave of one lesser degree; intermediate wave (4) has its range from 42.03 to 62.58.
Primary wave 4 may end if price comes up to touch the upper edge of the maroon channel. The upper edge of this channel has been pushed up to sit on the end of intermediate wave (2) within primary wave 3.
Primary wave 4 is most likely to be shallow to exhibit alternation in depth with primary wave 2. So far it has passed the 0.382 Fibonacci ratio at 45.52. It may now move mostly sideways in a large range.
Primary wave 4 may not move into primary wave 1 price territory above 74.96.
DAILY ELLIOTT WAVE COUNT
Click chart to enlarge.
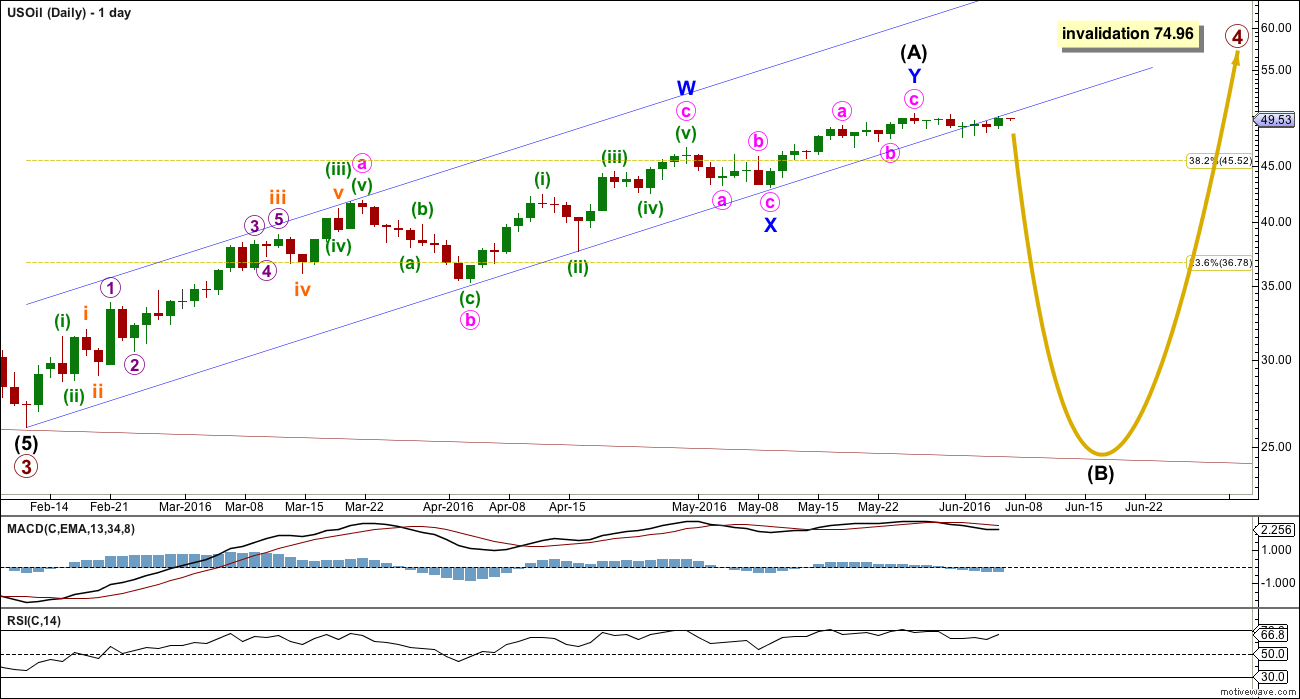
Intermediate wave (A) looks like it may be unfolding as a double zigzag. The best fit channel about intermediate wave (A) has now been breached by downwards movement. This may indicate a trend change.
Price has breached the channel and is now showing a throwback to the lower edge which is providing resistance. Within the first downwards movement of intermediate wave (B), there should not be a new high above 50.21. In the short term, a new high above this point would invalidate this wave count.
If intermediate wave (A) is a three, then intermediate wave (B) is most likely to be a very deep correction. It may make a new low below the start of intermediate wave (A) at 26.06.
If primary wave 4 is to be a flat correction, then intermediate wave (B) must be a minimum 0.9 length of intermediate wave (A) at 28.475. The normal range for intermediate wave (B) would be 1 to 1.38 the length of intermediate wave (A) at 26.06 to 16.88.
If primary wave 4 is to be an expanded flat correction, then intermediate wave (B) should be 1.05 the length of intermediate wave (A) or longer, at 24.85.
If primary wave 4 is to be a triangle, then intermediate wave (B) has no minimum nor maximum. It must only subdivide as a three wave structure. It may make a new low below the start of intermediate wave (A) at 26.06 as in a running triangle.
Primary wave 4 may not move into primary wave 1 price territory above 74.96.
ALTERNATE DAILY ELLIOTT WAVE COUNT
Click chart to enlarge.
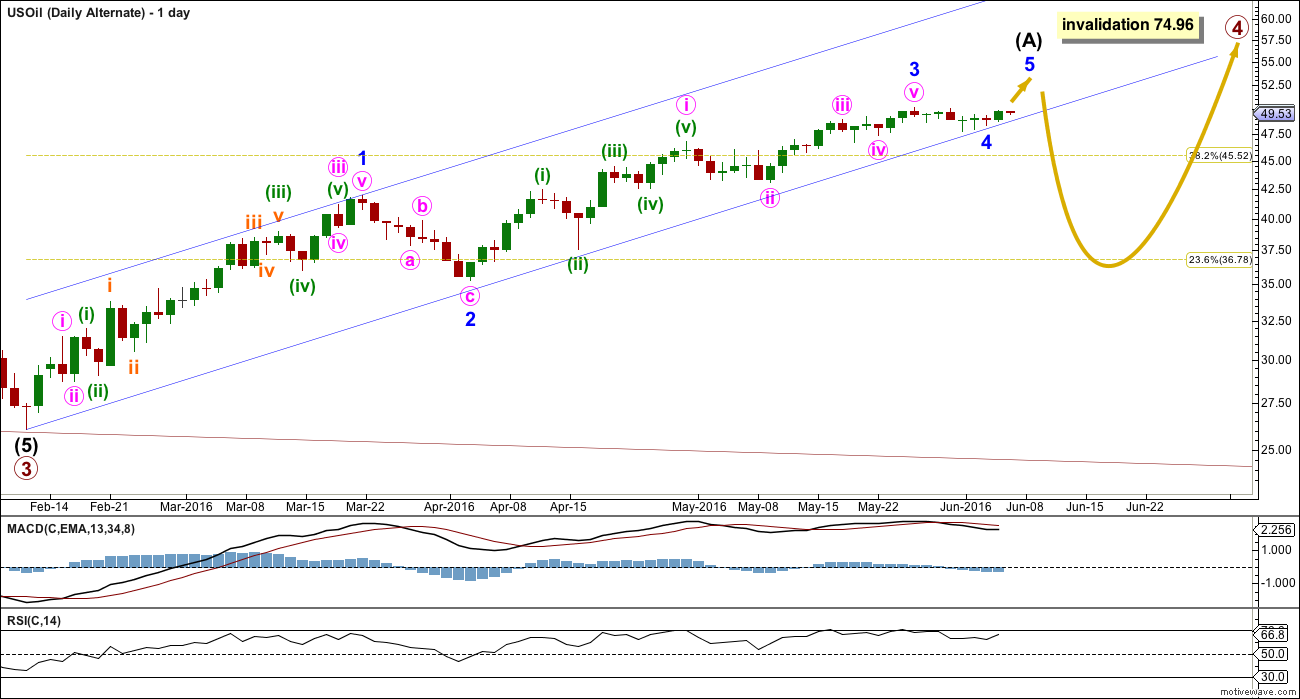
It is possible that primary wave 4 could be a zigzag, but the probability is low because this would see no structural alternation between primary waves 4 and 2. Low probability does not mean no probability, so this alternate must be accepted as possible.
If primary wave 4 unfolds as a zigzag, then intermediate wave (A) within it must unfold as a five wave structure; it may be an incomplete impulse.
Within the impulse, minor wave 3 may have ended at the last high just 0.88 short of equality in length with minor wave 1.
Here, the best fit channel is drawn slightly differently to include the recent movement labelled minor wave 4. It is possible that the channel as drawn on the main daily wave count could be breached yet price may continue higher. Channels often work to indicate trend changes, but that is not the same as always. This alternate considers the possibility that the channel may not work perfectly. Fourth waves sometimes breach channels.
Only minor wave 5 upwards would be required to complete the structure. It would most likely be short.
Thereafter, if intermediate wave (A) is a five wave structure, then intermediate wave (B) may not make a new low below its start at 26.06.
TECHNICAL ANALYSIS
MONTHLY CHART
Click chart to enlarge. Chart courtesy of StockCharts.com.
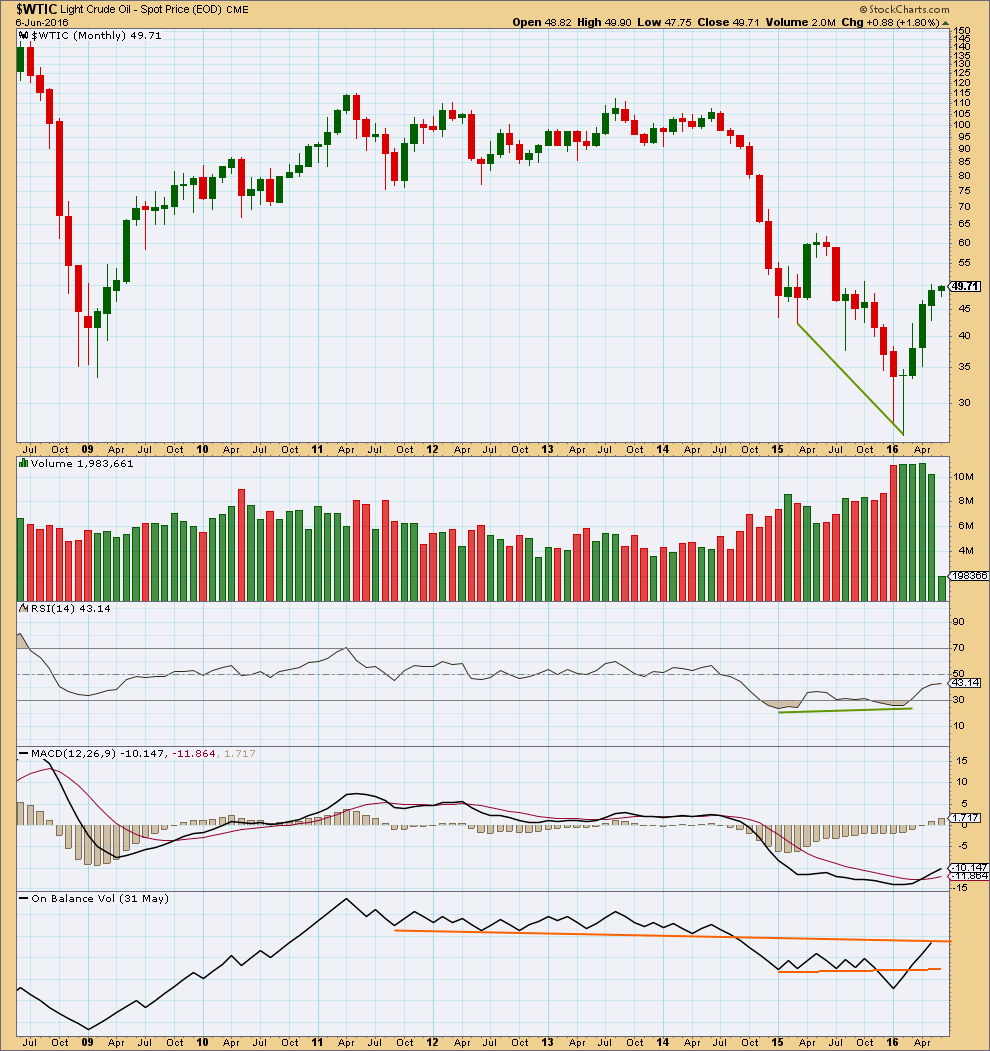
The month of May shows a decline in range and volume. This supports the idea of a mid term high in place. A pullback from here seems reasonable.
On Balance Volume may assist to hold price here. It has come up to find resistance at the upper line.
DAILY CHART
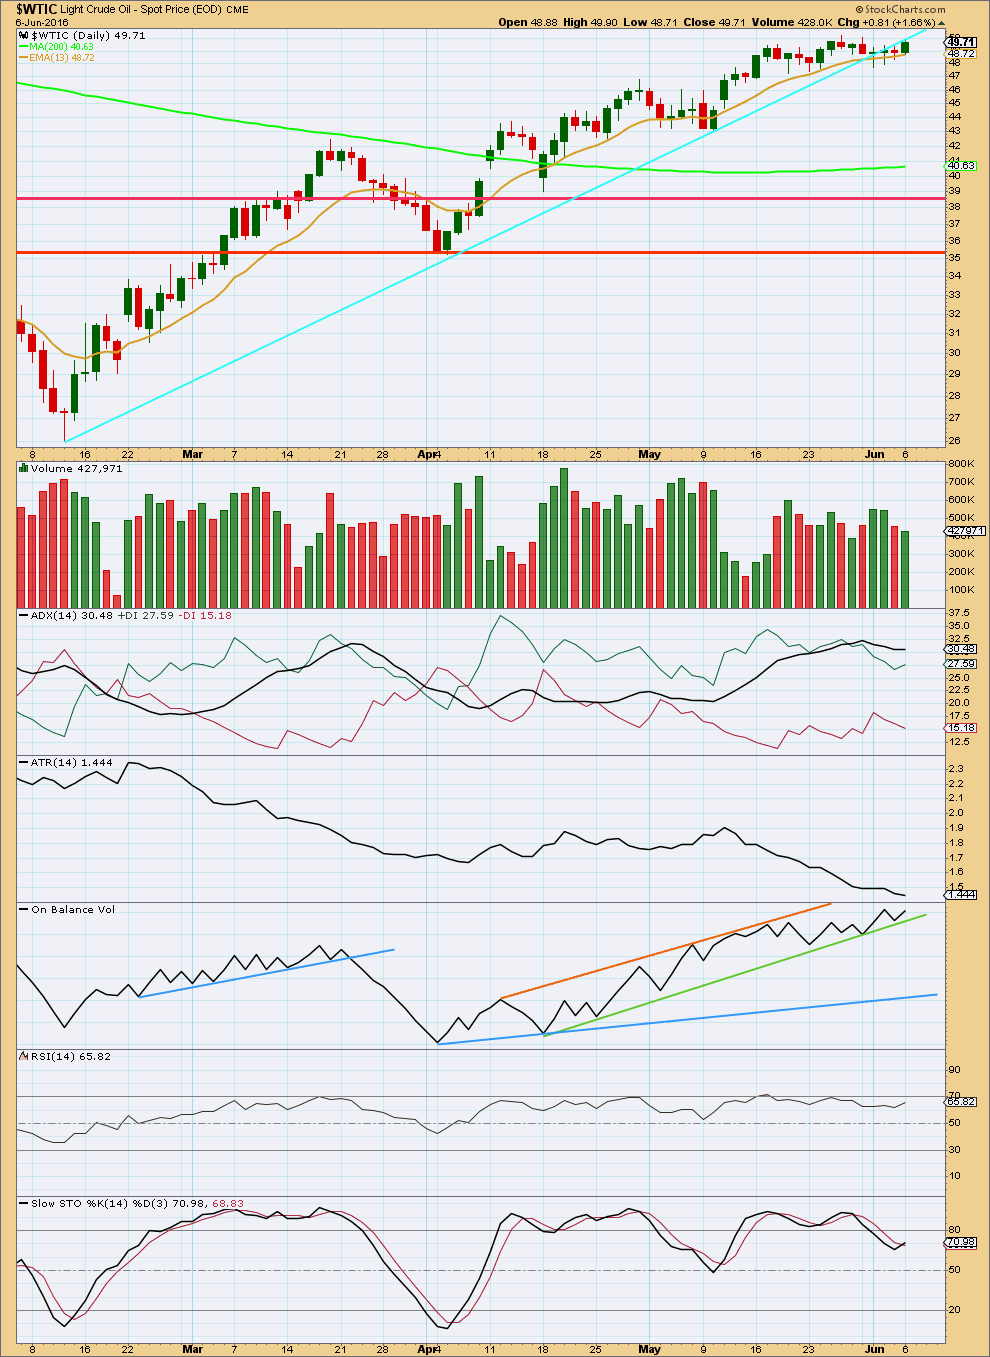
Click chart to enlarge. Chart courtesy of StockCharts.com.
The cyan trend line is breached and now provides resistance for a throwback. For the last four days, price comes on a decline in volume as price moved slowly higher. This movement looks so far like a small counter trend movement.
ADX is no longer indicating an upwards trend is in place as it is declining. ATR agrees as it too is declining. With these two in agreement, it must be accepted that the market is most likely no longer trending upwards.
On Balance Volume is giving no warning of the next direction for price. If OBV breaks below the green trend line, it would offer a weak bearish signal.
There is no divergence with price and RSI to indicate weakness. RSI has not yet reached overbought. There is room yet for price to rise further.
If the market is now range bound as ADX and ATR suggest, then Stochastics would be indicating a downwards swing to continue from here to reach support. The downwards swing may only end when price finds support and Stochastics reaches oversold at the same time.
This analysis is published @ 12:38 a.m. EST on 7th June, 2016.
Oil may have topped for now. Chart by SurfCity
Main daily Elliott wave count has invalidated.
Seasonality seems to support the call for a pullback in June