
A five up completed and is being followed by a three down. The daily Elliott wave count and targets remain the same.
Summary: The trend is up. Corrections present an opportunity to join the trend. Expect upwards momentum to increase this week. The target for this third wave to end remains at 1,582. The middle of it may end about 1,463, but the correction after the middle may be brief and shallow.
New updates to this analysis are in bold.
Last weekly chart can be found here.
Grand SuperCycle analysis is here.
DAILY ELLIOTT WAVE COUNT
Click chart to enlarge.
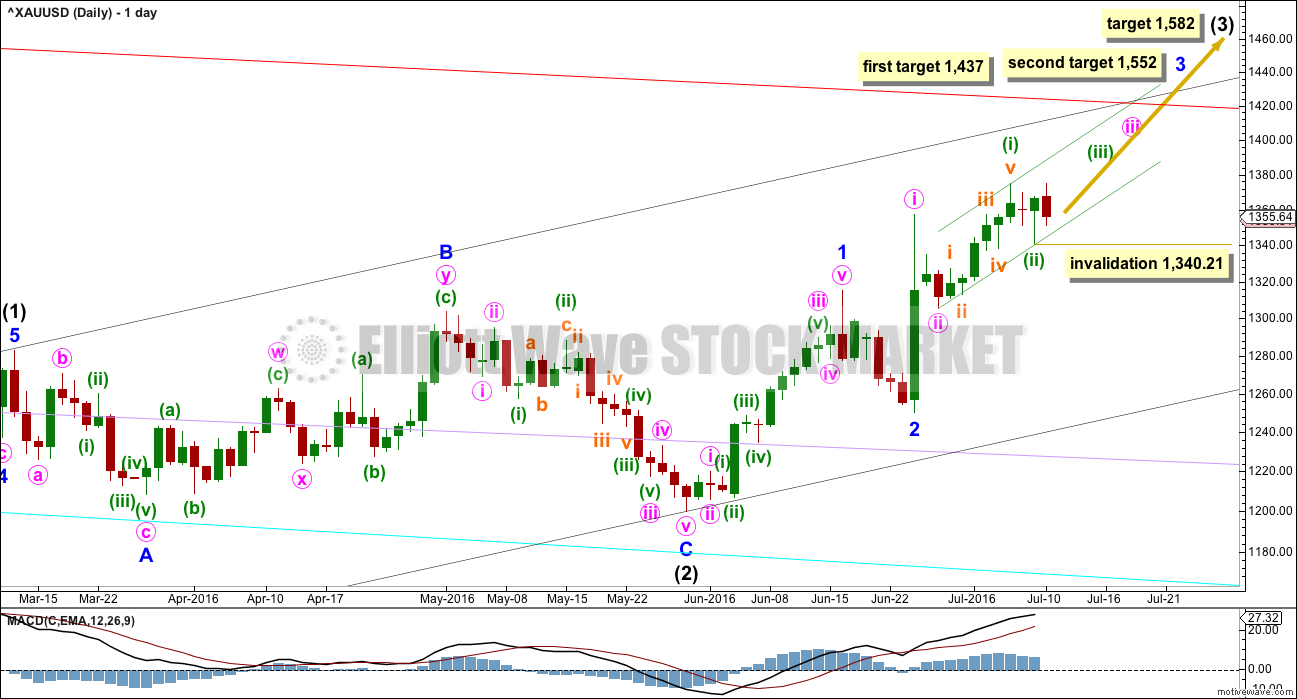
Intermediate wave (2) is a complete expanded flat correction. It is a shallow 0.350 correction of intermediate wave (1) lasting 56 days, just one more than a Fibonacci 55. There is no Fibonacci ratio between minor waves A and C. Minor wave C is a complete impulse.
Minor wave 2 may have been a quick, deep 0.57 zigzag over in just six sessions.
When minor wave 3 is complete, then the following correction for minor wave 4 may be relatively brief and shallow. Intermediate wave (3) may end with a strong blowoff top typical of commodities. This may pull minor wave 4 up forcing it to be over very quickly. For position traders, the target of intermediate wave (3) may be more useful than a target for minor wave 3.
Add a base channel (black lines) to intermediate waves (1) and (2). Draw the first trend line from the low at 1,046.27 on 3rd December, 2015, to the low labelled intermediate wave (2), then place a parallel copy on the high of intermediate wave (1). Along the way up, downwards corrections should find support at the lower edge of the base channel, if they get that low. At this stage, it looks like corrections are shallow and may not reach back down to the base channel. When intermediate wave (3) moves towards the middle, it should break above resistance at the upper edge of the base channel. When that trend line is breached, then it may offer support. A break above a base channel confirms a third wave up.
Within minute wave iii, no second wave correction may move beyond its start below 1,305.59.
At 1,582 intermediate wave (3) would reach 1.618 the length of intermediate wave (1).
Minor wave 3 has begun and may only subdivide as an impulse. At 1,437 minor wave 3 would reach 1.618 the length of minor wave 1. If when price gets to this first target the structure is incomplete, or if price keeps rising through this first target, then the second target would be used. At 1,552 minor wave 3 would reach 2.618 the length of minor wave 1.
Draw a base channel now about minuette waves (i) and (ii) (shown in green). Copy it over to the hourly chart.
Cyan, lilac and now red trend lines are copied over from the weekly chart. These are longer term lines which may offer support / resistance. Weekly and daily charts are on a semi-log scale.
Intermediate wave (1) lasted 71 days (not a Fibonacci number) and intermediate wave (2) lasted 56 days (one more than a Fibonacci 55). Intermediate wave (3) should be expected to be longer in length and duration than intermediate wave (1). An early expectation may be for it to total a Fibonacci 89 days. So far it has lasted 31 days.
MAIN HOURLY ELLIOTT WAVE COUNT
Click chart to enlarge.
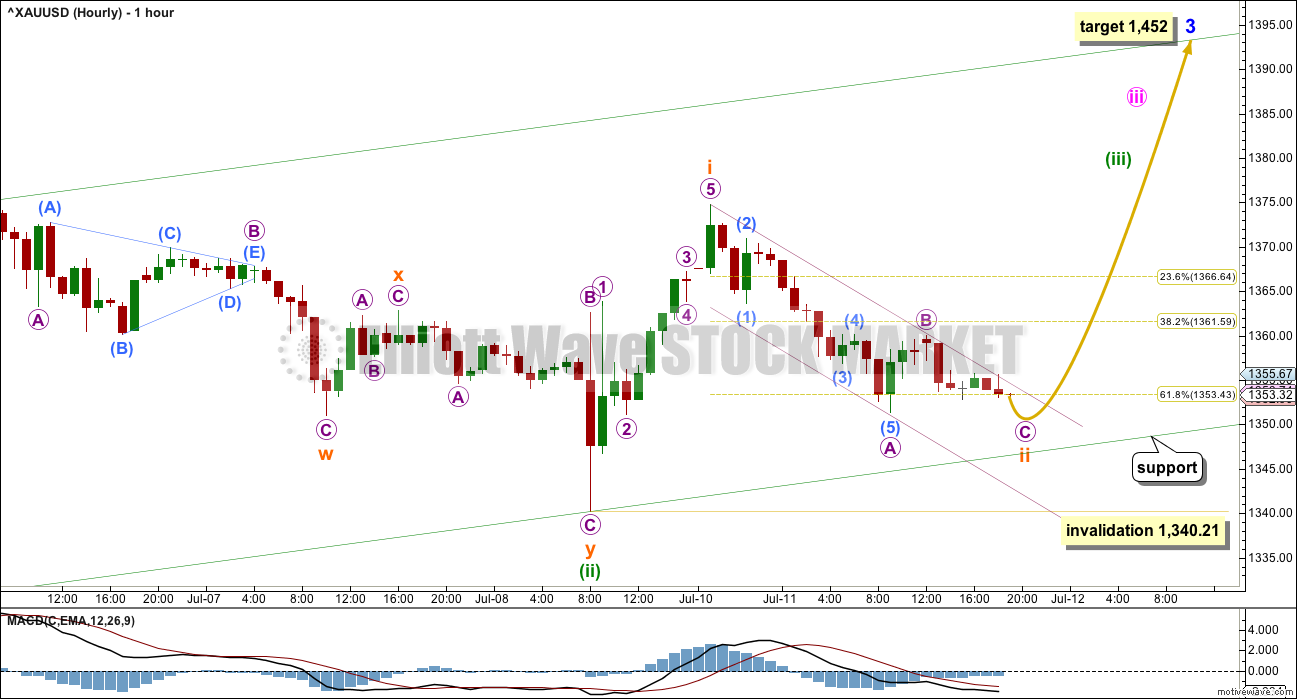
Both hourly wave counts today see subminuette wave i complete. The only question at this stage is whether or not subminuette wave ii is complete.
Ratios within subminuette wave i are: micro wave 3 is 1.5 longer than 0.618 the length of micro wave 1, and micro wave 5 is 1.01 longer than 0.618 the length of micro wave 3. The COMEX data I am using for the Gold cash market has the high for micro wave 1 at 1,363.83 and the low for micro wave 4 at 1,363.85, so there is no overlap.
So far subminuette wave ii remains contained within the small channel about it. The expectation should be for subminuette wave ii to continue while price remains within this channel.
So far within subminuette wave ii downwards movement to the low for Monday subdivides best as a five wave structure. This may only be micro wave A of a zigzag. At 1,351 micro wave C would reach 0.382 the length of micro wave A. As soon as micro wave C has made a new low below the end of micro wave A at 1,351.32 avoiding a truncation, then it may be over.
If price continues lower, then look for strong support at the lower edge of the green base channel.
When subminuette wave ii is confirmed as complete for this main hourly wave count, then a target may be calculated for subminuette wave iii. The expectation would be for subminuette wave iii to be 2.618 the length of subminuette wave i which would see it 90.58 in length.
Subminuette wave ii may not move beyond the start of subminuette wave i below 1,340.21.
ALTERNATE HOURLY ELLIOTT WAVE COUNT
Click chart to enlarge.
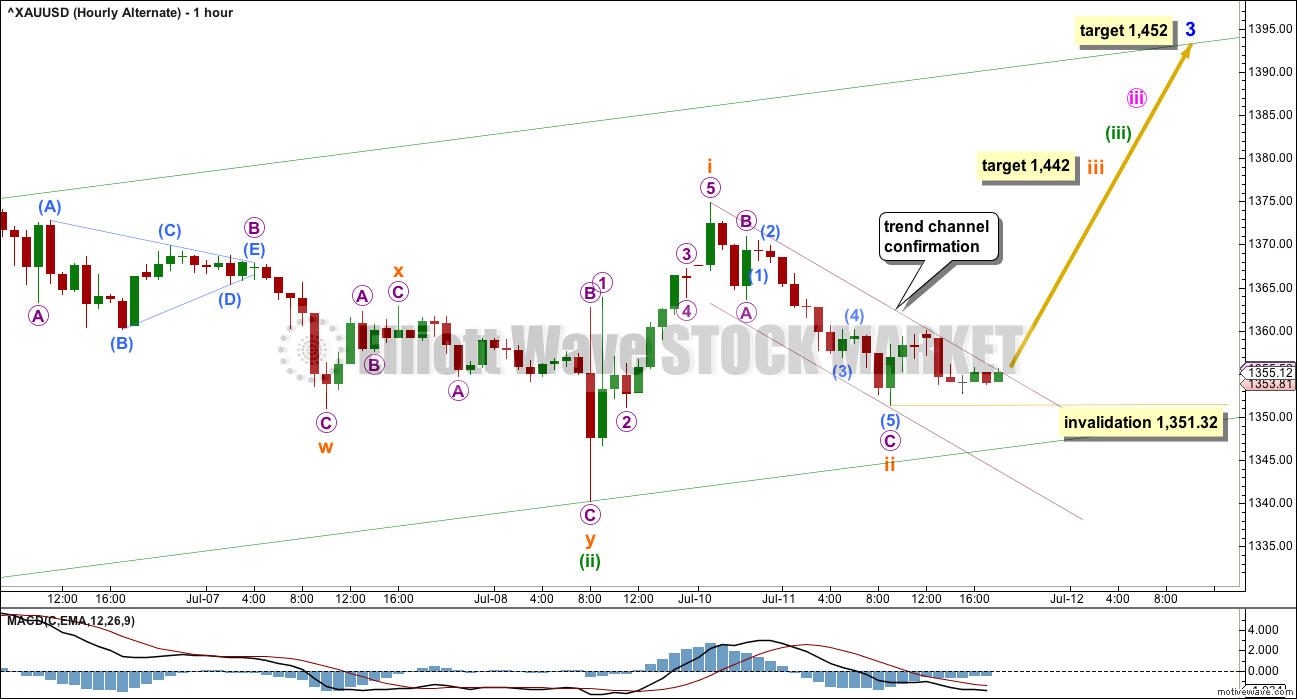
It is possible that subminuette wave ii is complete, but this idea must remain an alternate while price remains contained within the channel. It requires some indication, which may be likely by a breach of the upper edge of the small downwards sloping channel.
If subminuette wave ii is complete, then within it micro wave C does not look like a very good five wave structure. This wave count looks forced trying to see what looks like a five down as a three. For this reason also today it must be an alternate.
At 1,442 subminuette wave iii would reach 2.618 the length of subminuette wave i.
Subminuette wave iii should show strong volume, an increase in momentum, and bring indicators into extreme for several days.
Within subminuette wave iii, no second wave correction may move beyond its start below 1,351.32.
TECHNICAL ANALYSIS
DAILY CHART
Click chart to enlarge.
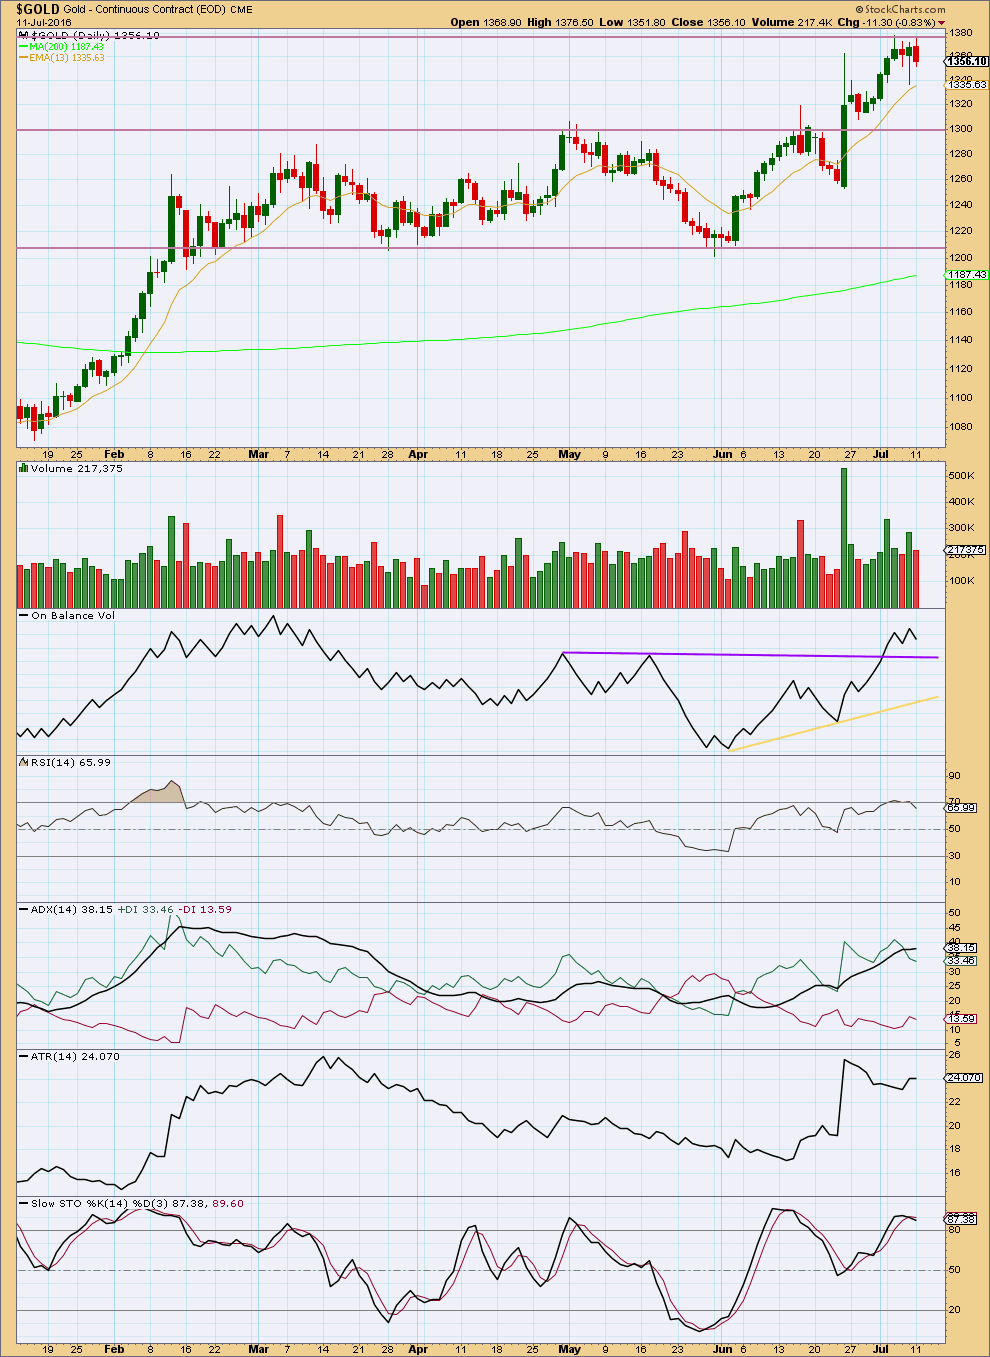
Price continues to find resistance at the upper horizontal line about 1,365. If price breaks above this line, then thereafter look for support there.
Monday’s downwards day was not supported by volume. The volume profile remains bullish. Price comes with increased volume as price rises. Price comes with lighter volume as price falls.
On Balance Volume remains bullish above the purple line.
Monday’s downwards day has brought RSI down from extreme. There is again room for price to rise.
ADX still indicates an upwards trend is in place. ADX is extreme above 35, but it can remain extreme for several days during strong trends for Gold.
ATR is overall flat to declining, and not in agreement with ADX at this time. If ATR turns upwards again, then more confidence may be had in an upwards trend.
For now it seems fairly clear that Gold is most likely still in an upwards trend. Price should be expected to find support about the 13 day moving average.
This analysis is published @ 08:00 p.m. EST.
Hi Lara, this is a German EW technician I’ve been following. He suggested gold is on its way to complete either W2 or B. It’s a different perspective for you and other members to consider. I appreciate your charting works.
Without seeing how he labels the prior bear market I can’t fit this into a larger picture. I suspect he’s got that wave count where the ending diagonal to the low at 1,046 on 3rd December 2015 began in June 2014, and so violates a rule for wave lengths.
If he’s seeing that bear market as an impulse. Which means he could be seeing the rise up from December 2015 as a second wave.
Anyway, from what I see on this chart he’s seeing an expanding triangle for a fourth wave? counterpart to a second wave back down in December 17th 2015. The second wave would have lasted 9 days. Now the fourth wave counterpart would have lasted 51 days and it’s still got wave D to finish, then wave E downwards.
The proportions are horrible. And that’s the rarest EW structure of all.
So I would judge that wave count to have a very low probability indeed.
But, to be fair, I may be misreading it. I am finding his labels really hard to understand. It’s all muddled up… I can’t see his idea very clearly in EW terms.
Hi Lara, thanks for your review. I agree that his work is quite confused sometimes. 🙂
This is either minuette (ii) moving lower, now just below the 0.618 Fibonacci ratio, or it may also be minor 2 continuing. I have to chart that idea and look more closely at it.
For now it looks like this downwards movement is very close to being over with a final small fifth wave. It looks like a typical blowoff at the last low as downwards movement was stronger there than prior hours.
Hourly volume data suggests at least one more low though; if the low was in then the last two green hourly candlesticks should have been stronger. They’re too weak. Not enough buying power yet.
A possible target would be 1,319 where subminuette c = 1.618 X subminuette a. But that looks too low considering the strength of current downwards movement.
3:26pm Dollar logs largest 2-day gain against yen since November 2014
That would be bearish gold.
Looks like I picked a heck of a week to join this site!
Yes, you did 🙁
Anyway, a very warm welcome from all of us here.
Im waiting for an overnight rally which gold usually does in the 3rd waves…i dont have much of the experience but i have seen it frequently…whether its a bearish or a bullish market…3rd waves tend to show power in the absence of future market and surprise everyone
Is gold from the 12:36 pm low today of 1330.43 finally just now starting a 5th wave up now at 2:19 pm I really hope so?
Lara..
As the daily got invalidated…does this mean that the next invalidation wil be 1305.55 and we are still about to end a correction for minutte wave 2..??
If this is correct than the 3rd wave will increase its target range…as 1450 looks small than…
Yes. 1,305.55 is the next invalidation for minuette (ii).
Yes, the target will be recalculated. It may be higher.
Gold low at 1,330.43 at 12:36 pm.
NUGT at 12:36 dropped to 154.11 then dropped again
NUGT low at 1:38 at 152.25
GDX is breaking it’s uptrend line. A move below 29.4 would likely confirm that Minor 3 is over and we are in a multi day correction for Minor 4.
Dreamer, it seems GDX would likely to fins support on either 10sma or 20sma.
Lara,
How likely is it that July 06,2016 top at 1375.05 was only an Intermediate (1) top and now correcting deep in Intermediate (2) down to 1210 or so? The way we have it on daily chart is very shallow less than 38%? Just a thought for now….
I’d rather have an alternate for minor 2 continuing as an expanded flat.
But as for the idea of intermediate (2) continuing, I will look at if it could work.
Looking at this idea in more detail, it doesn’t work.
While I can make the subdivisions fit, the problem is that from the low of 30th of May to the high of 11th July, that upwards wave is 2.11 X the length of the prior downwards wave after the end of intermediate wave (1).
What that means is, if intermediate (2) is still continuing it would be an expanded flat, or double flat, or double combination.
Within a flat when the possible B wave is longer than 2X the length of the possible A wave the idea should be discarded due to exceptionally low probability.
That is now the case with this idea. So I won’t publish it.
What I will be publishing as an alternate today is the idea of minor 2 continuing lower. That has more merit.
The problem here is that too many alternates see us afraid to jump in and join the trend. When Gold’s third waves build momentum it can be hard to jump in. I don’t want us to miss out again due to alternates expecting deeper corrections which never arrive. We’ve had that before.
It’s a conundrum. I think I’ll publish the alternate… and let members decide for themselves.
In the worst case scenario of an invalidation, it means that minute 2 is an incomplete flat: 1375.26 – (1335.40) – 1375.29 – ?
I use 1335.40 because that’s what I’ve got from pmbull, not 1340.21. Hence, for me, there’s no invalidation (yet).
OK, I throw in the towel. It is the incomplete Minuette 2. (Made a mistake above, not Minute 2). At 0.618 Fib, Minuette 2 = 1332.18.
That is because Minute 3 began from 1305.55, and Minuette 1 = 1375.26.
I agree. For the bull count, Minuette 2 (green) could be morphing into a flat.
Its okay. I’ve been burning towels lately so your way ahead.
So do you think, on Lara’s hourly chart, it would look something like where minuette ii is she’ll have that as subminuette a, then the next swing high subminuette b, and wer are in subminuette c?
I reckon so. Do you mean micro a and micro b? Those with purplish capital letters circled.
hope I can upload this. Is example what I mean
Okay, so what does the invalidation REALLY mean?
In this case I think the daily count will be revised, with the targets being the same.
The hourly alternate chart is history as it was more bullish than the main hourly.
The daily and main hourly wave counts both now need to be updated.
Maybe the Technical analysis perhaps may give different signals,
such as a topping???
I’m guessing here. It might be that we’re in wave 2 still, rather than being in wave 3.
Yes. That is what I have in mind. Those are precisely the same points I posted above.
The invalidation point for Minuette 2 is now 1305.55. What a revolting development. I’m sure those of us who bought in earlier are now underwater.
Yes. I am 🙁
Need new hourly wave counts???? Gold broke below 1340.
Not on http://www.pmbull.com
it only hit low of 1340.56 at 10:04 am
In fact gold is right at the bottom edge of the hourly channel now.
It’s the invalidation for the daily count too.
Lara’s 1340.21 was 8:30 am July 8th
pmbull.com had that as 1335.40 and today’s low as 1340.56 at 10:04 am.
Definitely the hourly alternate chart is invalidated.
Does anyone know which feed Lara uses so we can confirm if invalidated?
I don’t have gold below the invalidation level, so far. I just wanted to point out that the hourly and daily charts have the same invalidation levels at this stage.
It would have to be confirmed on Lara’s feed and prices on gold price feeds varies quite a bit.
Can anyone offer a comment on what Japan stimulus (lots of talk and expectations to be released very soon) will have on the price of gold? Yen would decline, US Dollar would increase along with the Pound and other currencies, but what do you anticipate will happen to the gold price? Thank you!
Alan what if main hourly gets in validated…??..than what will be the move from 1335 of friday and high of 1375 and again this down wave will be seen as..??
My apologies. Went to eat my dinner after putting up a buy order for NUGT at the open.
No problem about invalidation. I use pmbull datafeed and the up move started at 1335.40, so that is my invalidation point. Anyway, price went lower than my expectation, and probably settled at 1340.56.
Ohh no problem…thanx for reply..
Price needs to stay above 1340.21 main hourly invalidation point.
Just one tiny wave down to complete subminuette 2. That would be submicro 5. My target is 1341.83-1341.17.
Price has now made a new low. Phew, never thought that I had need to count all the way to submicro level!
We may have seen the Wave ii low at 8:06 AM at 1345.30 in August Gold GCQs.
Cash market trades at a bit discount
Correction do often extend, new low at 1342 (GCQ) at 6:39, we wait to see if this holds?
Looks like Micro wave ((B)) morphed into a triangle, so Micro wave ((C)) should be short and fast to the downside. Although the trendline is breached, if Micro wave ((C)) is complete now, then Subminuette 2 may now be complete. Tuesday should be an up day for gold.
Thanks for sharing.
gold just slightly breached the lower green base channel. Without a significant bounce in the next 4-6 hrs, we could have a full hourly candlestick below and not touching it which means a full revision to the count.
Lara:”As soon as micro wave C has made a new low below the end of micro wave A at 1,351.32 avoiding a truncation, then it may be over.”
Gold just made low at 1351. Micro wave c may be over here.
It’s sub1350 now, less than $10 from the invalidation level.
GDX has multiple iH&S patterns. Here’s the biggest one. Chart by FullGoldCrown.
For ssandysc,
Just saw your question from last analysis. Let me know if this helps.
Thanks, Dreamer works well
GDX consolidated today, gapping down before making a new high, then dropping again before finally rallying into the close. GDX is showing strength as the pullbacks are being bought.
My main idea is shown in the chart. GDX remains bullish as it appears another small iH&S has formed, with the same 32 target as the larger one. A breakout to the upside appears imminent.
That said, there is an alternate idea that should be considered with lower probability as well. Since GDX made a new high today, Minor wave 3 could be complete and GDX could be starting a multiday correction. This idea would be seriously considered if GDX breaks the uptrend line.