
Downwards movement was unexpected and invalidated the daily Elliott wave count.
Summary: The trend is still up. Corrections are still an opportunity to join the trend. A new high above 1,340.21 would provide price confirmation that the correction is over. Prior to confirmation, it is possible that price may keep moving lower to 1,291. The long term target remains the same at 1,582.
New updates to this analysis are in bold.
Last weekly chart can be found here.
Grand SuperCycle analysis is here.
DAILY ELLIOTT WAVE COUNT
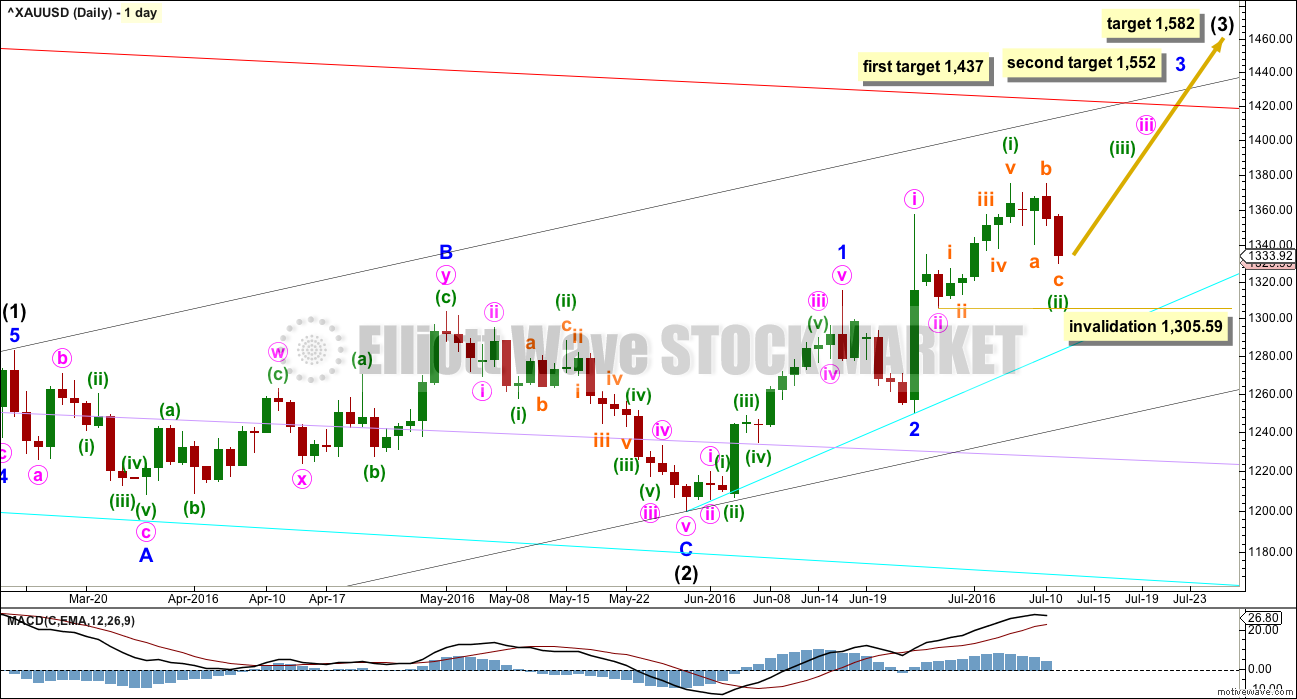
Click chart to enlarge.
Intermediate wave (2) is a complete expanded flat correction. It is a shallow 0.350 correction of intermediate wave (1) lasting 56 days, just one more than a Fibonacci 55. There is no Fibonacci ratio between minor waves A and C. Minor wave C is a complete impulse.
I have today considered the possibility that intermediate wave (2) may be continuing as a larger flat correction, a double flat or a double combination. The first structure or wave A of a larger flat would be over at the low labelled the end of intermediate wave (2). Upwards movement from that low would be wave B of a flat or wave X of a double. This upwards movement is now 2.11 the length of the prior wave down labelled intermediate wave (2). When the possible B wave of a flat is longer than twice the length of the possible A wave, then the idea has such a low probability it should be discarded. In this case, the possible B wave is now over twice the length of the possible A wave, so the idea will not be published and is discarded. There is a high probability that intermediate wave (2) is over as labelled.
Minor wave 2 may have been a quick, deep 0.57 zigzag over in just six sessions.
When minor wave 3 is complete, then the following correction for minor wave 4 may be relatively brief and shallow. Intermediate wave (3) may end with a strong blowoff top typical of commodities. This may pull minor wave 4 up forcing it to be over very quickly. For position traders, the target of intermediate wave (3) may be more useful than a target for minor wave 3.
Add a base channel (black lines) to intermediate waves (1) and (2). Draw the first trend line from the low at 1,046.27 on 3rd December, 2015, to the low labelled intermediate wave (2), then place a parallel copy on the high of intermediate wave (1). Intermediate wave (3) should break above resistance at the upper edge of the base channel. When that trend line is breached, then it may offer support. A break above a base channel confirms a third wave up.
Minuette wave (ii) may not move beyond the start of minuette wave (i) below 1,305.59.
At 1,582 intermediate wave (3) would reach 1.618 the length of intermediate wave (1).
Minor wave 3 has begun and may only subdivide as an impulse. At 1,437 minor wave 3 would reach 1.618 the length of minor wave 1. If when price gets to this first target the structure is incomplete, or if price keeps rising through this first target, then the second target would be used. At 1,552 minor wave 3 would reach 2.618 the length of minor wave 1.
Cyan, lilac and now red trend lines are copied over from the weekly chart. These are longer term lines which may offer support / resistance. Weekly and daily charts are on a semi-log scale.
Intermediate wave (1) lasted 71 days (not a Fibonacci number) and intermediate wave (2) lasted 56 days (one more than a Fibonacci 55). Intermediate wave (3) should be expected to be longer in length and duration than intermediate wave (1). An early expectation may be for it to total a Fibonacci 89 days. So far it has lasted 31 days.
MAIN HOURLY ELLIOTT WAVE COUNT
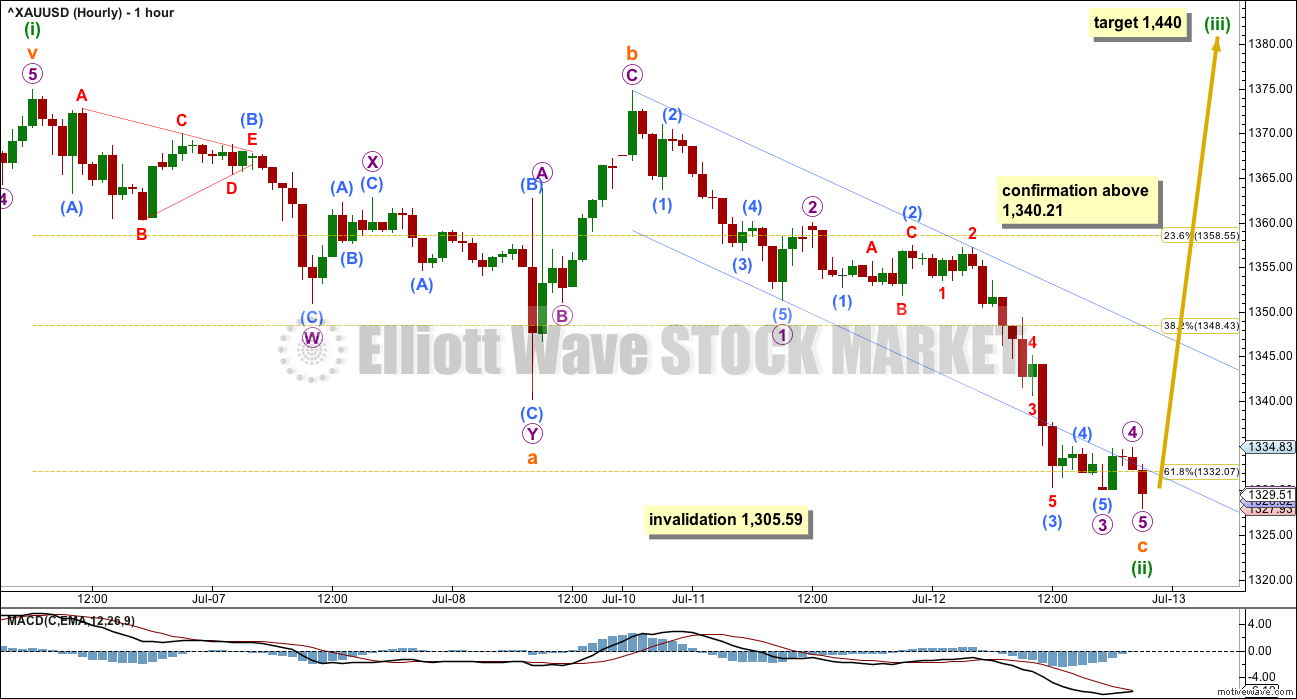
Click chart to enlarge.
Downwards movement may be a zigzag moving lower for minuette wave (ii). The structure may now be complete. With price just below the 0.618 Fibonacci ratio of minuette wave (i), if this wave count is correct, then downwards movement should be over here.
At 1,440 minuette wave (iii) would reach 1.618 the length of minuette wave (i). If minuette wave (ii) moves any lower, then this target must also move correspondingly lower.
A new high above 1,340.21 would invalidate the alternate below and provide some price confirmation of this wave count. At that stage, some confidence may be had in the upwards trend resuming.
Minuette wave (ii) here subdivides as a regular flat correction. Within
minuette wave (ii), subminuette wave a fits as a double zigzag, a three wave structure. Subminuette wave b fits as a zigzag. Subminuette wave c fits as a five wave impulse, which may now be complete. There is no Fibonacci ratio between subminuette waves a and c.
If price makes a new low below 1,305.59, then the alternate below would be confirmed.
ALTERNATE DAILY ELLIOTT WAVE COUNT
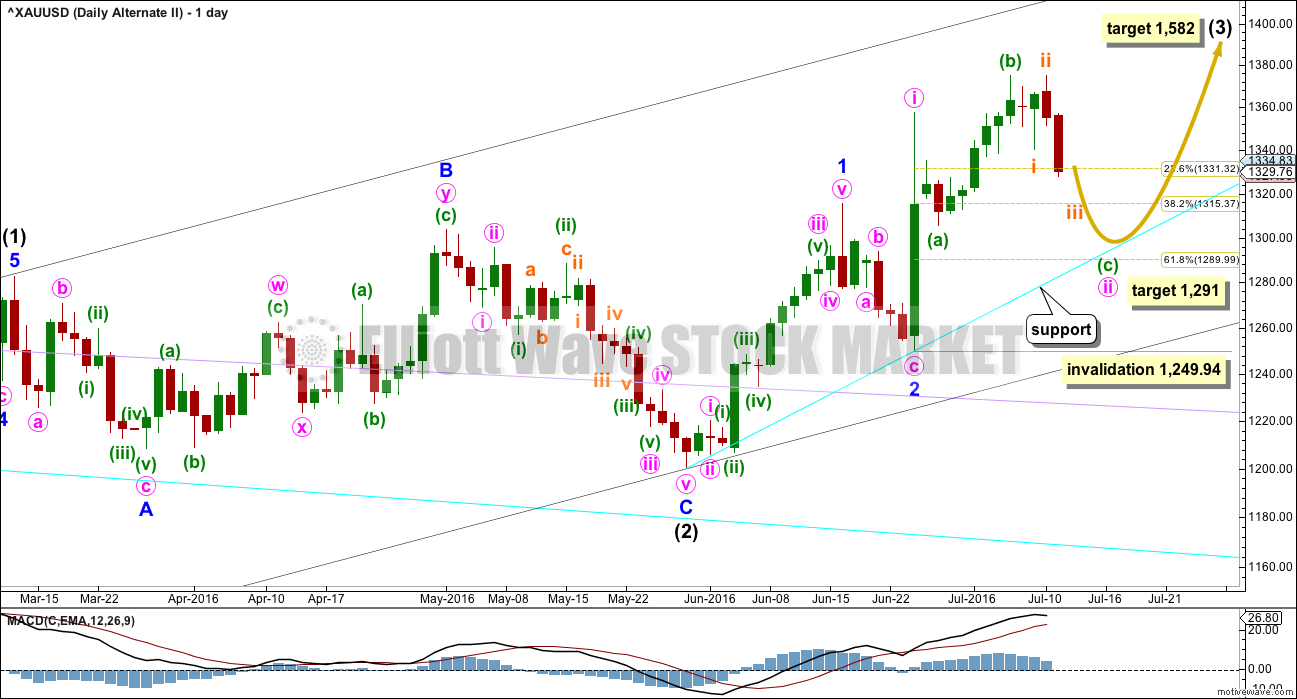
Click chart to enlarge.
This wave count is identical to the main wave count up to the high labelled minute wave i. Thereafter, it looks at the possibility that minute wave ii is not over and is continuing further as an expanded flat correction.
Within minute wave ii, minuette wave (b) is a 1.34 length of minuette wave (a), nicely within normal range for a B wave within a flat of between 1 to 1.38 the length of the A wave. This looks like a normal expanded flat, which are very common structures.
Add a support line from the start of minor wave 1 to the end of minor wave 2, drawn in cyan. If price gets down that low, then expect strong support at this line.
Minuette wave (c) would be very likely to make at least a slight new low below the end of minuette wave (a) below 1,305.59 to avoid a truncation an a very rare running flat. Minuette wave (c) must subdivide as a five wave structure.
At 1,291 minuette wave (c) would reach 1.618 the length of minuette wave (a). This target is very close to the 0.618 Fibonacci ratio of minute wave i at 1,290, so it has a good probability.
Minute wave ii may not move beyond the start of minute wave i below 1,249.94. This is the risk today to long positions.
ALTERNATE HOURLY ELLIOTT WAVE COUNT
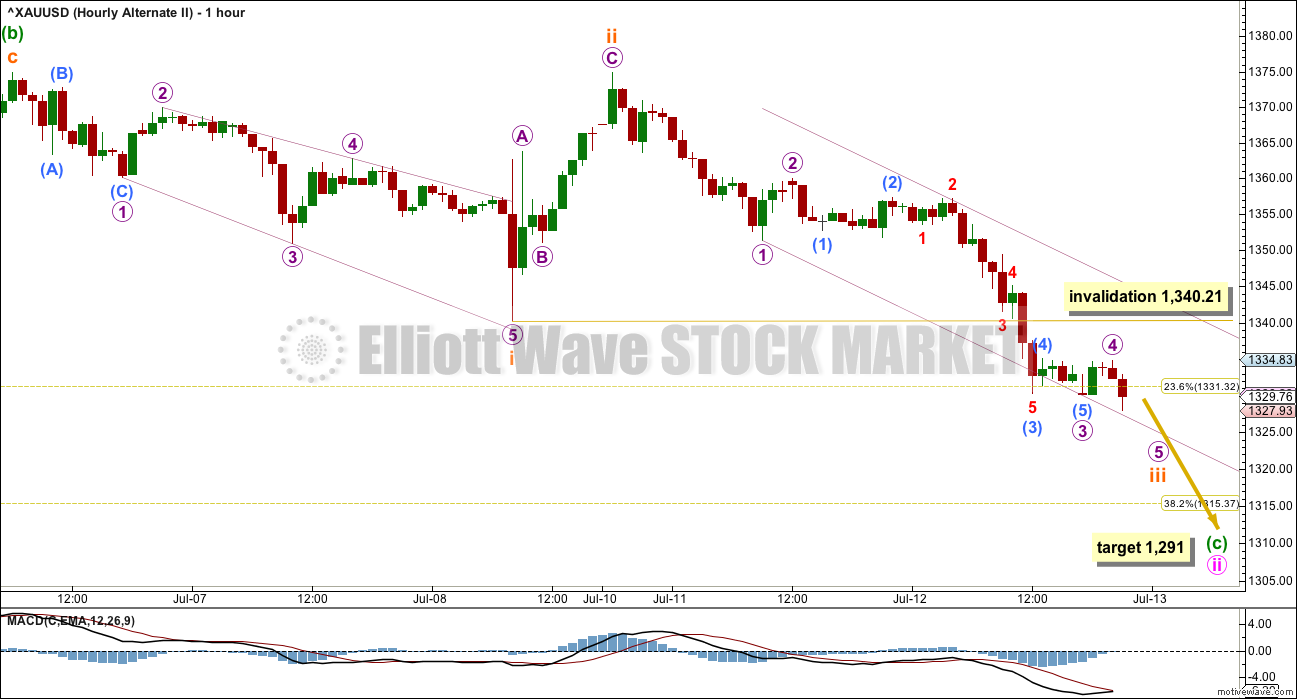
Click chart to enlarge.
The major difference at the hourly chart level between the two wave counts today is how to see the subdivisions within the wave down labelled subminuette wave i. The main wave count sees this as a three. This alternate sees it as a five. The wave down will fit both ways, so both possibilities must be considered.
If a five down is unfolding, then price must continue lower. Within the five wave structure, subminuette wave iv may not move into subminuette wave i price territory above 1,340.21.
This wave count expects to see one more day of downwards movement. It should exhibit weaker volume and weaker momentum as price finds a low.
Thereafter, the upwards trend should resume.
TECHNICAL ANALYSIS
DAILY CHART
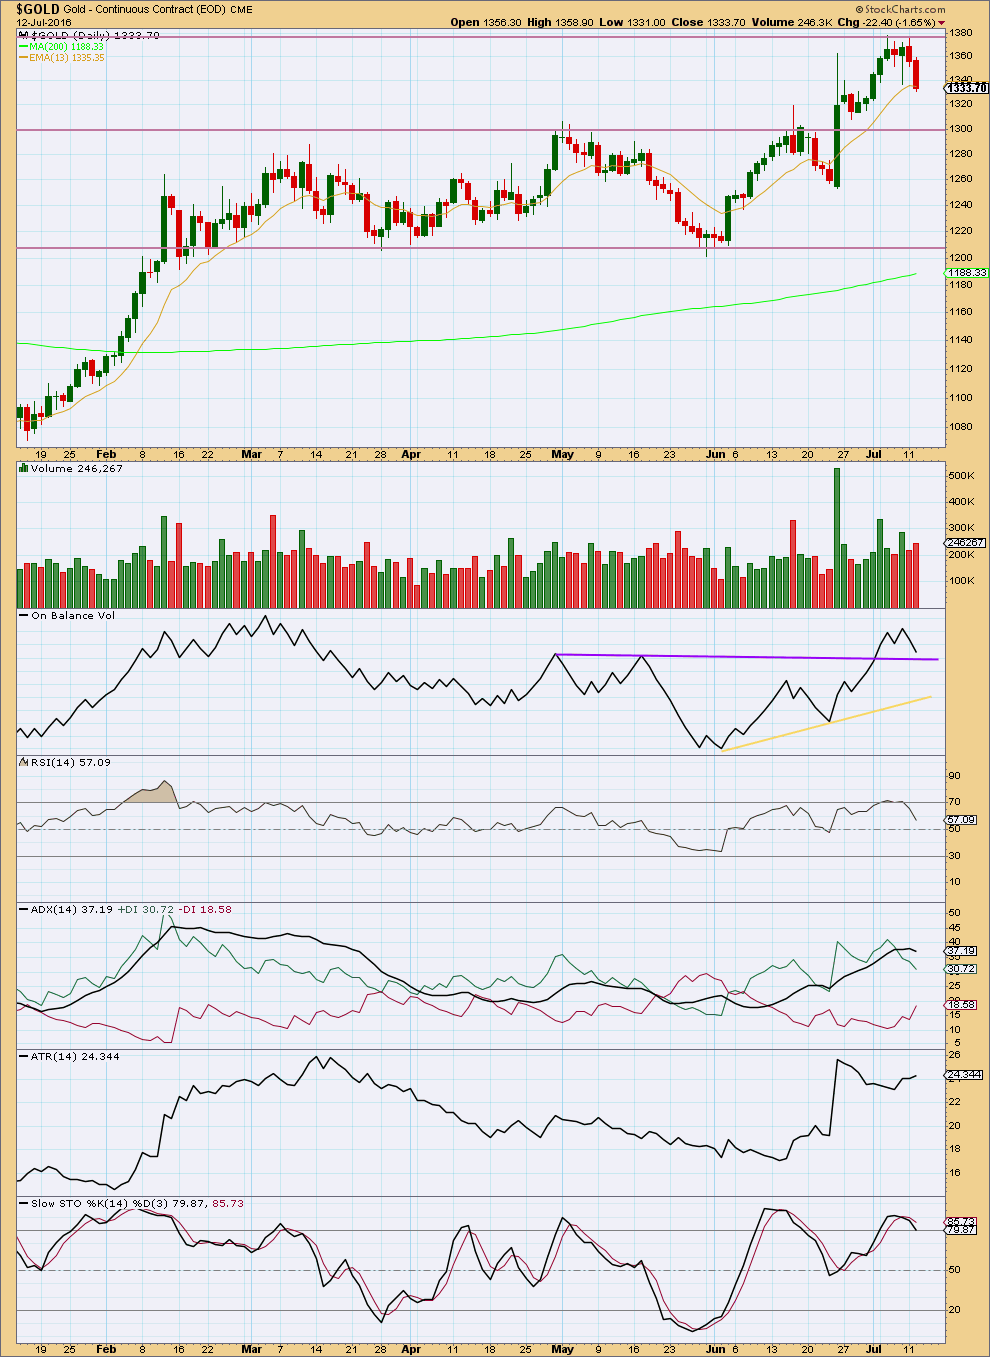
Click chart to enlarge.
There is some support for downwards movement today from an increase in volume. However, volume is still lighter than the last upwards day, so this downwards movement still looks corrective. The volume profile is still bullish.
On Balance Volume is coming down close to the upper purple line. If touched this should offer support and halt the fall in price there. There is a little room yet for OBV and for price to fall further.
This downwards movement has resolved RSI being overbought. RSI is returning to neutral.
ADX today is declining indicating the market is no longer trending. ATR disagrees as it is now increasing. ADX has not yet indicated a trend change, so expectations for the trend should be changed from up to neutral at this time.
Stochastics is still just overbought.
Price may find some support about the 13 day moving average. Sometimes this line is overshot during corrections early on in Golds third waves.
This analysis is published @ 10:20 p.m. EST.
The question is, is this it? Are we soon going down?
Caution: Gold, Silver and Miners …
Larry Edelson | Wednesday, July 13, 2016 at 7:30 am
http://www.moneyandmarkets.com/caution-gold-silver-miners-80082?em=ursulaperth%40gmx.com&utm_campaign=MAM3550&campid=43977&utm_medium=email
Thanks Ursula.
Beth, I couldn’t reply below, so doing so here. Just wanted to say that your Investing.com info offered nice detail and should be helpful for others.
For all interested in a good free charting tool, Investing.com and Tradingview.com are two good options.
I also wanted to point out that there is a manual that may offer a little instruction, but you will still need to experiment to learn how all the tools work. If you are going to use the EW tools, its very helpful if you use the same wave degrees and same colors as Lara to avoid confusion.
Happy charting!
This is another idea I didn’t publish yesterday for three reasons:
minute b would be 1.91 X minute a, too close to the maximum convention of 2 X to have a reasonable probability
the other alternate idea I published in the analysis seemed to have overall a better look
it seemed to be an unnecessary addition, too many wave counts can lead to inaction by paralysis due to over analysis 🙂
Today I need to rethink this wave count.
All possibilities need to be considered. This downwards move looks like it’s not done yet, we want to know how low it can and will go so we can find an entry to join the upwards trend and not get stopped out.
it would help if I posted the chart so you all know what I’m on about now wouldn’t it!
Thank you lara…
But dont you think that these kind of extreme possibilities are always available to scare us..??..
So can you please verify the classic TA to let us understand the chances for these possibilities…??
Lara,
Another option, could this be Minor 1 from 1201 to 1375 as 5 minute waves as an LD and correcting down 61.8% to 1268 for Minor 2. Its highly likely we go below $1300 in coming week or weeks. ABX, NEM,GOLD,GLD have sold off on very high volumes in last 2 days.
Sadly, no. The trend lines just don’t work.
I had three ideas yesterday actually at the daily chart level. Will post the third in next comment above….
For now, here is your idea of minor 1 as a leading diagonal. You can see how the trend lines look all wrong. There is no other point to put minute iv which fits and makes the ii-iv trend line right. And the upper trend line of a contracting diagonal should have a small overshoot at wave v, but this one is too far up.
Lara,
agree about the trend lines, your alternate above in Minor 2 does the same job and better fit structure wise, thanks
Several of my indicators gave a SELL at 2:35 pm today and the smallest time frame 1 minute indicators having peaked for 10 minutes turned down at 2:45 for an instant sell at 2:45 pm in Gold and NUGT.
I emailed my brother the warning at 2:35 pm and he sold 2:44 1 cent from the top in GDX and 2:46 4 cents from the top in GDXJ and he had topped up at the close Tuesday. He owes me a night on the town because he is busy all day and can’t watch things much.
He likes to take profits when there and reassess another entry.
Richard,
I sold out of my Higher GDX positions late morn w/small profit. I left the remainder purchased at 26 level. I am also looking to reassess to add.
I agree w/Lara…looks overlapping w/lite volume.
My 1st email was mistaken. Very difficult to describe waves by ‘wrote’ rather than chart. I meant to say that Lara’s Main Hourly count may simply Not be over, her target being (ii) Minuette [Green].
Again if anyone can help me out w/Investing.com to properly apply the text/circles correctly, I’d appreciate it. I am Not sure what I am missing.
Thank you
Hi Melanie,
If you haven’t already, please see my post concerning your questions and comments below.
Beth…
…I now understand that their is a ‘drop down menu’ with this icon. It will take a little practice, but works quite well.
Thanks again.
Melanie I wish I could help you with the charting but I don’t do any, not at that skill level in EW.
I am very suspicious of the overlapping in this upwards movement and the very light volume.
It could be overlapping first and second waves, but it may also be corrective and Gold has not yet found its low.
For the main wave count it could the that this as an X wave, for a double zigzag to move lower.
Hi Lara,
We ALL know that you’re doing your very best. l think we all want to see gold climb as anticipated and thank you for today’s timely comment about your suspicion. Thanks for your best efforts and for sacrificing your sleep to keep us aware of your thoughts.
No worries. I do suffer from insomnia quite badly, so I turn up here from time to time at odd hours 🙂
I actually dream of markets and waves, and it wakes me up sometimes!
I opened a buy after hours yesterday, and closed for a small profit today. This market behaviour is not what I expected, so I don’t want to be long. Yet. Not yet.
The time will come.
Alan
Can you label the waves from todays low..??..
Just for an idea..u have great eye..
James.
I’m seeing Minuette 3 from the low of 1327.57 targeting 1440.36. (All data are taken from pmbull).
Price is rising in subminuette 1.
Micro 1 of subminuette 1 ended at today’s high of 1345.50. The drop which ended at 1336.80 is most likely micro 2, unless that second wave morphs into a combination.
This is the best count I can muster at the moment. Wave counts sometimes change due to unforeseen structures cropping up.
Thank u…its clearer for me now
Does not the 3 wave look of micro wave 1 on the hourly chart ending at 1345 cause concern that this may be corrective?
Hi Alan,
I’m not really able to see an impulse with your count. I’ve posted an alternative – that Minuette 2 hasn’t yet ended!
I’d appreciate all comments to this proposed wave count.
Thx
Reading counts of these degree are very tough…only looking at hourly chart one cant label them…we have to go and have a keen look in 5min charts…subs sub wave labelling is a proffesional job…ufffff
I agree that that looks likely.
Here’s an attempt at the 5 min chart. I can’t label smaller than miniscule!
Hi Beth. This wave count is similar to Lara’s alternate hourly. She had 1340.21 as the invalidation point, which had been breached very early on.
That’s why I’m looking for a count that fits her main count.
Hi Alan, this wave count is based on Lara’a main count – the Micro 3, 4 and 5 (as well as Subminuette C and Minuette 2) have been updated.
Hi Beth. That’s good to know.
What is more pressing now is whether price will drop as your wave count suggests. I’m looking at intraday resistance at 1345.50. If breached, I have greater confidence that the price is up. If not, it might be time to get out of longs.
Thanks for the warning given.
Hi Beth and all,
1. Beth, I tend to agree with you and Daniel. Entire move fr. 1328/GCQ6 (Investing.com) look like could be forming a 4th.
a. If moves above 1352 bttm. of 1Micro /(ii)Grn, your count would likely be negated.
b. Looking @ Lara’s Main wave count, it is also possible that we are still in Minute iicrc (Pink), and Subminuette iv of iicrc is now forming giving us room to move as far down to 1291. Lara posts 1315 as 32.8 retrace of Minute icrc (Pink).
c. I have been reading articles at various gold sites as most of you have been, and see several targets for 1315 to 1300. Of course 1300 is a nice round no. and easy to quote.
d. Beth, if your are right, Subminutte C (Orange)of 4Micro (Purple) is getting off to a slow, but convincing start now.
2. I am NEW to Investing.com and Lara’s work. Though Dreamer attempted to show how he is able to ‘Encircle’ his numbers/letters as you/he label the waves, I have not been able to do this on their portal.
a. I AM logged in, but
b. I am Not using a Trade platform thru their site. I note that both you and Dreamer are using Trading View. Does one have to be using this software (I do Not see it listed under ‘Charting Applications’ OR ‘Trading Platforms’) in order to draw EWI patterns/labels with accuracy on Investing.com charts?
I’d appreciate your feedback so that I can get these circles to ‘appear’ more easily also
Thank you
Current low daily volume on GDX also not supportive of upwards movement in price.
Hi Melanie, I am relatively inexperienced and am doing my best to learn from Lara and the members of EWG. Concerning your comments,
a. I agree
b. I think you are referring to Lara’s Alternate II count and this one was invalidated after Gold rose above 1340.
c. + d. It would be great to see Gold go down to 1315 or 1300 so that we could all “load the boat” as Richard Besner often says.
Concerning investing.com, Dreamer did give a great explanation recently. I am also logged in and do not use the Trade Platform. To create a wave pattern, click on the the sixth icon in the vertical tool box on the left. Select type of wave you’d like to display. Click in the workspace and “draw” the pattern. When the wave pattern is selected (click on it), a secondary (horizontal) tool bar appears. As Dreamer had said, select the gear symbol (“settings”) and a dialogue box appears. Here, I use Lara’s colours for each degree of wave. Select or deselect the “show wave” box as you please. Concerning “TradingView”, this appears on the image when one takes a snapshot of their wave count to display to others.
All the best!
A big bearish bet on GLD today. Will they get burned?
There are a few analysts who think that the miners are in a bear market rally.
Could it be just someone temporarily hedging a large GLD position due to recent gold pullback?
EW chart has similar target then move up like Lara’s
Elliott Wave Analysis: GOLD In A Temporary Correction, Support Seen Around 1305/1330
Gregor Horvat of Elliott Wave Financial Service – IF – Tue Jul 12, 3:50AM CDT
http://www.barchart.com/headlines/story/257575/elliott-wave-analysis-gold-in-a-temporary-correction-support-seen-around-1305-1330
With Gold’s weakness today, GDX broke it’s uptrend line. This could mean that GDX has started Minor 4 for a multiday correction, but that will be my alternate idea.
For my main count, GDX is shown in the chart with Minute 4 continuing as an expanded flat. Minuette wave (c) of the expanded flat made a new low below Minuette wave (a), so Minute 4 may be over. It also may continue lower so that Minuette wave (c) = 1.618 x Minuette wave (a) @ 28.68. Either way, the correction should be over soon.
Thank you Dreamer for the GDX update!
Dreamer, thanks for the updated chart!
Dreamer, just want to say I much appreciate your sharing the GDX progress as of late– it has been VERY helpful in making decisions. Your hard work is motivating me to do more EW study/practice. 🙂
Thanks. That’s good to hear! Investing.com and tradingview.com are two good (and free) sites to practice your ewave!
Gold Market Has Potential To Start A Multi-decade Bull Run – Technical Analyst
Jul 12, 2016 06:51 GMT Source:Kitco
http://www.metal.com/newscontent/95128_gold-market-has-potential-to-start-a-multi-decade-bull-run—technical-analyst
Includes comments by Avi Gilburt Elliott Wave analyst that are bullish gold and silver.
Lara what is the source of your gold price data feed please?
I’m looking to confirm if gold just went above the Hourly Alternate invalidation point above 1,340.21 as http://www.pmbull.com has a gold high of 1,340.63 at 11:10 pm EST.
If so then the alternate daily remains and would then end up needing a new alternate hourly wave count.
The last I remember, Lara uses this site for the data feed.
http://www.barchart.com/
That’s correct Dreamer. BarChart tell me their data for Gold comes directly from COMEX.
Lara I checked COMEX and although a small chart it shows your Hourly Alternate is still valid.
http://www.pmbull.com has a gold high of 1,340.63 at 11:10 pm EST.
Now it is. Price made a high of 1341.70 in barcharts.com.
Looks like futures are confirming main wave count, although the speculator in me would love to buy down under 1300!