
Upwards movement confirmed the main Elliott wave count and invalidated the alternate.
I have three daily and hourly Elliott wave counts today.
Summary: The trend is still up. Corrections are still an opportunity to join the trend. The long term target remains the same at 1,582. At this stage, despite confirming the main wave count, upwards movement looks unconvincing because of lack of strength and volume. It looks likely this correction will continue to be deeper for a few days, so the more likely target is 1,291.
New updates to this analysis are in bold.
Last weekly chart can be found here.
Grand SuperCycle analysis is here.
DAILY ELLIOTT WAVE COUNT I
Click chart to enlarge.
There are three wave counts today presented in order of probability.
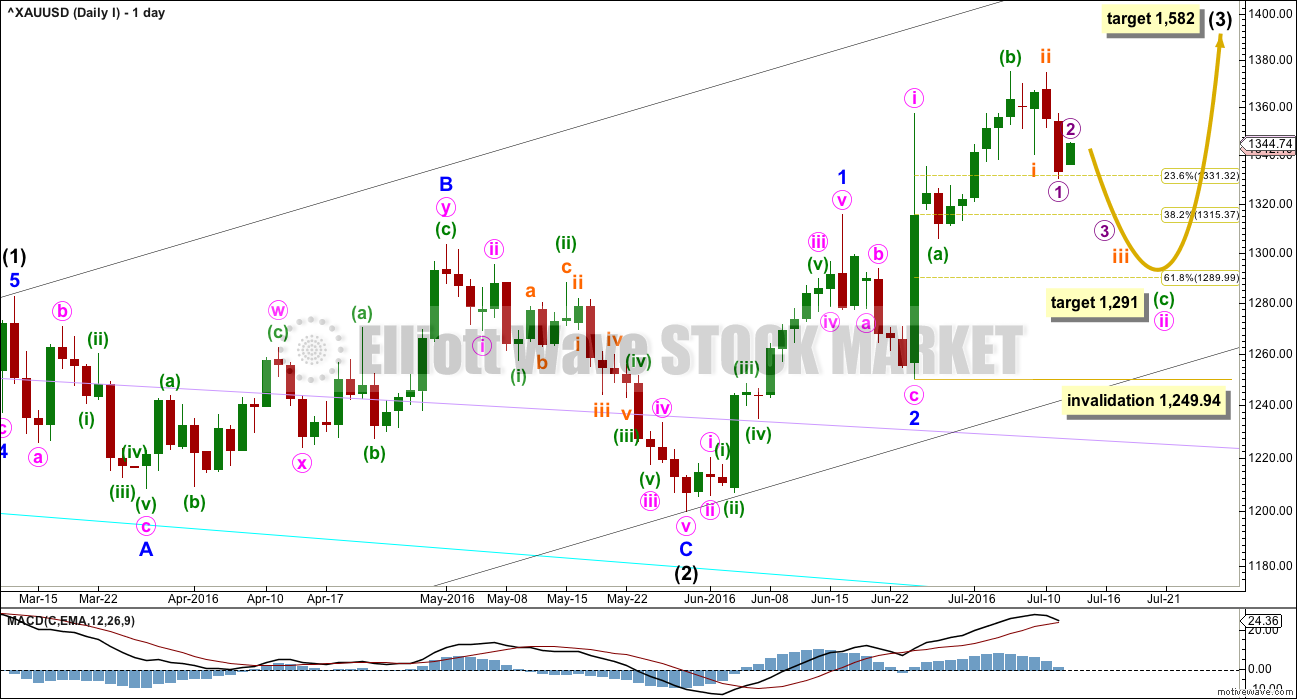
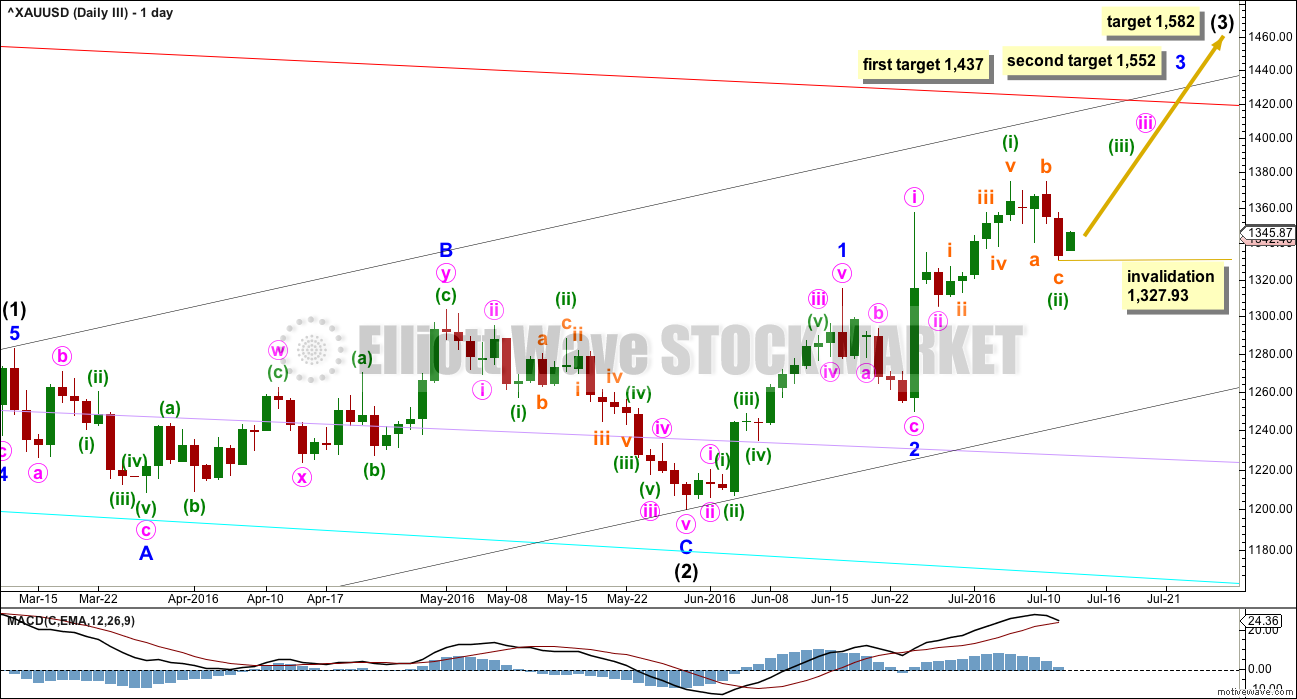
Intermediate wave (2) is a complete expanded flat correction. Price from the low labelled intermediate wave (2) has now moved too far upwards to be reasonably considered a continuation of intermediate wave (2). Intermediate wave (3) is very likely to have begun and would reach 1.618 the length of intermediate wave (1) at 1,582.
Intermediate wave (3) may only subdivide as an impulse.
So far minor waves 1 and 2 may be complete within intermediate wave (3). The middle of intermediate wave (3) may have begun and may also only subdivide as an impulse.
Within minor wave 3, minute wave i is complete. Minute wave ii may be continuing as an expanded flat correction. Expanded flats are very common structures.
Within minute wave ii, minuette wave (a) subdivides as a quick three wave structure. Minuette wave (b) subdivides perfectly as a zigzag and is a 1.34 length of minuette wave (a), within the normal range of 1 to 1.38.
It would be highly likely for minuette wave (c) to make at least a slight new low below the end of minuette wave (a) at 1,305.59 to avoid a truncation and a very rare running flat.
At 1,291 minuette wave (c) would reach 1.618 the length of minuette wave (a). This is close to the 0.618 Fibonacci ratio of minute wave i at 1,290, so this is a reasonable target.
Minuette wave (c) may only subdivide as a five wave structure, either an impulse or ending diagonal. So far it looks like the more common impulse.
Minute wave ii may not move beyond the start of minute wave i below 1,249.94.
HOURLY ELLIOTT WAVE COUNT I
Click chart to enlarge.
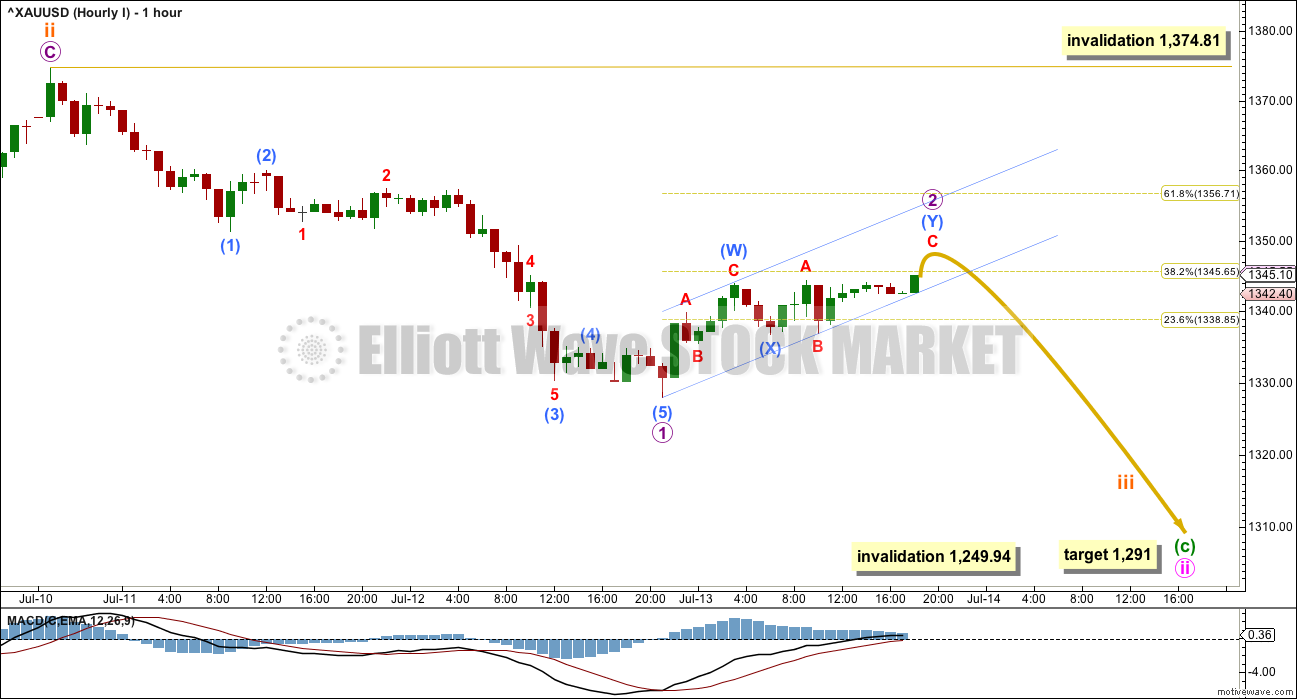
Upwards movement for Wednesdays session labelled micro wave 2 is now back in subminuette wave i price territory (subminuette wave i can be seen on the daily chart). This upwards movement cannot be subminuette wave iv because it may not overlap back into subminuette wave i price territory.
The degree of labelling within subminuette wave iii is moved down one degree today. Subminuette wave iii may be extending, which is common for a third wave. Within subminuette wave iii, only micro wave 1 may be complete. Micro wave 2 fits as a choppy overlapping double zigzag and may end soon. Or it may move higher to the 0.618 Fibonacci ratio of micro wave 1 at 1,357.
Micro wave 2 may not move beyond the start of micro wave 1 above 1,374.81.
Draw a small best fit channel about this overlapping upwards movement. So far price is finding support at the lower edge. When price breaks below the lower edge with clear downwards movement, that shall be an early indication that the correction for micro wave 2 is likely over and micro wave 3 within subminuette wave iii down should have begun.
Volume should show an increase in downwards movement if this wave count is correct.
DAILY ELLIOTT WAVE COUNT II
Click chart to enlarge.
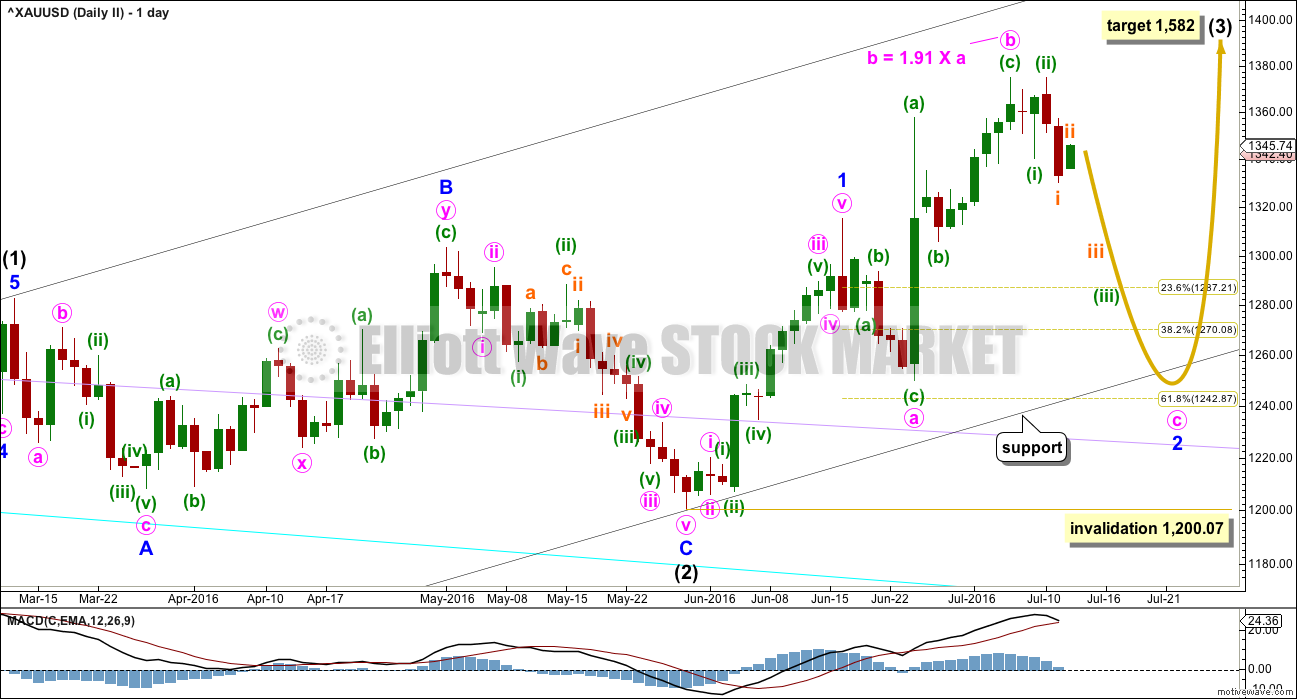
This wave count was not published yesterday. It is new.
My bottom line is that intermediate wave (2) is highly likely to be over, so I must consider all possibilities for how intermediate wave (3) is starting from the low labelled intermediate wave (2).
What if minor wave 2 is not over? It may be continuing as an expanded flat correction. Again, these are very common structures.
The target for intermediate wave (3) is still the same at 1,582.
Minute wave b is a 1.91 length of minute wave a within the expanded flat of minor wave 2. This is longer than the common range for a B wave within a flat of 1 to 1.38, but still within the allowable convention of up to 2 times the length of wave A. However, it is close to the maximum, so this must reduce the probability of this wave count.
Minute wave c of the flat would be very likely to make at least a slight new low below the end of minute wave a at 1,249.94 to avoid a truncation and a very rare running flat. The 0.618 Fibonacci ratio of minor wave 1 at 1,243 would be a reasonable expectation to achieve this.
Minute wave c must subdivide as a five wave structure, either an impulse or an ending diagonal. So far an impulse looks more likely, and it is more common, so it should be expected in the first instance.
Within the impulse of minute wave c, the third wave of minuette wave (iii) looks like it may be extending. Again, this is a very common tendency for third waves, so this should be expected.
The target expects that minor wave 2 may overshoot the lower edge of the base channel about intermediate waves (1) and (2). This is possible, but it does reduce the probability of the target. The base channel is fairly likely to be respected and should offer strong support.
Minor wave 2 may not move beyond the stat of minor wave 1 below 1,200.07.
HOURLY ELLIOTT WAVE COUNT II
Click chart to enlarge.
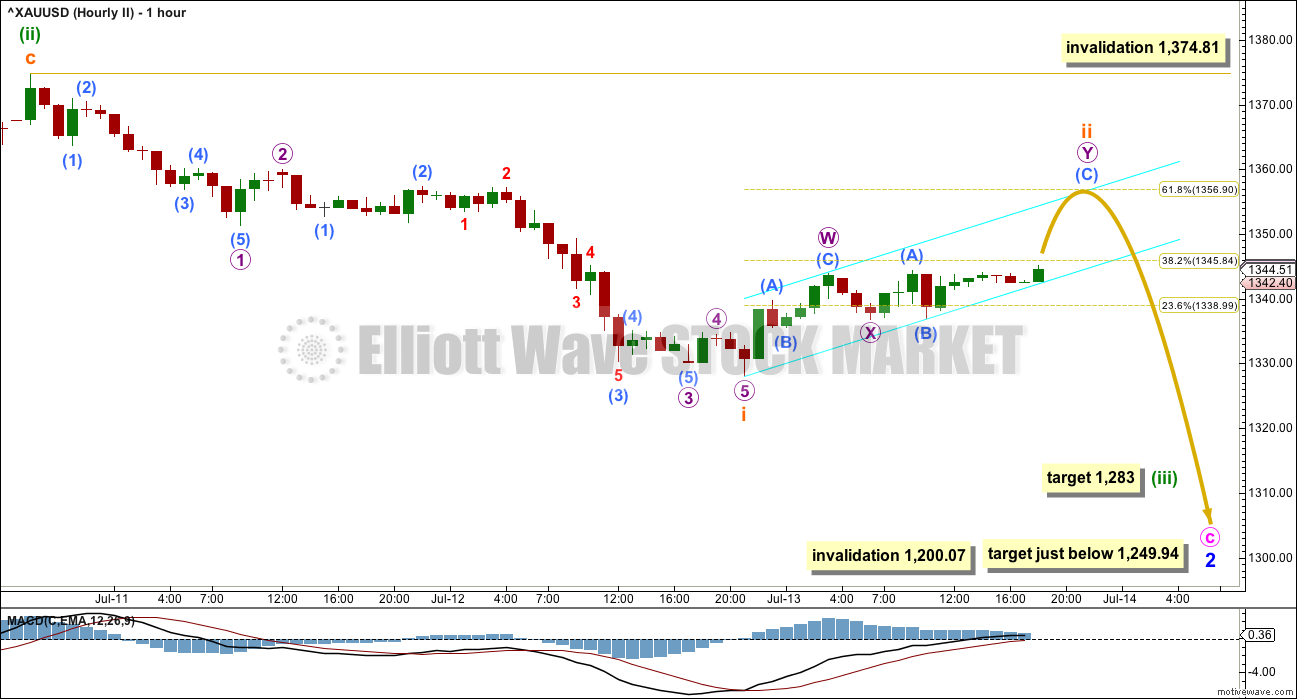
Structure and subdivisions at the hourly chart level for wave counts I and II are essentially the same.
This second wave count moves the labelling within downwards movement up one degree. That is the biggest difference.
Because this second wave count expects to see a much deeper correction from Gold in coming days, it can calculate a target for the extended third wave down. At 1,283 minuette wave (iii) would reach 1.618 the length of minuette wave (i).
DAILY ELLIOTT WAVE COUNT III
Click chart to enlarge.
I am concerned that in putting this wave count last, that if I am wrong, we may be missing the perfect opportunity to join an upwards trend right before a strong middle of a third wave begins to move price higher.
This wave count is judged to have the lowest probability today, but it is very important to note that the difference is not great. It still has a fairly reasonable probability although it is presented third.
I leave it up to members to make their own decisions about how to approach the market at this time. Some may choose to risk a long entry. If you do, then my advice would be to move stops to break even as soon as reasonably possible to eliminate risk. Each member should do their own due diligence and make their own judgment based on preferred technical analysis methods.
My judgement of lowest probability (but not by a significant margin) is based on volume for Wednesday’s session being light, and upwards movement being choppy and overlapping. But sometimes third waves (this is especially for Gold) do start off a little slow, with overlapping and light volume. Then they can ramp up quickly.
There may now be a series of four overlapping first and second waves: intermediate, minor, minute and now minuette.
Within minuette wave (iii), no second wave correction may move beyond the start of its first wave below 1,330.29.
At 1,437 minor wave 3 would reach 1.618 the length of minor wave 1. If price gets to the first target and the structure is incomplete, or if price keeps rising through the first target, then the second target would be used. At 1,552 minor wave 3 would reach 2.618 the length of minor wave 1.
Along the way up, there is a strong resistance at the line in red copied over from the weekly chart. Expect some resistance and a pullback about there, even if only for a day or so.
HOURLY ELLIOTT WAVE COUNT III

Click chart to enlarge.
If this wave count is correct, then a zigzag downwards must now be complete. A third wave up should now be underway.
At 1,440 minuette wave (iii) would reach 1.618 the length of minuette wave (i).
Price should continue to find support at the lower edge of the best fit channel if this wave count is correct, for some time. The earliest indication this wave count may be wrong would be a breach of the lower edge of the channel.
Volume bars are added to this hourly chart. Volume from the end of minuette wave (ii) is quite light. This does not support the idea of a third wave up beginning.
If price makes a new high above 1,374.81, then this wave count would be confirmed fully and the first two wave counts would be invalidated. At that stage, confidence may be had in upwards targets.
TECHNICAL ANALYSIS
DAILY CHART
Click chart to enlarge.
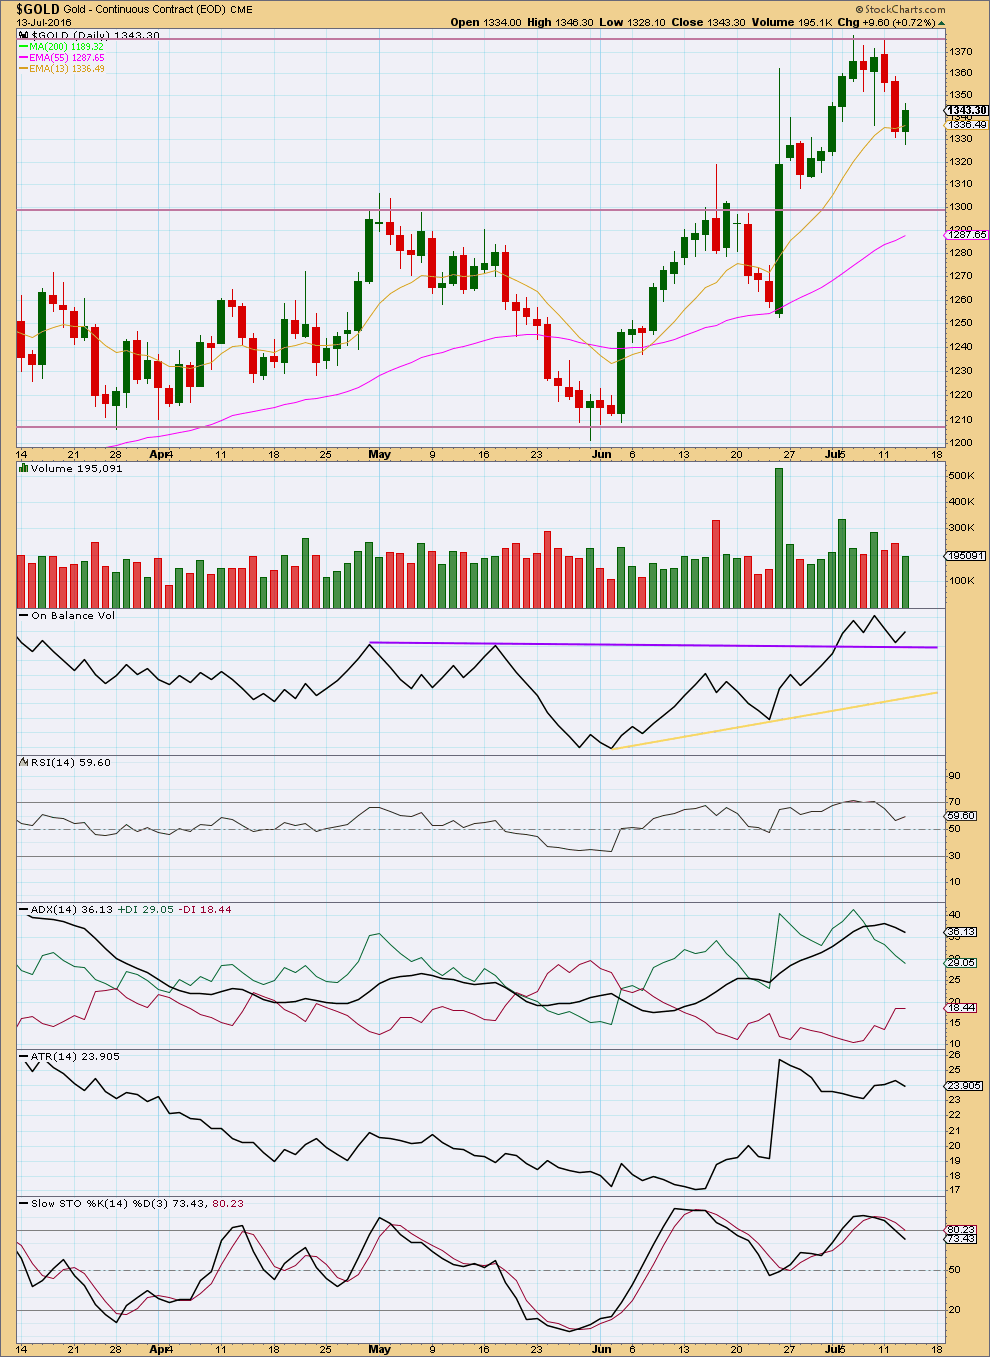
The upwards session for Wednesday has lighter volume than the two prior downwards sessions. This volume profile is short term bearish.
The longer term picture still sees volume overall falling as price moves lower. Downwards movement still looks like a correction within an upwards trend. The mid and longer term volume profile is still bullish.
On Balance Volume gave a bullish signal seven days ago with a break above the purple line. Now OBV has turned down to test that line which has held. OBV moving up and away from that line is another bullish signal.
If OBV breaks below the purple line, that would strongly support the first two wave counts and the third would be discarded. OBV may then find support at the yellow line.
If OBV moves up for one more session, then the third wave count would substantially increase in probability.
ADX is declining indicating the market is not trending. ADX is extreme above 35, but this indicator can remain extreme for reasonable periods of time when Gold is in a strong trend. However, the first two wave counts would allow for this extreme to be better relieved before the trend continues.
ATR is overall flat to declining, agreeing with ADX. This may offer slight support to the first two wave counts.
RSI did not exhibit divergence with price at the last two highs. There was no weakness indicated by RSI.
Stochastics did exhibit divergence with price at the last two highs. With ADX indicating no trend, it may be expected that a downwards swing in price will continue until price finds support and Stochastics reaches oversold at the same time.
Price may find support about 1,300.
Price is not finding support perfectly about the 13 day moving average, so a 55 day moving average is added. For deeper corrections early on in Gold’s trends, this average looks about where price may find support and may coincide with the horizontal support line at 1,300.
This analysis is published @ 08:58 p.m. EST.
This is what I think is happening short term. One more wave down to the target at 1,291 would complete an impulse down for minuette (c).
First, subminuette iv may move sideways, it may end at the mid line of the channel.
The channel looks perfect. The wave count fits with MACD; the middle of the third wave is the strongest portion.
Fifth waves for Gold can be swift and strong. Not always, but often. This almost always shows up to end Gold’s third wave impulses, but sometimes can show up to end it’s C waves as well. So look out for that tendency, a surprise to the downside in the next 24 hours.
But first, if we see sideways movement and it remains below 1,340.21 then it may be subminuette wave iv giving us plenty of time to get positioned for subminuette wave v down for a quick scalp. If you are so inclined.
Remember everybody, Lara’s two rules which should never be broken. Always use a stop loss. Always. Never ever anything ever invest more than 3-5% of equity on any one trade. In this case scale down position size to 3% or below because it would be a quick scalp against the main trend.
Ignore those rules at your peril. Particularly the one about stops.
Lara thanks for your comment and chart. Excellent!
Got selling signals at 1:15 and 1:20 then again at 2:02 pm EST for NUGT 5 and 1 minute MACD and EMA turned bearish.
Any bullish price target during market hours today for a bullish bounce and quick sell day trade today? Like the A of an A-B-C down or am I dreaming?
Using Lara’s Hourly 1 count I have this on the hour chart
On the 5 min chart I reckon we are currently in a zig-zig imo,thoughts?
Hi Paul,
This is what I’m thinking too.
What is the story with the 127.2%?
Thx.
Its the square root of 1.618, so not a true Fibonacci ratio
Lara,
We had a drop from 1920 to 1046 for $874 and a retrace up so far to 1375, for $329
at 37.64%. Assuming, if this correction is over for this huge bear market since July 2011.
Is this upward re-trace sufficient to start another big leg down?
What would be your ALT. bear count on this basis of assumption?
Everyone (majority) seems to be bullish on Gold here, not so good for ongoing bull trend?
Commercials are at or near the highest short levels.(Smart money is usually right over time)
Lara,
No need to reply as this retrace up has more to go on upside likely towards one of your targets,Thx.
Lara thanks for your hard work analysing EW waves. You have put all there is you know on EW rules and guidelines on the table.
Excellent!!!
On TA my experience is that technical indicators work till they do not work.
Case in point all these years gold seasonality worked well and COT data worked well till they failed this year badly.
Both of them are still calling out a correction in gold. May be it is delayed but Lara’s count shows it may have arrived.
A buying opt is coming for good profitable trade.
I am sticking to my junior miners till int wave 3 target is hit.
Lara, on the July 5 GDX post, I think I remember there were at least 16 comments. Now that the post is closed to comments, it seems that the existing comments are no longer there? Shouldn’t they still be viewable? Thanks,
They’re still there, click on the title. That takes you through to the article and comments.
After a week comments close.
Got it. Thanks
At this point I think it looks like the main hourly I is the way gold is going.
Target is 1,291.
I will stick to the bull wave count which see we are in 3 of minor 3…
Stocks moved higher since last 15days and gold managed to hold its support levels…thats bullish indication…TA is not showing any tiredness except yesterdays volume and that can be neglected for a while….
My view that stocks can anytime start ther 2nd wave correction and this will act a trigger to the 3rd wave up in gold..i personally feel that before next fomc meet which is pending on 25th july..gold should breach 1400 and complete its minutte 3 wave and this time looking at the global stock market scenario and NFP job data FOMC is poised to hike rates…that will trigger and complete minutte 4 of minor 3…
I will stick to laras yesterdays analysis…and for the day i will neglect these scary corrective daily chartss… 🙂
Thank you lara for giving us such a clear picture to understand risks and rewards…thank u
You’re a bold soul as gold is crashing down now.
Ive exited @1328
GDX is consolidating. The question is, will it breakout to the upside or downside?
With low volume for today’s up day and a newly formed H&S pattern, I think it is more likely that GDX will have a few more days to the downside. Watch for a neckline break for pattern confirmation. Target may be 28.
As an alternate, a breakout to the upside would target 32 or higher.