
Yesterday’s analysis expected some sideways movement for a fourth wave.
Overall, price moved lower to complete an inside day which looks like a long legged doji on StockCharts data.
Summary: The trend is still up. A multi day correction against the trend is unfolding and still looks incomplete. A target for it to end is either 1,303 or just below 1,249.94. Volume still supports a short term bearish view.
New updates to this analysis are in bold.
Last weekly chart can be found here.
Grand SuperCycle analysis is here.
DAILY ELLIOTT WAVE COUNT I
Click chart to enlarge.
There are two wave counts today presented in order of probability.
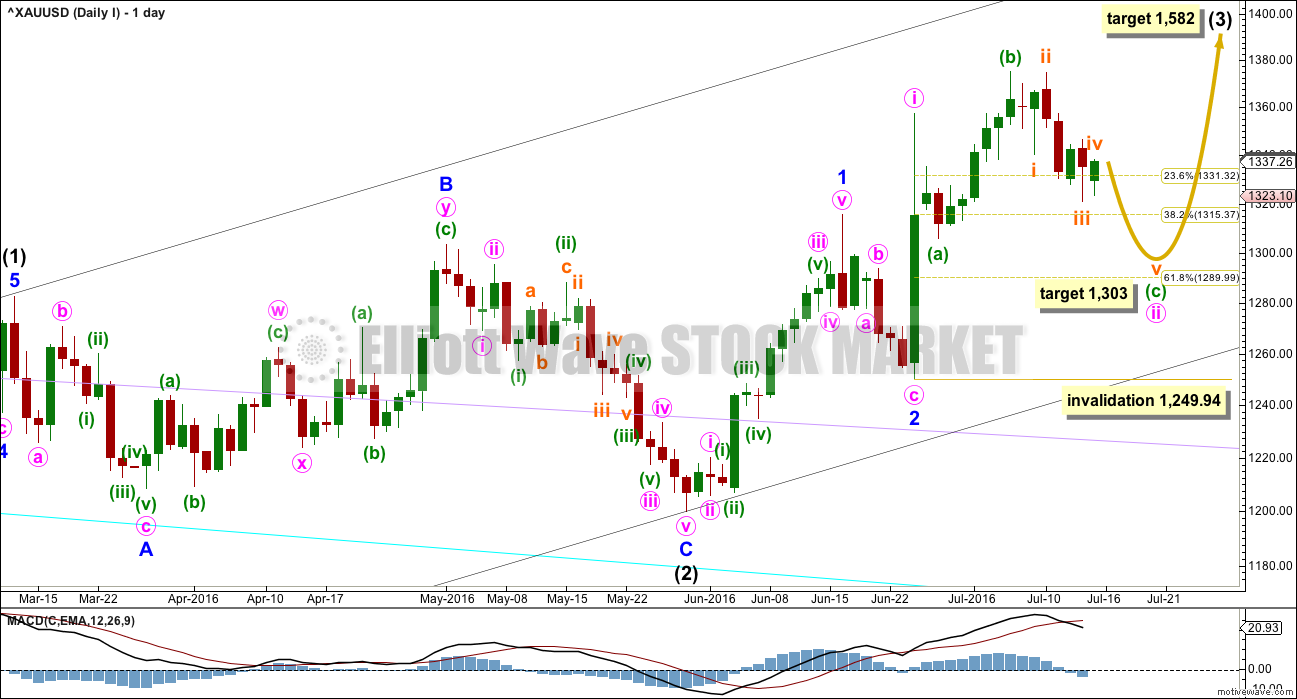
Intermediate wave (2) is a complete expanded flat correction. Price from the low labelled intermediate wave (2) has now moved too far upwards to be reasonably considered a continuation of intermediate wave (2). Intermediate wave (3) is very likely to have begun and would reach 1.618 the length of intermediate wave (1) at 1,582.
Intermediate wave (3) may only subdivide as an impulse.
So far minor waves 1 and 2 may be complete within intermediate wave (3). The middle of intermediate wave (3) may have begun and may also only subdivide as an impulse.
Within minor wave 3, minute wave i is complete. Minute wave ii may be continuing as an expanded flat correction. Expanded flats are very common structures.
Within minute wave ii, minuette wave (a) subdivides as a quick three wave structure. Minuette wave (b) subdivides perfectly as a zigzag and is a 1.34 length of minuette wave (a), within the normal range of 1 to 1.38.
It would be highly likely for minuette wave (c) to make at least a slight new low below the end of minuette wave (a) at 1,305.59 to avoid a truncation and a very rare running flat.
The target is now recalculated at subminuette degree at the hourly chart level. If this target is wrong, it may be a little too high. If price drops through 1,303, then the next target would be at 1,291 – 1,290 where minuette wave (c) would reach 1.618 the length of minuette wave (a), and minute wave ii would end at the 0.618 Fibonacci ratio of minute wave i.
Minuette wave (c) may only subdivide as a five wave structure, either an impulse or ending diagonal. So far it looks like the more common impulse.
Minute wave ii may not move beyond the start of minute wave i below 1,249.94.
HOURLY ELLIOTT WAVE COUNT I
Click chart to enlarge.
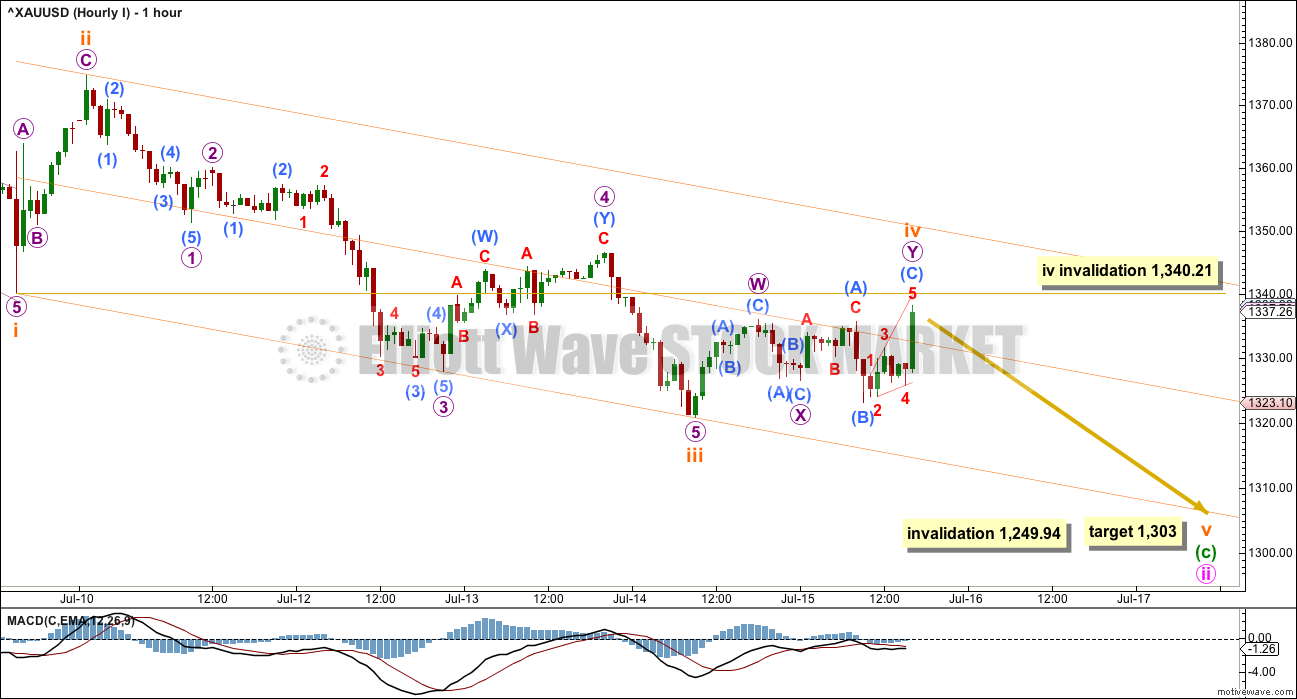
The current upwards movement should be expected to be subminuette wave iv while price remains below 1,340.21. If price moves above 1,340.21, then upwards movement should be expected to be micro wave 2. This idea is better shown in the second hourly chart below. If price moves above 1,340.21 before new lows are made, then the degree of labelling of subminuette wave iii would be moved down one degree. I would not consider the possibility that the whole structure of minute wave ii is over because minuette wave (c) would be truncated by 41.04. The truncation would be way to large for any serious consideration.
From the high labelled subminuette wave ii to the low labelled subminuete wave iii, a five wave impulse now looks to be complete. This may be subminuette wave iii in its entirety, or the degree of labelling within this impulse may be all moved down one degree and it could be only micro wave 1 within the impulse of subminuette wave iii.
If subminuette wave iii is over at the last low, then it was just 2.14 short of 1.618 the length of subminuette wave i. Subminuette wave iii exhibits stronger momentum than subminuette wave i, and the strongest portion is the middle of the third wave. This labelling is preferred while price remains below 1,340.21 because it has the right look.
Ratios within subminuette wave iii are: there is no Fibonacci ratio between micro waves 3 and 1, and micro wave 5 is 2.32 longer than equality in length with micro wave 1.
Subminuette wave iv fits neatly as a double combination: zigzag – X – expanded flat. This gives perfect alternation with the quicker single zigzag of subminuette wave ii.
Draw a channel about this downwards impulse using Elliott’s first technique: draw the first trend line from the ends of subminuette waves i to iii, then place a parallel copy on the end of subminuette wave ii. Subminuette wave v may end about the lower edge of this channel. It may also possibly overshoot the lower edge of the channel. Look out for the potential for a swift strong fifth wave down on Monday.
Gold often exhibits swift strong fifth waves, typical of commodities. This is particularly true for Gold’s third wave impulses, but also sometimes its C wave impulses.
Subminuette wave iv may not move into subminuette wave i price territory above 1,340.21.
DAILY ELLIOTT WAVE COUNT II
Click chart to enlarge.
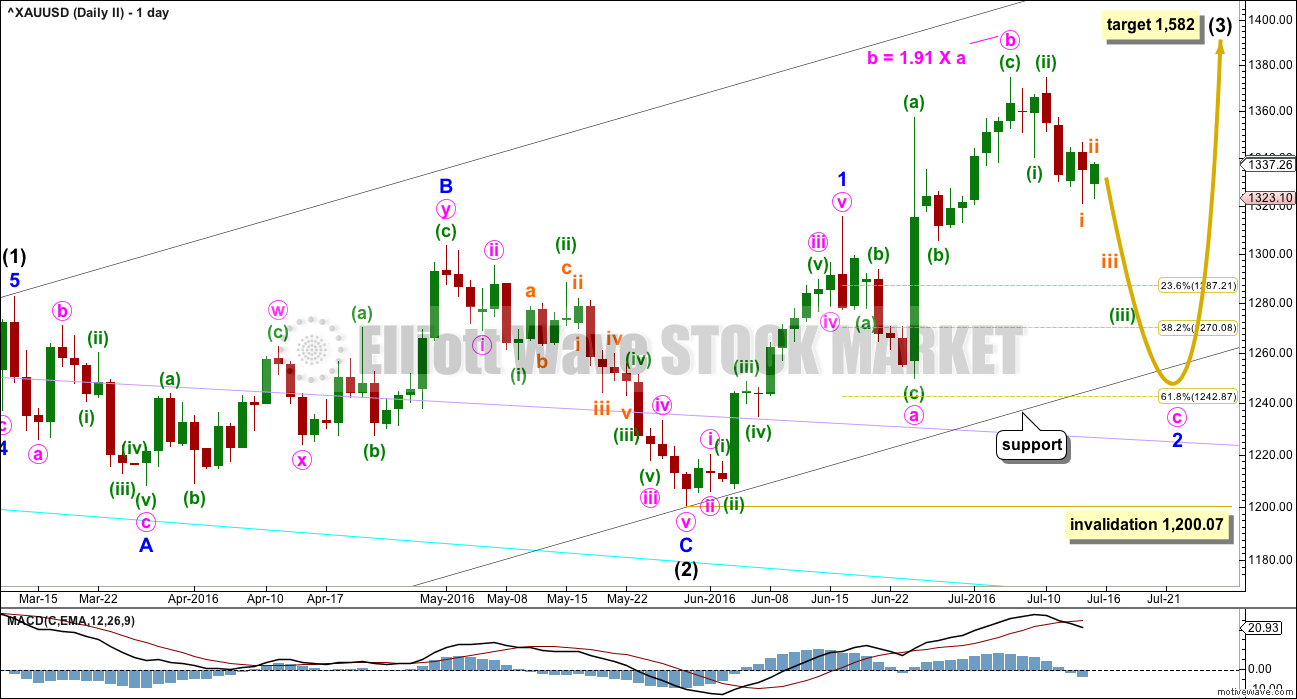
My bottom line is that intermediate wave (2) is highly likely to be over, so I must consider all possibilities for how intermediate wave (3) is starting from the low labelled intermediate wave (2).
What if minor wave 2 is not over? It may be continuing as an expanded flat correction. Again, these are very common structures.
The target for intermediate wave (3) is still the same at 1,582.
Minute wave b is a 1.91 length of minute wave a within the expanded flat of minor wave 2. This is longer than the common range for a B wave within a flat of 1 to 1.38, but still within the allowable convention of up to 2 times the length of wave A. However, it is close to the maximum, so this must reduce the probability of this wave count.
Minute wave c of the flat would be very likely to make at least a slight new low below the end of minute wave a at 1,249.94 to avoid a truncation and a very rare running flat. The 0.618 Fibonacci ratio of minor wave 1 at 1,243 would be a reasonable expectation to achieve this.
Minute wave c must subdivide as a five wave structure, either an impulse or an ending diagonal. So far an impulse looks more likely, and it is more common, so it should be expected in the first instance.
Within the impulse of minute wave c, the third wave of minuette wave (iii) looks like it may be extending. Again, this is a very common tendency for third waves, so this should be expected.
The target expects that minor wave 2 may overshoot the lower edge of the base channel about intermediate waves (1) and (2). This is possible, but it does reduce the probability of the target. The base channel is fairly likely to be respected and should offer strong support.
Minor wave 2 may not move beyond the stat of minor wave 1 below 1,200.07.
HOURLY ELLIOTT WAVE COUNT II
Click chart to enlarge.
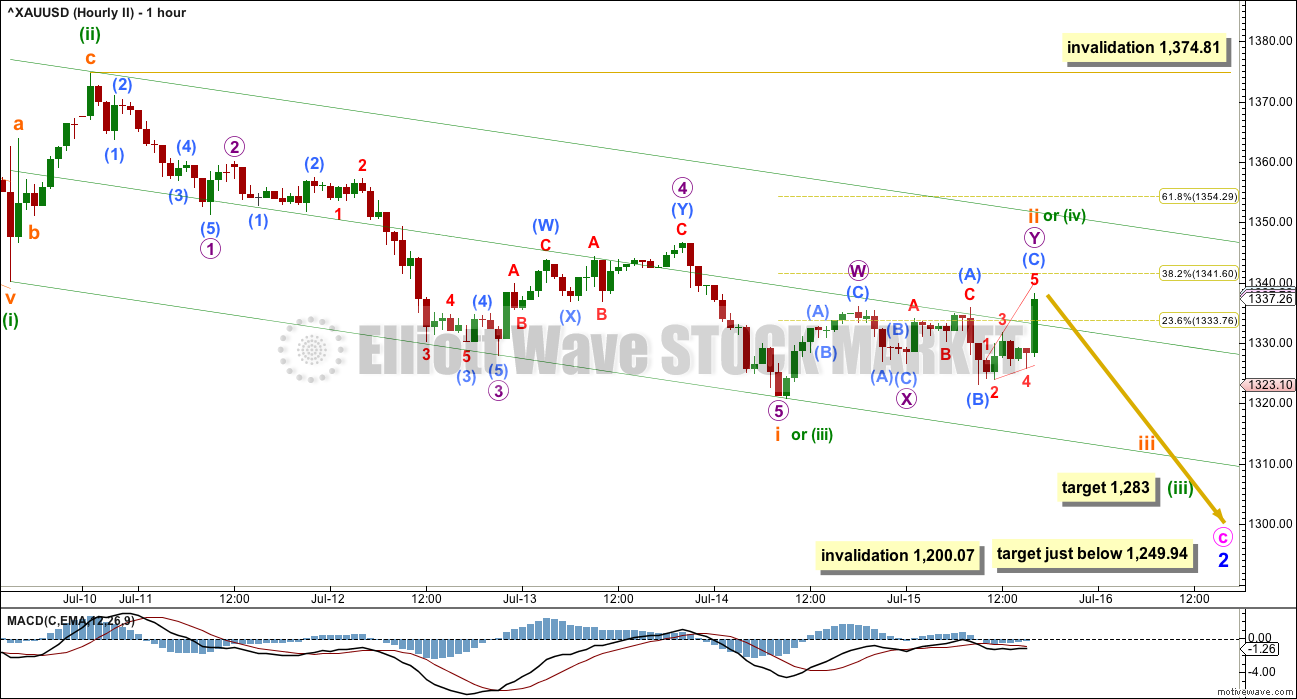
Structure and subdivisions at the hourly chart level for wave counts I and II are essentially the same.
This second wave count has different degrees of labelling, but the idea is the same.
So far from the high labelled here minute wave b, there is a 5-3-5 down complete. This may be minuette waves (i), (ii), (iii) with price now in minuette wave (iv). Or it may be minuette waves (i), (ii), and within minuette wave (iii) only subminuette wave i is complete.
If only subminuette wave i is complete, then the current upwards movement may be another second wave correction for subminuette wave ii. It may have completed a double combination just short of the 0.382 Fibonacci ratio of subminuette wave i.
At 1,283 minuette wave (iii) would reach 2.618 the length of minuette wave (i).
Subminuette wave ii may not move beyond the start of subminuette wave i above 1,374.81.
If price moves to new lows from here and remains below 1,340.21, then the degree of labelling within the impulse labelled subminuette wave i would be moved up one degree. It would be labelled minuette wave (iii). A final fifth wave down would then be expected in the same way as the first hourly chart is labelled.
At this stage, both wave counts see the correction which unfolded over Friday’s session as complete. Both wave counts expect a fifth wave down to unfold.
TECHNICAL ANALYSIS
WEEKLY CHART
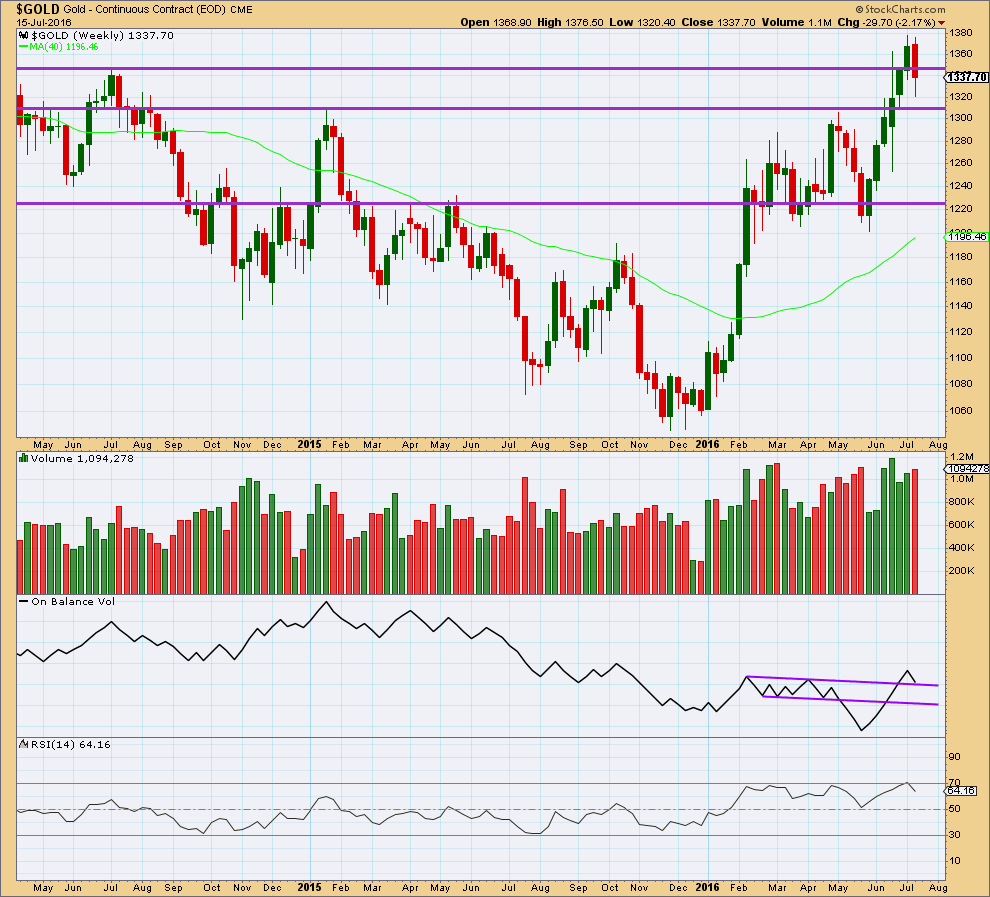
Click chart to enlarge.
This weekly candlestick completes a bearish engulfing candlestick pattern with higher volume. This is a strong bearish signal and strongly supports the wave count in expecting more downwards movement. If targets are wrong, they may be too high.
On Balance Volume has come down to find support at the upper purple trend line. This may offer some support. If OBV moves up and away from this line next week, it would be a reasonable bullish signal. A break below this line would be a reasonable bearish signal. The next line to offer support is not too far away but would still allow for a reasonable fall in price.
DAILY CHART
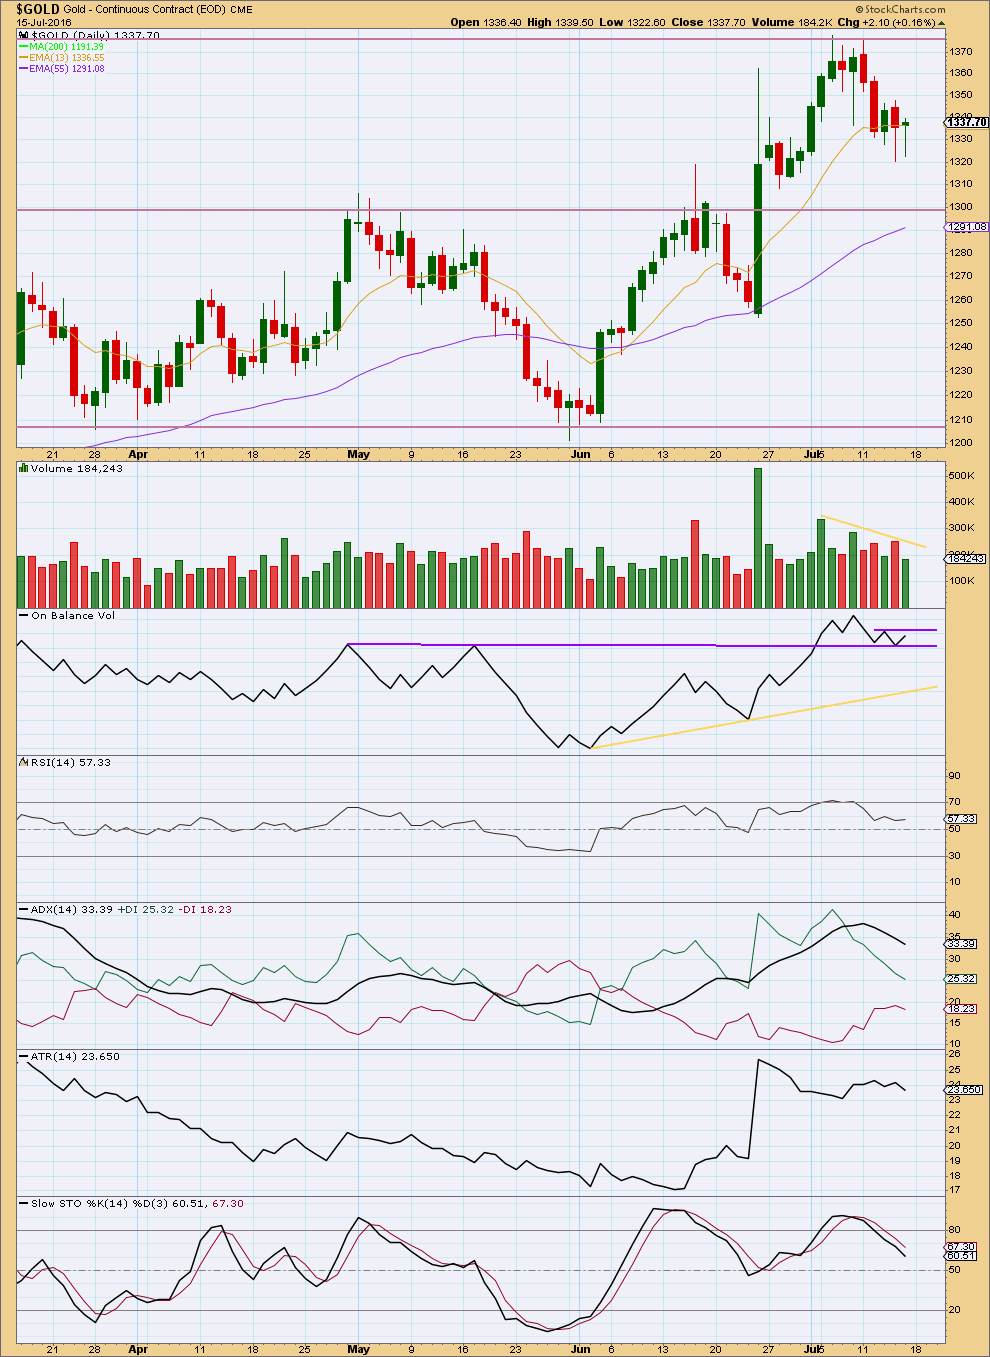
Click chart to enlarge.
Overall, volume continues to decline as price moves lower. The fall in price is not supported by volume. This looks like a counter trend pull back at this stage and not a new downwards trend. This supports the Elliott wave counts.
Friday’s green daily candlestick comes on lighter volume. The small rise in price was not supported by volume. This also supports a short term view that this pull back is not over.
This correction is not finding support at the 13 day moving average. The next average which may offer support to a deeper correction may be the 55 day moving average. Expect support at the horizontal trend line at 1,300.
On Balance Volume is finding support at the longer purple trend line. A break below this line would be a reasonable bearish signal. The upper purple line is redrawn to show resistance.
ADX is declining indicating no clear trend. ATR at the end of the week is also declining. This market may be expected to not be trending at this time.
RSI is returning from overbought.
With Stochastics returning also from overbought, it should be expected that a downwards swing in price continues until Stochastics is oversold and price finds support at the same time. That would be expected to be about 1,300 in a few days time. This fits neatly with the Elliott wave count expectations.
This analysis is published @ 04:28 a.m. EST on 16th July, 2016.
It looks like this sideways movement is a triangle. MACD is hovering at the zero line.
The analysis today will change slightly at the hourly chart level to see subminuette iv a triangle, which could be complete otherwise should be close to completion.
The breakout should be down.
Gold’s fifth waves out of its fourth wave triangles are often surprisingly short and brief. The target will still be for minuette (c) to move at least slightly below the end of minuette (a) at 1,305.59 to avoid a truncation and a very rare running flat.
GCQ (August Futures) likely Micro 1 is over at 1323.50 at 7:38.
If you have a squiggles chart, do post, TIA.
Re-trace back up to 1331-1333 likely?
Lara, hope you had a good weekend. I am wondering could you do a EW analysis for Brazil ETF “EWZ” when you could find the time? It seems it’s like gold which is bottoming. https://pensionpartners.com/fear-is-good/?utm_source=ReviveOldPost&utm_medium=social&utm_campaign=ReviveOldPost
There’s no way I’m going to find the time for that.
I have a few requests for extra analysis. But I also have had issues with pain from too much computer use.
I simply have to say no. Sorry.
Lara, OK and I understand that you already have a lot on your plate. Maybe in future… Anyways, I found an EW analysis chart for EWZ. Just in case if other members are interested in it. I know this is a gold forum. I don’t think I would post other charts here soon. Hope you feel better soon.
Here is my mediation and intention and prayers for you Lara.
“Lara Iriarte continues to be free of all pain. Lara is in absolutely perfect health for everything including computer use and lots of surfing.”
By the way, Omega 3 is very beneficial to reduce pain.
Fish oil, chia seeds, Sacha Inchi oil, etc. also tumeric and some other foods.
Thank you Richard 🙂
I do take fish oil daily. I’m super healthy.
Excellent for you and us!
This chart supports the lower target, but the length of B wave is concerning. What’s not noted on this chart is the last five weekly bearish engulfing candles occurred in the context of a bear market. I firmly believe gold is in a new bull market. Nonetheless if $1300ish gives way, I would expect $1250ish to off strong support. This would give gold about a $120 drop which is the lower range of the past 5 bearish weekly candlesticks.
Rambus on the Yen. Inverted H&S looks bullish and the correlation with gold is high. Should be very bullish for gold.
https://rambus1.com/2016/07/15/xjy-update-9/
Weekend reading!!!
Adam Hamilton is one of the best in PM sector circle. He just wrote another of gold article. His assessment sides with Lara’s wave count.
Long speculators long position went from lowest in Dec 2015 in several years to highest in 17.5 years in just six months.!!wow!!!
—————————————————————–
Gold’s record selling overhang
http://www.321gold.com/editorials/hamilton/hamilton071516.html
Dec 2015 article predicted gold’s upleg in 2016:
http://www.zealllc.com/2015/fg2016up.htm
…..It (COT report) revealed speculators’ total gold-futures long contracts held has soared to 440.4k!. This level is astounding, the highest seen in the 17.5 years of our dataset running back to early 1999 and almost certainly the highest ever witnessed. Speculators’ gold-futures longs are at all-time record highs!…..
Back on New Year’s Eve 2015 when gold remained universally despised and languished near major secular lows, I made a ridiculed contrarian bullish call on gold. I published an essay called “Fueling Gold’s 2016 Upleg” in which I concluded, “The bottom line is gold is poised for a mighty upleg in 2016” largely because “resulting bearishness left gold-futures speculators’ bets at epically anomalous levels”…….
……. So gold faces serious downside risks in the near-term until speculators’ excessive longs are mostly unwound. Record gold-futures long positions mean a record gold-futures selling overhang, and that will likely unfold rapidly due to futures leverage.
Hi Lara,
My husband is worried that Gold is taking off without us. When looking at your Hourly I chart, he is wondering if Submicro B of Micro Y (of Subminuette iv) could be seen as a truncated Subminuette v instead.
Thanks
That’s technically possible. But not very likely. It involves two truncations; the end of subminuette iv would be truncated, and the final fifth wave would also be truncated.
And the subdivisions of the fourth wave wouldn’t make sense.
If you or any other members really are concerned that the trend will run away without you then this is how I would approach that problem:
Take a long position. Put a stop just below 1,249.94. Invest no more than 3-5% of equity. Be prepared to have an underwater position for a few days, but at least you wouldn’t miss out.
Do your own due diligence using your own preferred technical analysis methods. Make your own judgement.
If you can’t find any technical reasons and still want to make the trade, then it’s based on emotion. Not the wisest approach, but as long as you manage risk in this case then it should most likely turn out okay in the end. And if it doesn’t, contain the loss.
This is a very helpful answer. Thanks!
Lara,
Nice analysis (Video incl.) thanks
Hoping it goes deeper in Count II, gives us better consolidation from the move up from 1201-1377 and a solid base for next strong move up in Minor 3.
Really think this correction is over done . Looking for move up on Monday IMHO stephen of New London CT
What technical reason makes you say that Stephen?
I’m listening, because you’re often right. What have I missed?
Stephen,
You might be right but when I looked at the change in COT position last Friday, there was NO change i.e. closing down the short position. The fact that these folks are still holding a large net short on both GOLD and SILVER tells me more downside is expected in the coming weeks/days.