
Downwards movement was expected to begin the new week.
Price has moved sideways in a small range, remaining below the invalidation point (which is close by) on the first Elliott wave hourly chart.
Summary: The trend is still up. A multi day correction against the trend is unfolding and still looks incomplete. A target for it to end is either 1,297 or just below 1,249.94. In the short term, the volume profile is still more bearish than bullish. A small pennant pattern suggests more downwards movement is likely.
New updates to this analysis are in bold.
Last weekly chart can be found here.
Grand SuperCycle analysis is here.
DAILY ELLIOTT WAVE COUNT I
Click chart to enlarge.
There are two wave counts today presented in order of probability.
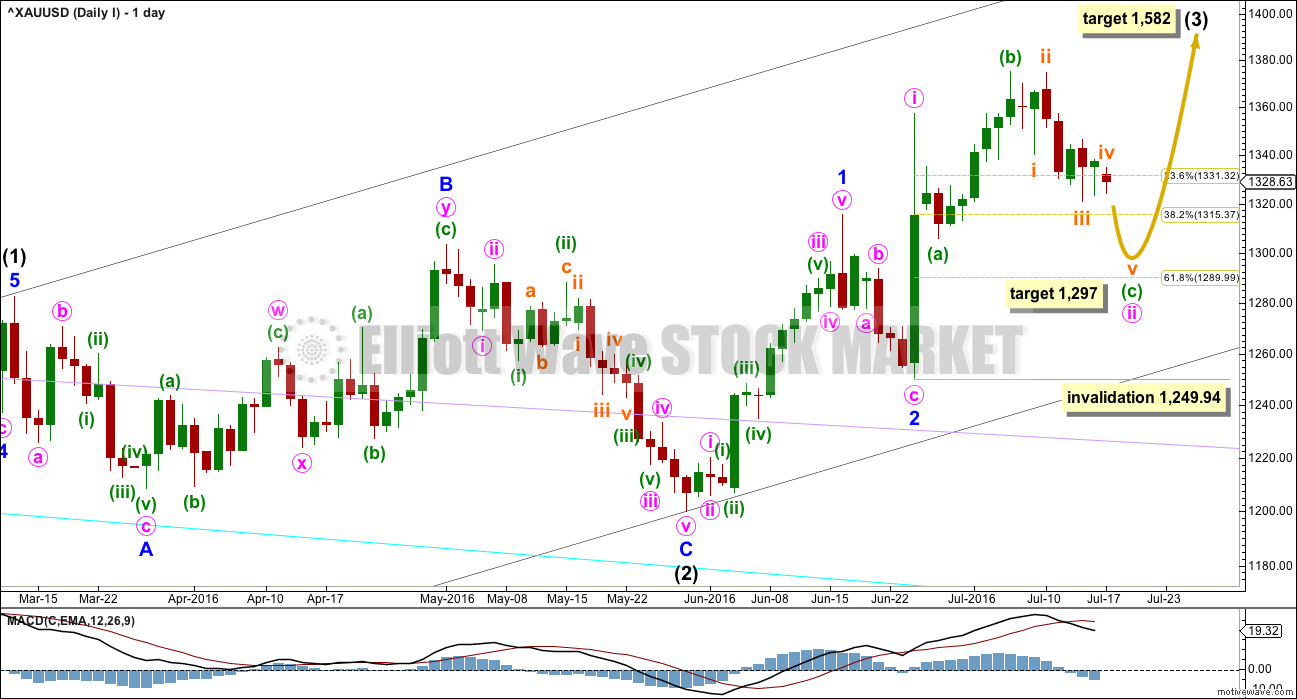
Intermediate wave (2) is a complete expanded flat correction. Price from the low labelled intermediate wave (2) has now moved too far upwards to be reasonably considered a continuation of intermediate wave (2). Intermediate wave (3) is very likely to have begun and would reach 1.618 the length of intermediate wave (1) at 1,582.
Intermediate wave (3) may only subdivide as an impulse.
So far minor waves 1 and 2 may be complete within intermediate wave (3). The middle of intermediate wave (3) may have begun and may also only subdivide as an impulse.
Within minor wave 3, minute wave i is complete. Minute wave ii may be continuing as an expanded flat correction. Expanded flats are very common structures.
Within minute wave ii, minuette wave (a) subdivides as a quick three wave structure. Minuette wave (b) subdivides perfectly as a zigzag and is a 1.34 length of minuette wave (a), within the normal range of 1 to 1.38.
It would be highly likely for minuette wave (c) to make at least a slight new low below the end of minuette wave (a) at 1,305.59 to avoid a truncation and a very rare running flat.
The target is now recalculated at subminuette degree at the hourly chart level. If this target is wrong, it may be a little too high. If price drops through 1,297, then the next target would be at 1,291 – 1,290 where minuette wave (c) would reach 1.618 the length of minuette wave (a), and minute wave ii would end at the 0.618 Fibonacci ratio of minute wave i.
Minuette wave (c) may only subdivide as a five wave structure, either an impulse or ending diagonal. So far it looks like the more common impulse.
Minute wave ii may not move beyond the start of minute wave i below 1,249.94.
HOURLY ELLIOTT WAVE COUNT I
Click chart to enlarge.
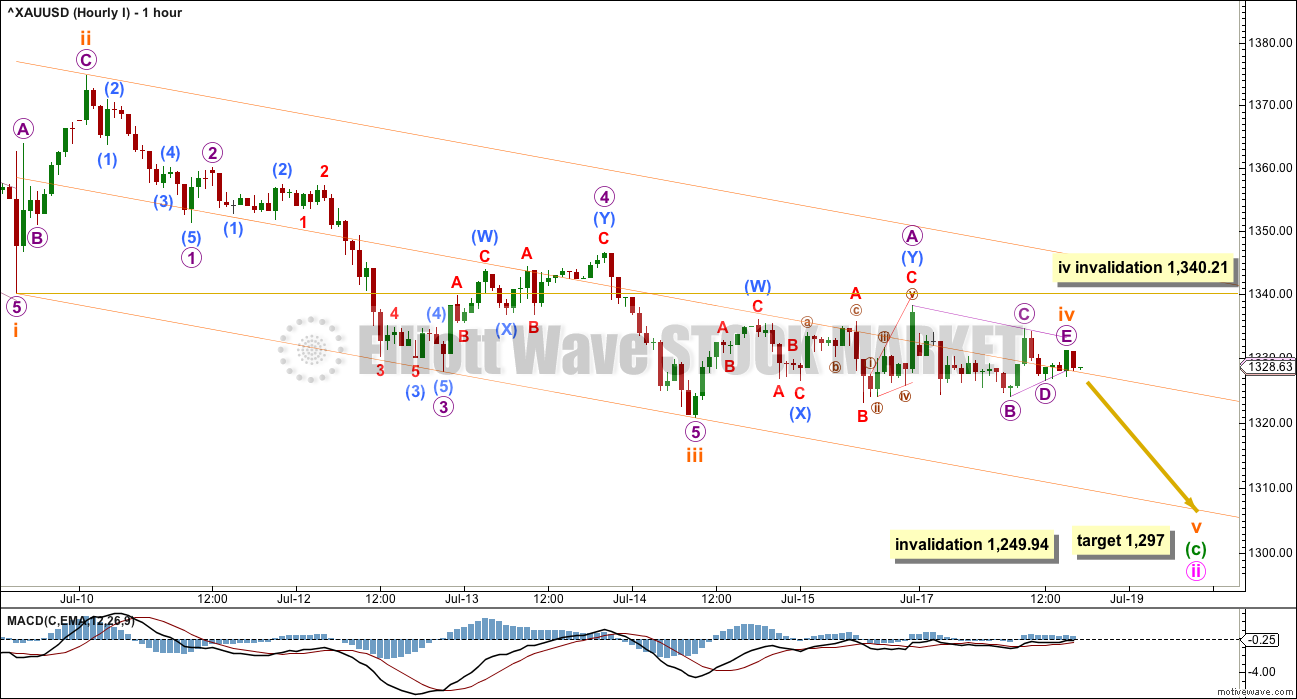
The current upwards movement should be expected to be subminuette wave iv while price remains below 1,340.21. If price moves above 1,340.21, then upwards movement should be expected to be micro wave 2. This idea is better shown in the second hourly chart below. If price moves above 1,340.21 before new lows are made, then the degree of labelling of subminuette wave iii would be moved down one degree. I would not consider the possibility that the whole structure of minute wave ii is over because minuette wave (c) would be truncated by 41.04. The truncation would be way to large for any serious consideration.
From the high labelled subminuette wave ii to the low labelled subminuete wave iii, a five wave impulse now looks to be complete. This may be subminuette wave iii in its entirety, or the degree of labelling within this impulse may be all moved down one degree and it could be only micro wave 1 within the impulse of subminuette wave iii.
If subminuette wave iii is over at the last low, then it was just 2.14 short of 1.618 the length of subminuette wave i. Subminuette wave iii exhibits stronger momentum than subminuette wave i, and the strongest portion is the middle of the third wave. This labelling is preferred while price remains below 1,340.21 because it has the right look.
Ratios within subminuette wave iii are: there is no Fibonacci ratio between micro waves 3 and 1, and micro wave 5 is 2.32 longer than equality in length with micro wave 1.
Subminuette wave iv looks like it has continued further sideways during Monday’s session to complete as a regular contracting triangle. MACD is hovering at the zero line while this unfolds, which supports the triangle. The triangle will remain valid as long as price remains below 1,338.29; if micro wave C of the triangle is continuing, then it may not move beyond the end of micro wave A.
Gold’s fifth waves to follow its fourth wave triangles are often surprisingly short and brief. If the triangle remains valid, then a short quick fifth wave down may complete in about one session. The minimum expectation for it to end would be at least slightly below 1,305.59, so that minuette wave (c) avoids a truncation. At 1,297 subminuette wave v would reach equality in length with subminuette wave i.
Draw a channel about this downwards impulse using Elliott’s first technique: draw the first trend line from the ends of subminuette waves i to iii, then place a parallel copy on the end of subminuette wave ii. Subminuette wave v may end about the lower edge of this channel.
Although Gold has a tendency to strong swift fifth waves, typical of commodities, the tendency of Gold to exhibit short and brief fifth waves after a fourth wave triangle is stronger. At this stage, if the triangle remains valid and price breaks out downwards as expected, it would be most likely to be short, brief and maybe relatively weak.
Subminuette wave iv may not move into subminuette wave i price territory above 1,340.21.
DAILY ELLIOTT WAVE COUNT II
Click chart to enlarge.
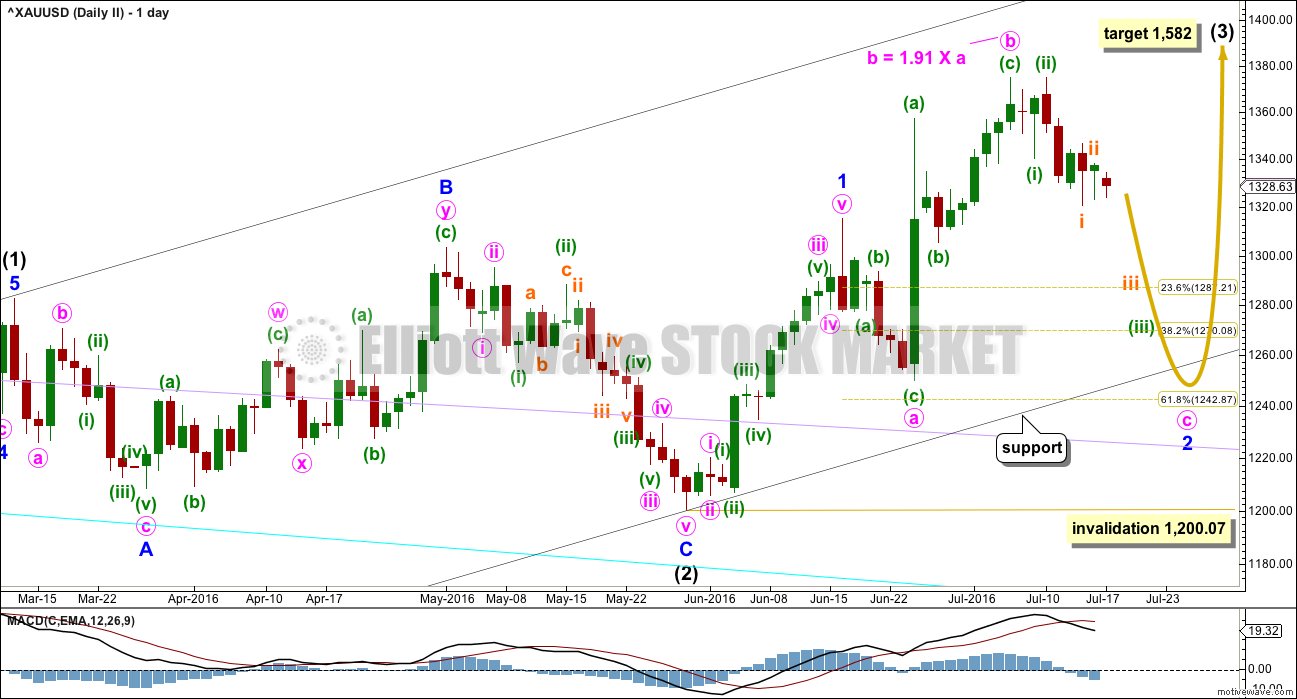
My bottom line is that intermediate wave (2) is highly likely to be over, so I must consider all possibilities for how intermediate wave (3) is starting from the low labelled intermediate wave (2).
What if minor wave 2 is not over? It may be continuing as an expanded flat correction. Again, these are very common structures.
The target for intermediate wave (3) is still the same at 1,582.
Minute wave b is a 1.91 length of minute wave a within the expanded flat of minor wave 2. This is longer than the common range for a B wave within a flat of 1 to 1.38, but still within the allowable convention of up to 2 times the length of wave A. However, it is close to the maximum, so this must reduce the probability of this wave count.
Minute wave c of the flat would be very likely to make at least a slight new low below the end of minute wave a at 1,249.94 to avoid a truncation and a very rare running flat. The 0.618 Fibonacci ratio of minor wave 1 at 1,243 would be a reasonable expectation to achieve this.
Minute wave c must subdivide as a five wave structure, either an impulse or an ending diagonal. So far an impulse looks more likely, and it is more common, so it should be expected in the first instance.
Within the impulse of minute wave c, the third wave of minuette wave (iii) looks like it may be extending. Again, this is a very common tendency for third waves, so this should be expected.
The target expects that minor wave 2 may overshoot the lower edge of the base channel about intermediate waves (1) and (2). This is possible, but it does reduce the probability of the target. The base channel is fairly likely to be respected and should offer strong support.
Minor wave 2 may not move beyond the stat of minor wave 1 below 1,200.07.
HOURLY ELLIOTT WAVE COUNT II
Click chart to enlarge.
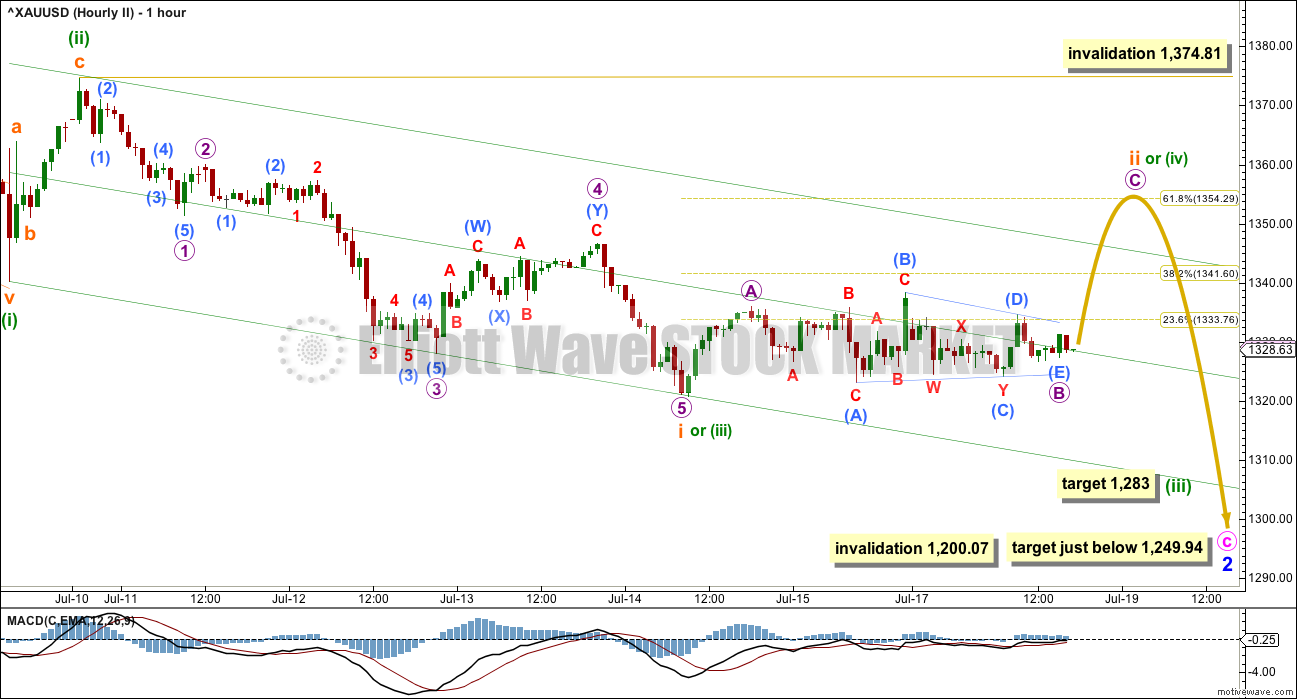
Structure and subdivisions at the hourly chart level for wave counts I and II are essentially the same, with the exception now of current sideways movement.
This second wave count has different degrees of labelling, but the idea is the same.
So far from the high labelled here minute wave b, there is a 5-3-5 down complete. This may be minuette waves (i), (ii), (iii) with price now in minuette wave (iv). Or it may be minuette waves (i), (ii), and within minuette wave (iii) only subminuette wave i is complete.
If only subminuette wave i is complete, then the current upwards movement may be another second wave correction for subminuette wave ii. It may have completed a double combination just short of the 0.382 Fibonacci ratio of subminuette wave i.
At 1,283 minuette wave (iii) would reach 2.618 the length of minuette wave (i).
Subminuette wave ii may not move beyond the start of subminuette wave i above 1,374.81.
If price moves to new lows from here and remains below 1,340.21, then the degree of labelling within the impulse labelled subminuette wave i would be moved up one degree. It would be labelled minuette wave (iii). A final fifth wave down would then be expected in the same way as the first hourly chart is labelled.
Triangles are very tricky structures. It is important to always consider alternates when it looks like a triangle is unfolding. What if the triangle is not the entire correction, but only wave B within the correction?
This correction may be another second wave correction unfolding as a zigzag. A new high above 1,338.29 would invalidate the triangle as it is labelled in the first hourly chart, and confirm this second hourly chart. At that stage, more upwards movement may be expected to complete a zigzag for another second wave correction.
If this correction is another second wave, then the likely target would be the 0.618 Fibonacci ratio at 1,354.
This second idea has a lower probability at the hourly chart level because now subminuette wave ii is much longer in duration than minuette wave (ii) one degree higher. It is the proportion between corrections which give a wave count the “right look”. This wave count no longer looks as good as the first idea.
All possibilities should be considered.
TECHNICAL ANALYSIS
WEEKLY CHART
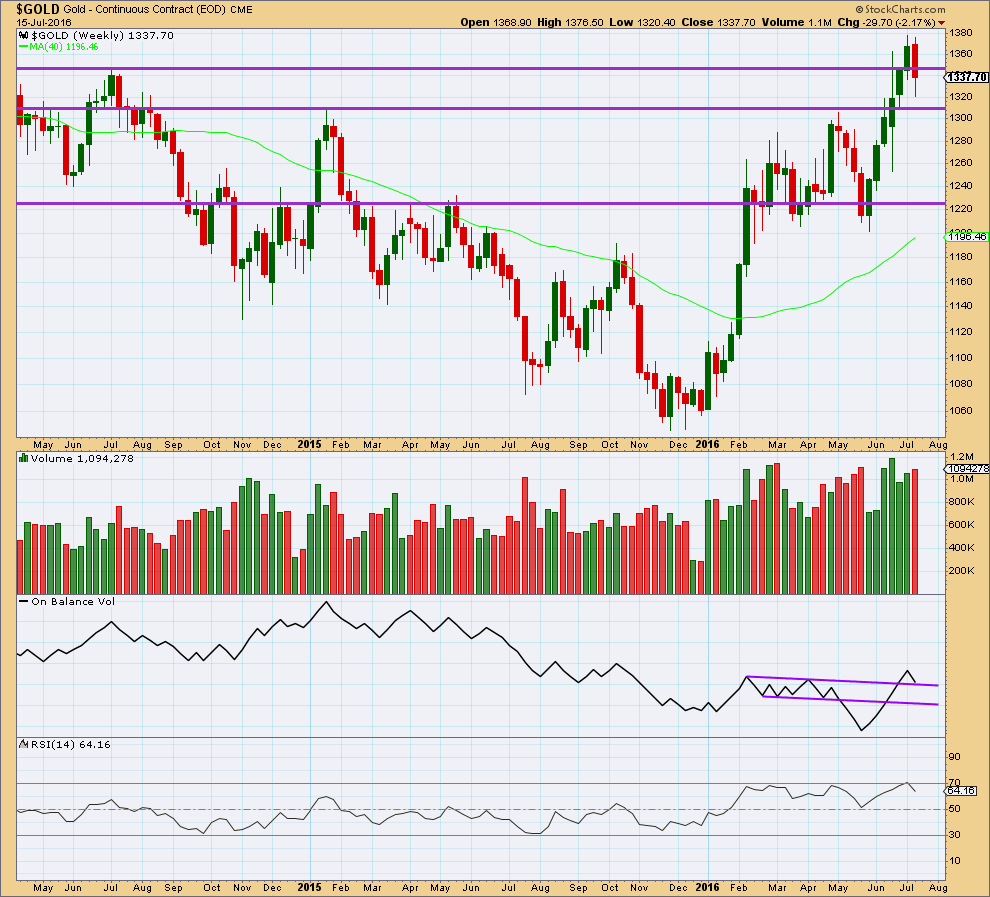
Click chart to enlarge.
Last weekly candlestick completes a bearish engulfing candlestick pattern with higher volume. This is a strong bearish signal and strongly supports the wave count in expecting more downwards movement. If targets are wrong, they may be too high.
On Balance Volume has come down to find support at the upper purple trend line. This may offer some support. If OBV moves up and away from this line this week, it would be a reasonable bullish signal. A break below this line would be a reasonable bearish signal. The next line to offer support is not too far away but would still allow for a reasonable fall in price.
DAILY CHART
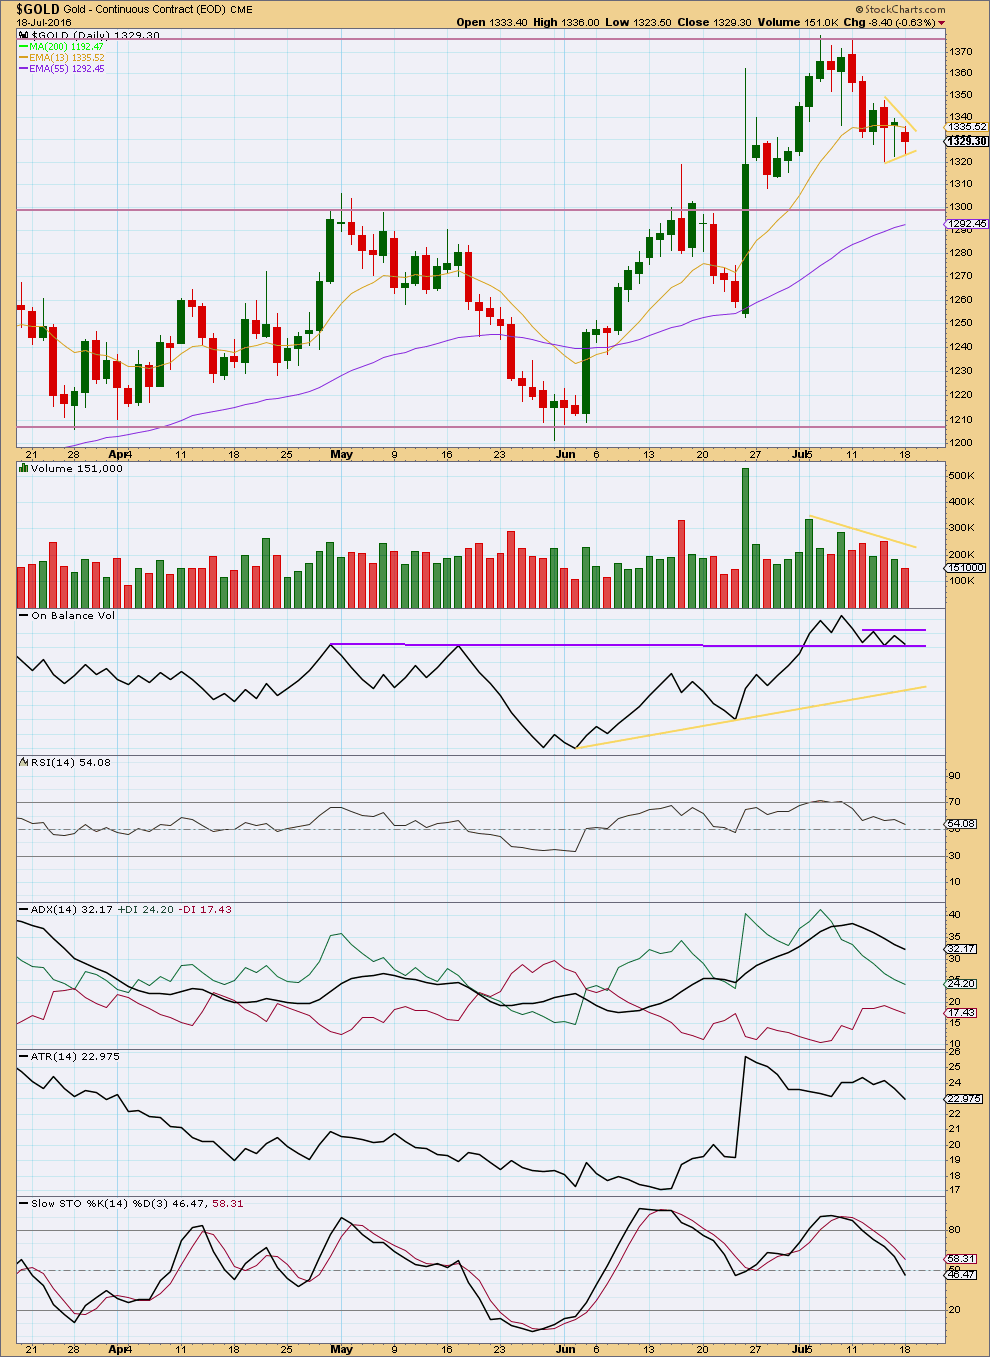
Click chart to enlarge.
Overall, volume is still declining as price moves lower. It is three downwards days for the last six sessions that still have stronger volume, so the short term volume profile may still be considered bearish.
The mid term volume profile is still bullish. Declining volume is characteristic of a correction, not a new trend.
In the short term, the last three sessions now form a small pennant pattern. This is a highly reliable continuation pattern. A downwards breakout would be expected. The target using a measured rule would expect $56 down from the breakout price point. The breakout would be confirmed with a break below the lower trend line of the pattern.
On Balance Volume has again come down to find support at the lower purple line. This line is now highly technically significant. A break below it would be a strong bearish signal. A break above the short upper line would be a very weak bullish signal.
RSI is now very close to neutral. There is room for price to rise again.
ADX has returned from extreme. It is currently indicating the market is not trending.
ATR agrees as it is declining.
Stochastics is now neutral. More downwards movement from price may be expected to continue until Stochastics reaches oversold and price reaches support at the same time. Price may find some support at the next horizontal line about 1,300. This fits neatly with the Elliott wave target.
This analysis is published @ 07:12 p.m. EST.
Any thoughts on the low from here?
Just trying to finalise my analysis… I was waiting for 6:30pm EST for StockCharts to finalise their volume data. It was showing a volume spike for todays small upwards inside day.
It’s after 6:30pm now and StockCharts still show a volume spike for today. But COMEX data shows lighter volume for today.
Who to believe?? It makes such a difference.
Sorry everybody. Analysis would have been published by now if it wasn’t for this.
Accuracy over speed any day of the week! Nail it Lara!
And the triangle meanders slowly sideways. The purpose of triangles is to take up time and test our patience.
I have a reasonable confidence in the first hourly wave count. Triangles are quicker structures than zigzags and so if this is a fourth wave counterpart to the prior zigzag of subminuette ii then even though it is much longer in duration, that’s okay.
For the second wave count this triangle is a B wave within a zigzag. But now that means a lower degree second wave for subminuette ii is much much longer in duration than a second wave of minuette (ii) one degree higher. And they’re both zigzags. So that is now a really big problem.
So in practice what all that means is, the probability of the first hourly chart is higher than the second by a fairly good margin. Maybe 90% likely vs 10%?
So the breakout from the triangle should be down.
A quick scalp to the downside if you’re watching it when it breaks may be a quick profit.
BEWARE though if any members try this, take profits quickly rather than trying to let this one run. Gold often exhibits surprisingly short and brief fifth waves out of it’s fourth wave triangles. As soon as price moves to a new low below 1,305.59 the trade should be exited, or a close trailing stop used.
A new low below the lower triangle trend line would likely be the start of the downwards breakout. A new low below 1,324.09 of micro B could not be micro wave D, so at that stage the triangle would have to be over.
As always, use a stop! Do not invest more than 3-5% of equity on any one trade.
Hi Lara
I wanted to share following article on long term perspective on Gold. And thought it will be appropriate to post it on your latest gold historical post. But it is closed to new comments.
BGMI and Gold Stock Targets By Plunger at Rambus.
https://goldtadise.com/?p=373048
Article does not review the miners valuation over time with respect to price of gold. Since 1964 this ratio BGMI to Gold has been in decline. When ratio goes down miners decline and when ratio rises miners rise.
So current valuation of miners is the lowest ever and now it has began to rise.
We do not know whether this is a significant change in uptrend in the ratio or not. Unless Lara does a grand super cycle EW analysis from 1930 to date.
Dreamer
Thanks for copying Lara’s response on grand super cycle from July 9th comment to Super cycle wave analysis post.
I was just started to do the same and saw you had already done it. You beat me to it!!!!LOL
Yes, a good idea. Thanks Dreamer!
You’re both welcome! ?