
A downwards breakout from a small pennant pattern has unfolded exactly as expected.
Summary: The trend is still up. A multi day correction against the trend is unfolding and still looks incomplete. A target for it to end is either 1,300 or just below 1,249.94. In the short term, the volume profile is still more bearish than bullish. A small pennant pattern suggests more downwards movement is likely.
New updates to this analysis are in bold.
Last weekly chart can be found here.
Grand SuperCycle analysis is here.
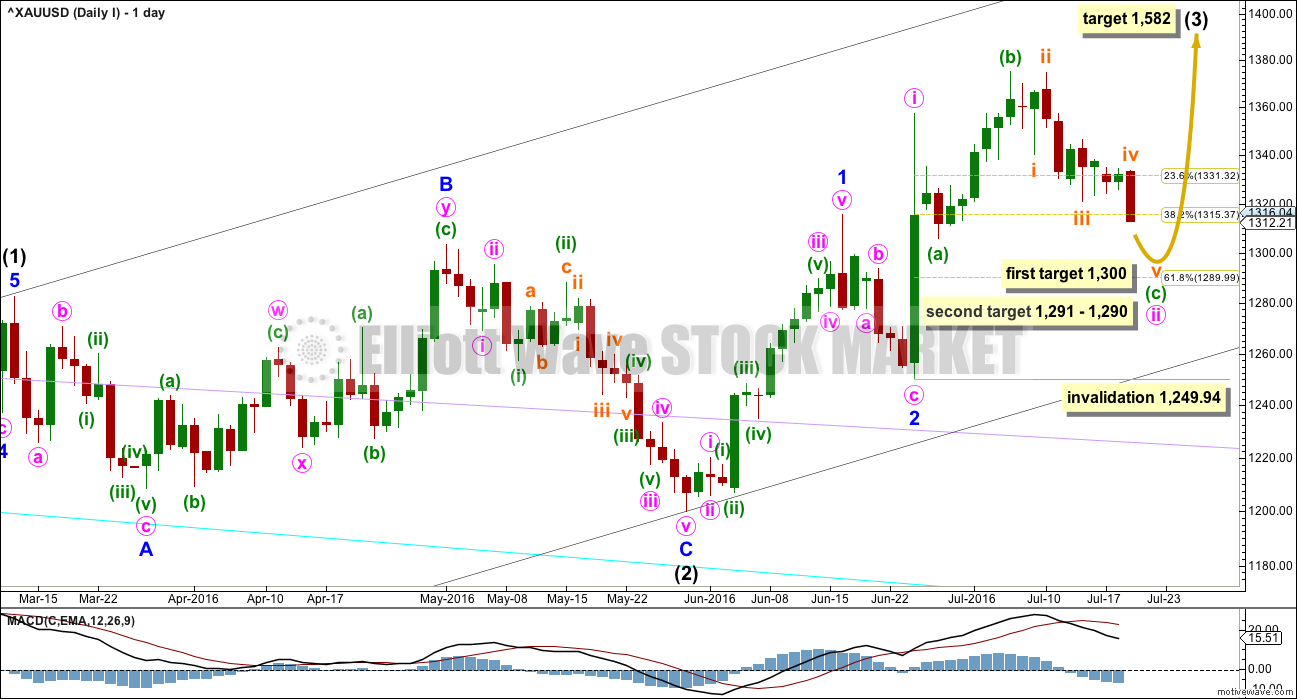
DAILY ELLIOTT WAVE COUNT I
Click chart to enlarge.
There are two wave counts today presented in order of probability.
Intermediate wave (2) is a complete expanded flat correction. Price from the low labelled intermediate wave (2) has now moved too far upwards to be reasonably considered a continuation of intermediate wave (2). Intermediate wave (3) is very likely to have begun and would reach 1.618 the length of intermediate wave (1) at 1,582.
Intermediate wave (3) may only subdivide as an impulse.
So far minor waves 1 and 2 may be complete within intermediate wave (3). The middle of intermediate wave (3) may have begun and may also only subdivide as an impulse.
Within minor wave 3, minute wave i is complete. Minute wave ii may be continuing as an expanded flat correction. Expanded flats are very common structures.
Within minute wave ii, minuette wave (a) subdivides as a quick three wave structure. Minuette wave (b) subdivides perfectly as a zigzag and is a 1.34 length of minuette wave (a), within the normal range of 1 to 1.38.
It would be highly likely for minuette wave (c) to make at least a slight new low below the end of minuette wave (a) at 1,305.59 to avoid a truncation and a very rare running flat.
The target is now recalculated at subminuette degree at the hourly chart level. If this target is wrong, it may be a little too high. If price drops through 1,300, then the next target would be at 1,291 – 1,290 where minuette wave (c) would reach 1.618 the length of minuette wave (a), and minute wave ii would end at the 0.618 Fibonacci ratio of minute wave i.
Minuette wave (c) may only subdivide as a five wave structure, either an impulse or ending diagonal. So far it looks like the more common impulse.
Minute wave ii may not move beyond the start of minute wave i below 1,249.94.
HOURLY ELLIOTT WAVE COUNT I
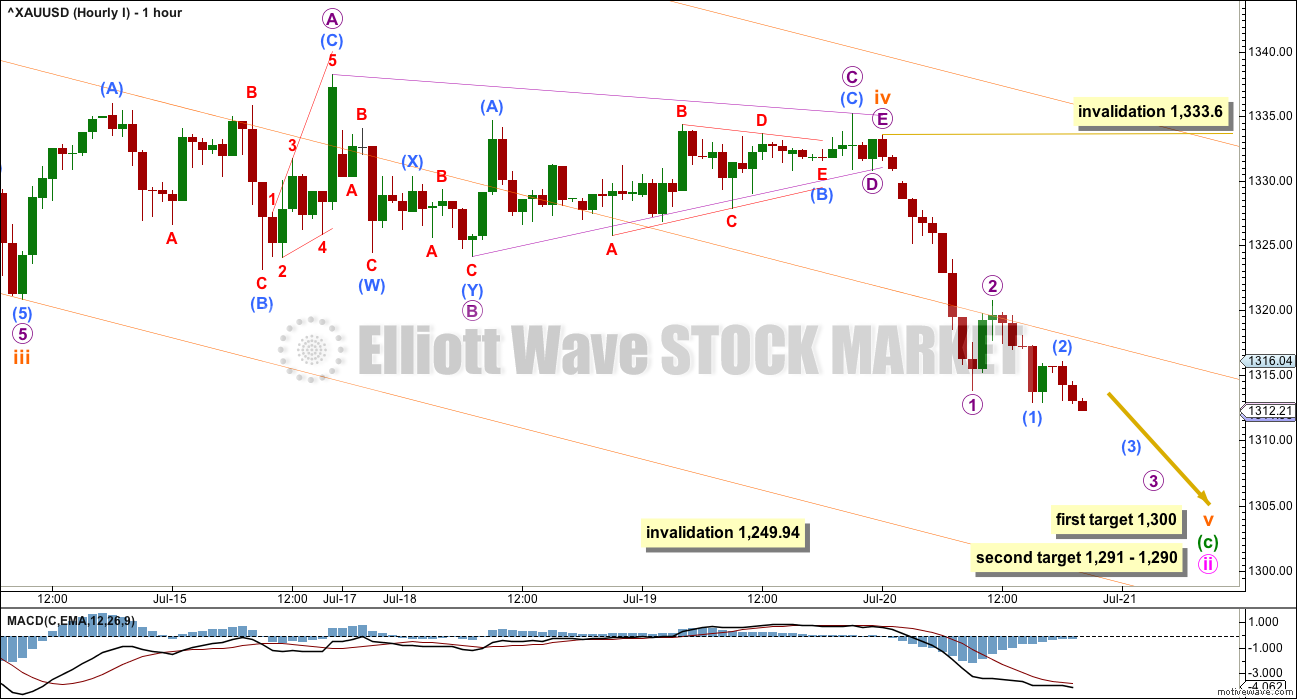
Click chart to enlarge.
The triangle for subminuette wave iv did not end as expected. Micro wave C moved further sideways with a whipsaw that breached the triangle invalidation point.
On the five minute chart, this is how subdivisions fit best for the triangle. All subwaves are zigzags or double zigzags; they all fit as threes.
The triangle is supported by MACD hovering at zero while it unfolded.
If subminuette wave v begins at 1,333.60, then at 1,290 it would reach equality in length with subminuette wave i. The second target is now calculated at two wave degrees and is also the 0.618 Fibonacci ratio. The second target now has a higher probability than the first target. It would also allow more room for subminuette wave v to unfold.
I keep the first target here though because it serves as a warning: if price reaches about 1,300, it should find support there. A small bounce at least may be expected at this area. If the structure of subminuette wave v could be seen as complete at 1,300, then it should be expected as very likely to be over. Gold often exhibits surprisingly short and brief fifth waves out of its fourth wave triangles. We have been surprised by this tendency before. I want us to all be prepared for this possibility in this instance.
Draw a channel about minuette wave (c) using Elliott’s first technique: draw the first trend line from the low labelled subminuette wave i (see this on the daily chart) to the low labelled here subminuette wave iii, then place a parallel copy on the high of subminuette wave ii (again, see this on the daily chart). Look for subminuette wave v to find support at the lower edge of this channel.
If the lower edge of this channel is clearly breached by strong downwards movement, then expect that targets are too high. That would be an indication that Gold may be ready to complete a swift strong fifth wave down.
Minute wave ii may not move beyond the start of minute wave i below 1,249.94.
DAILY ELLIOTT WAVE COUNT II
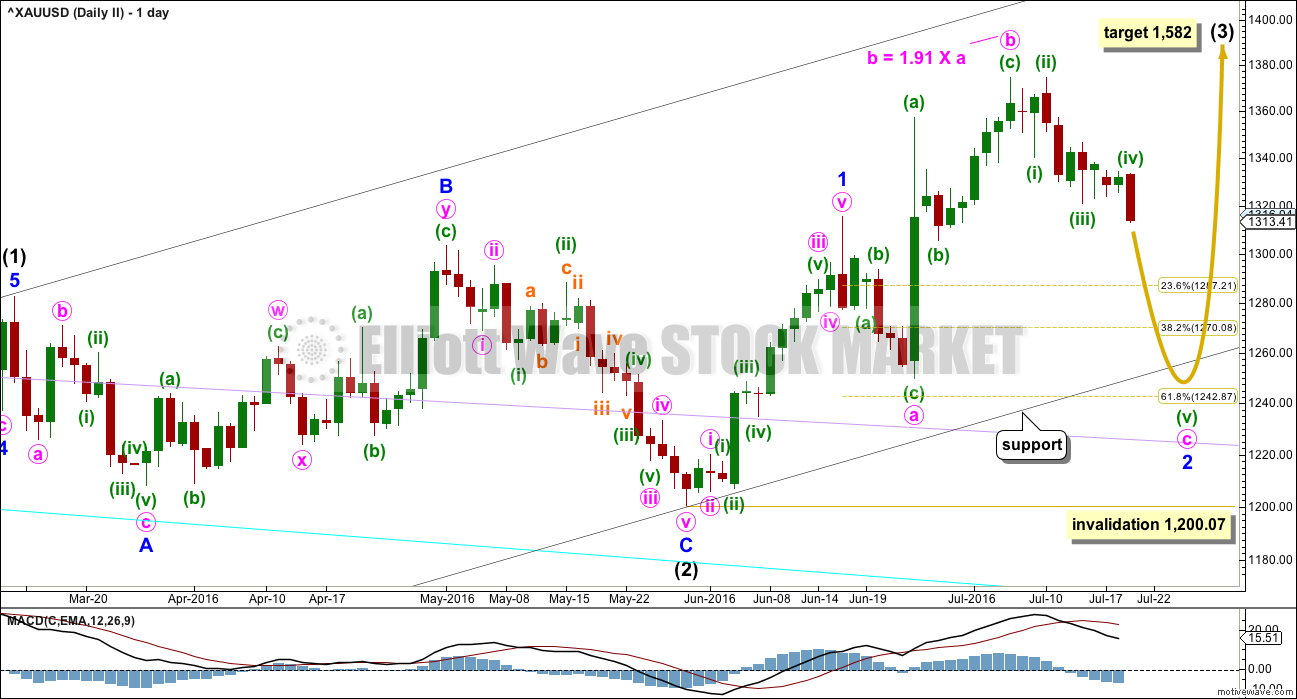
Click chart to enlarge.
My bottom line is that intermediate wave (2) is highly likely to be over, so I must consider all possibilities for how intermediate wave (3) is starting from the low labelled intermediate wave (2).
What if minor wave 2 is not over? It may be continuing as an expanded flat correction. Again, these are very common structures.
The target for intermediate wave (3) is still the same at 1,582.
Minute wave b is a 1.91 length of minute wave a within the expanded flat of minor wave 2. This is longer than the common range for a B wave within a flat of 1 to 1.38, but still within the allowable convention of up to 2 times the length of wave A. However, it is close to the maximum, so this must reduce the probability of this wave count.
Minute wave c of the flat would be very likely to make at least a slight new low below the end of minute wave a at 1,249.94 to avoid a truncation and a very rare running flat. The 0.618 Fibonacci ratio of minor wave 1 at 1,243 would be a reasonable expectation to achieve this.
Minute wave c must subdivide as a five wave structure, either an impulse or an ending diagonal. So far an impulse looks more likely, and it is more common, so it should be expected in the first instance.
Within the impulse of minute wave c, the third wave of minuette wave (iii) looks like it may be extending. Again, this is a very common tendency for third waves, so this should be expected.
The target expects that minor wave 2 may overshoot the lower edge of the base channel about intermediate waves (1) and (2). This is possible, but it does reduce the probability of the target. The base channel is fairly likely to be respected and should offer strong support.
Minor wave 2 may not move beyond the stat of minor wave 1 below 1,200.07.
HOURLY ELLIOTT WAVE COUNT II
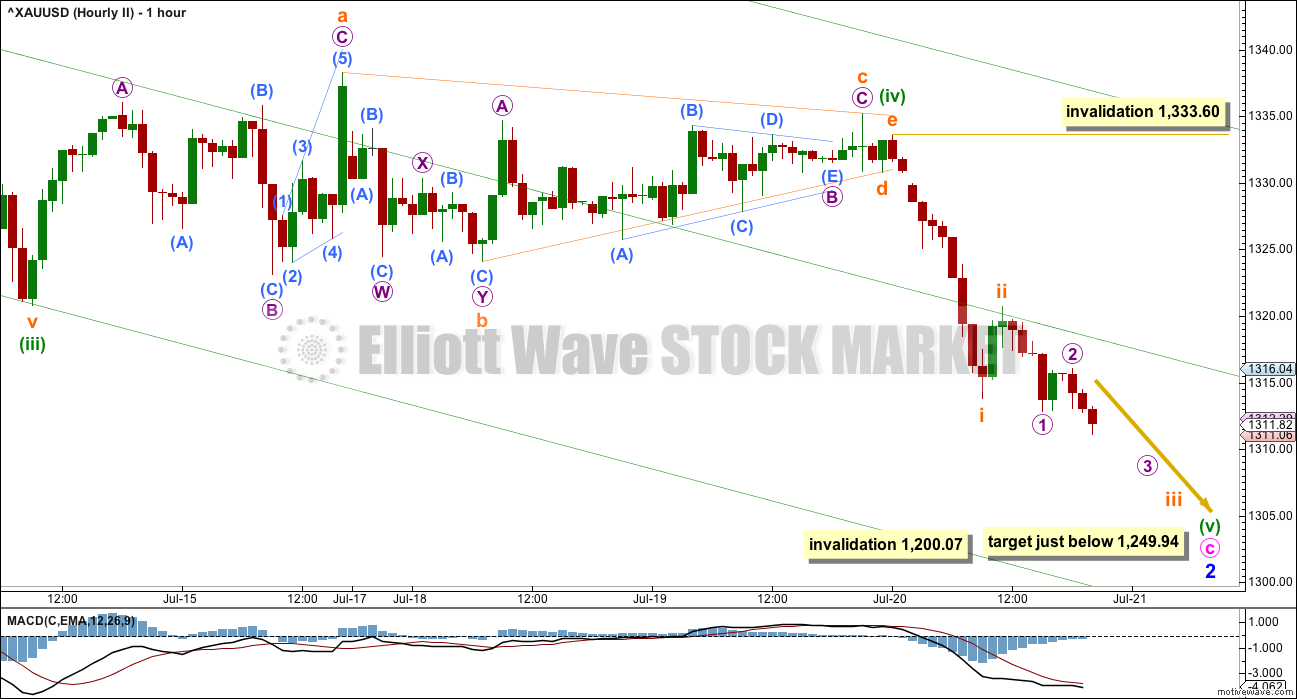
Click chart to enlarge.
Structure and subdivisions at the hourly chart level for wave counts I and II are essentially the same.
This second wave count has different degrees of labelling, but the idea is the same.
The target for this second wave count is for minute wave c to move at least slightly below the end of minute wave a at 1,249.94 to avoid a truncation and a very rare running flat.
TECHNICAL ANALYSIS
WEEKLY CHART
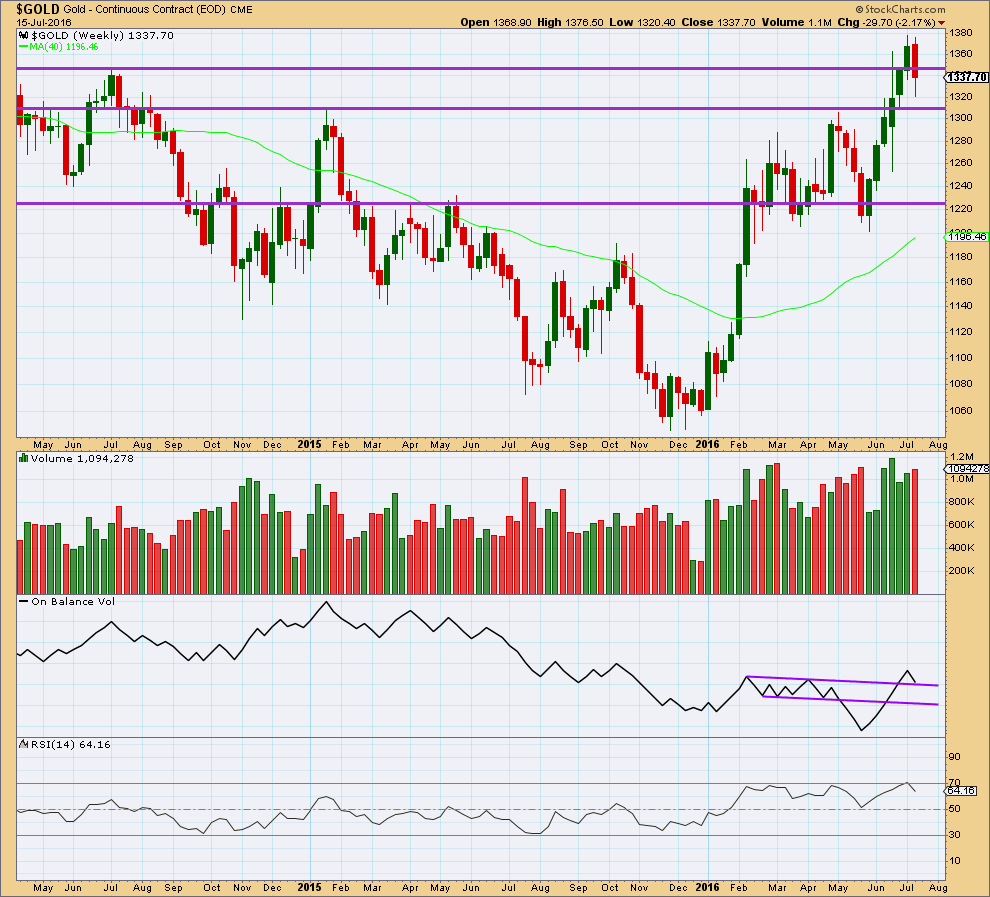
Click chart to enlarge.
Last weekly candlestick completes a bearish engulfing candlestick pattern with higher volume. This is a strong bearish signal and strongly supports the wave count in expecting more downwards movement. If targets are wrong, they may be too high.
On Balance Volume has come down to find support at the upper purple trend line. This may offer some support. If OBV moves up and away from this line this week, it would be a reasonable bullish signal. A break below this line would be a reasonable bearish signal. The next line to offer support is not too far away but would still allow for a reasonable fall in price.
DAILY CHART
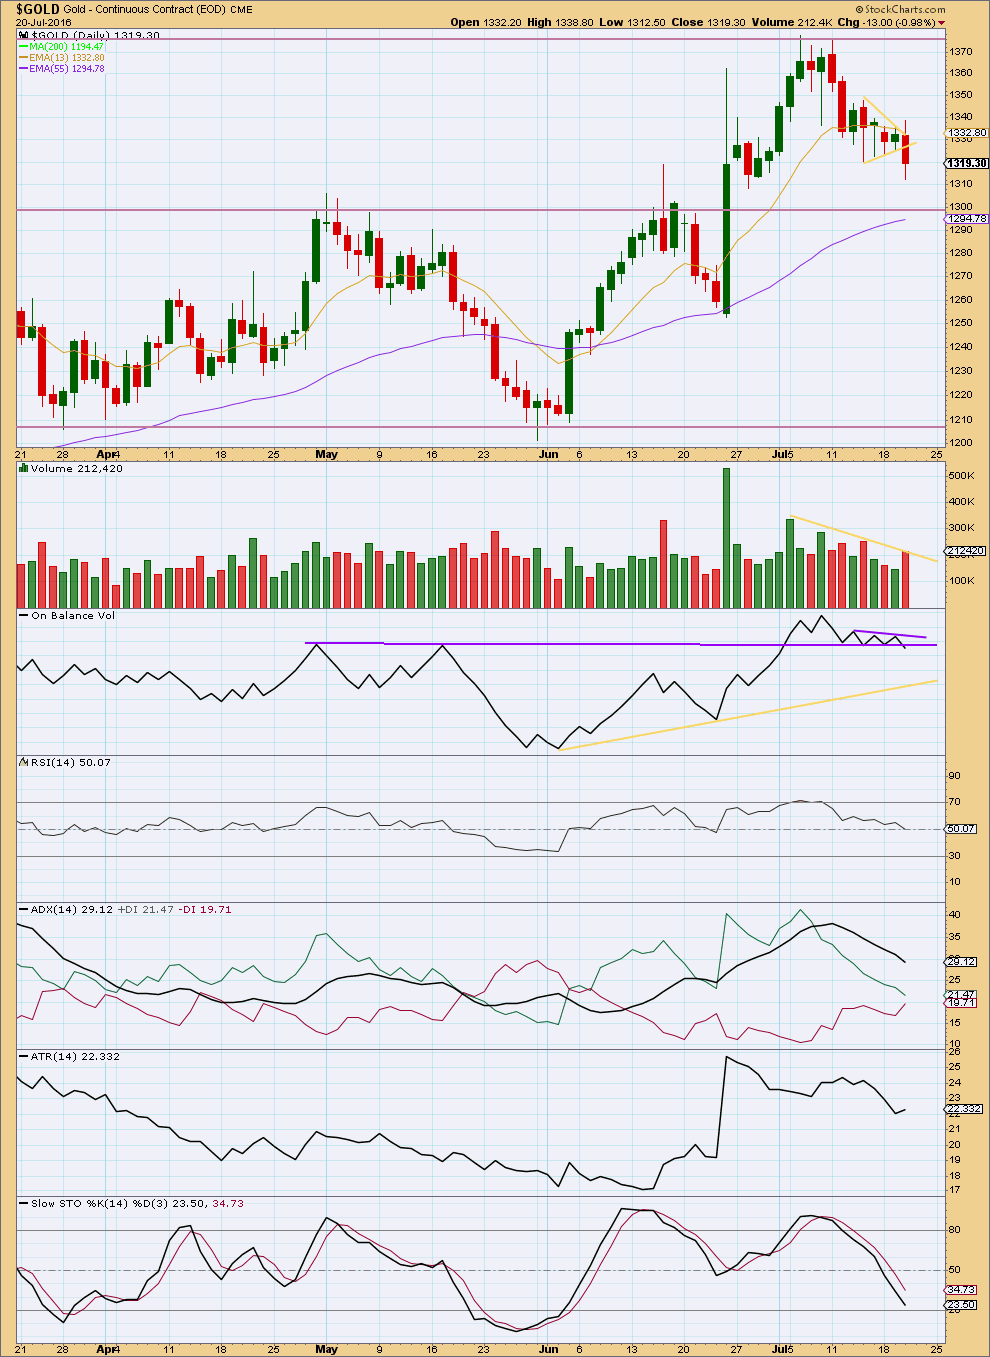
Click chart to enlarge.
Price has broken lower out of the small pennant pattern noted yesterday. A target for this downwards movement to end, using the measured rule, would be about 1,271.
The large difference in volume data for yesterday’s session between StockCharts and COMEX data is resolved. They now agree. Yesterday’s upwards session completed with lighter volume.
StockCharts data today shows an increase in volume for a downwards day. Overall, though volume is still falling as price falls, this market is overall falling of its own weight. There is not enough support from volume in this downwards trend to pull price strongly and sustainably lower at this stage. This looks still like a counter trend movement.
On Balance Volume may be breaking below the lower purple line. If the next session closes red with OBV moving lower, then the break would be clearer and that would then be a strong bearish signal. The next line to offer support for OBV is the yellow line, which is some distance away and which would allow for a reasonable fall in price.
RSI is now neutral. There is again plenty of room for this market to rise or fall.
ADX is strongly declining indicating the market is not trending. Overall, ATR still agrees although it is turning up today. This uptick needs to be longer lasting and stronger for ATR to disagree.
With ADX and ATR mostly in agreement, it should be expected that this downwards movement is a counter trend movement particularly as this view is supported by declining volume. Look for support about 1,300 and the Fibonacci 55 day moving average. Expect price to continue lower to find support and not end the fall until Stochastics is oversold at the same time.
Stochastics is not yet oversold. Price has not yet found support. More downwards movement is indicated. This fits with the Elliott wave count.
This analysis is published @ 09:25 p.m. EST.
I think it’s over folks.
I want to change the wave count a bit. But the bottom line is that the correction looks over now.
Short term a pull back may offer a good entry to join the upwards trend.
There is almost a bullish engulfing candlestick pattern, but not quite. It’s a piercing pattern. Still bullish, but not as bullish as the engulfing pattern. It has higher volume today, supporting the idea of a trend change here.
I can’t agree with you yet. there was absolutely no volume in the GLD etf today which is also a good gauge based off experience. Wasn’t there a bearish engulfing candle on the weekly gold futures chart just last week? I posted it a few days ago I think. if so, I’d be shocked if the correction is over. This looks like a correction of $1377-$1310. A truncation usually results in a more violent move in opposite direction. I can’t say that’s what happened today despite the gains.
I’m looking at StockCharts data and its showing me an increase in volume for todays upwards day. Not huge volume, but definitely an increase over yesterday.
Which is completing a bullish piercing pattern.
Those and the EW structure are the two things that make me think this is over now.
Yes, there was a bearish engulfing pattern on the weekly chart. Which was followed by another red weekly candlestick so far…. and some downwards movement.
The engulfing pattern means a trend change from up to down or sideways. It may have been resolved now by some downwards moment, and that’s the problem with candlestick reversal patterns. They say nothing about how far or for how long the next move after the reversal should go.
But I do agree it looks rather brief following that bearish engulfing pattern.
On balance I’m going to have to go with daily volume as I see it on StockCharts.
What about moving the previous 5 wave pattern down one degree and this is a second wave correction.
? I’m not sure what you mean Daniel.
It is a second wave correction, the thing is I can now see the structure is complete.
Steve
Trying to understand your comment plus previous of $1350 earlier today.
So you think overall trend is up but still downwards movement? To where?
Buy on pullback great, thanks Lara.
Gold futures settle higher after touching a 1-month low
July 21, 2016 2:39 p.m. ET
http://www.marketwatch.com/story/gold-futures-edge-up-after-earlier-dip-to-a-1-month-low-2016-07-21
This doesn’t look right.
I suspect that minute ii may be over with a 7.25 truncation. That the fifth wave out of the fourth wave triangle down was surprisingly short. That’s happened before.
This deep correction looks too deep for micro wave 2. It doesn’t look right.
I guess if Minute 2 was finished in a truncation would surprise most of people. Anyways, I trade or invest in intermediate and long terms. I am just not very good at trading in short term corrective waves. Good luck everyone!
GCQ if we can O/L at 1323.70 will confirm we have an a,b,c for Micro 2 or else a iv and v up to come yet . ?
Lara’s main hourly I chart is still valid now as gold high today of 1332.16 at 12:35 pm still under Lara’s invalidation point of 1,333.60.
The last 30 minutes both gold and NUGT multi time frame indicators are turning bearish.
NUGT bottom Wednesday 3:57 pm at $122.75 just now top of 5th maybe 11:51 am at $139.65?
NUGT and gold both very bullish today.
Would be nice to see them peak and drop at least deeper than yesterday.
what is significant about 1350? Why would it go to there?
No significance other than 61.8% retrace. It’s pretty clear now this correction is correcting $1377-$1310
Likely peak of Micro 2 here at 11:44 now?
1331.26 is 0.886 retrace in my count.
Currently high at 1331.16.
As an experienced trader, it’s always dangerous to look for 3rd waves up or down at any degree. With that said, I think daily count 1 is becoming less probable with today’s price action. Looks like 5 down to $1310 so this retrace could go all the way towards $1350. The bigger picture is unclear to me as of now, but the trend is still up as Lara suggests
I’m beginning to think that the low of 1310.88 could be micro 1 (and not 1313.63 with the attendant expanded flat of micro 2 that Lara surmised; anyway, that would be invalidated above 1325.82 when sm c = 2 sma. Already, at 1324.72, sm c = 1.85 sma).
This count has invalidation point 1333.88. To me, it has the better look. At 1324.72, subminuette 2 is slightly less than 0.618 of subminuette 1.
An alternative would be as nickforex pointed out, that 1310.88 marked the end of Minuette C, and therefore Minute 2, and we are now rising in Minute 3. The problem with this is that Minute 2 sees a truncation of 4.53.
So, on balance, I’m playing for my count unless proven otherwise.
Top sub micro (C) 1323.59 at 5:49 am then 1314.72 at 922 am bottom 1st near top 2nd near 1323.59 then down deep in 3rd of 3rd.
Something may not be right was supposed to stay below 1323.59 and just hit 1324.12 at 10:26 am.
looks like 1310 could have been the low. We are either in a wave 2 of 5 or the start of minute III in minor 3 of intermediate 3
I would prefer Lara’s take – I don’t trust those guys at EWI
Thanks Dreamer
Thanks for the update Lara. Any chance of updating USD/JPY – looks like a wave 2 retracement going on.
You are in luck since EWI has free forex week
Short term update for Gold:
The last wave down now looks like a complete three.
A fifth wave may not subdivide as a three (with the exception of a fifth wave within an ending diagonal, and that’s not the structure here) and so the conclusion is downwards movement should continue if this last wave down is a three.
Short term an expanded flat may complete. At 1,322 sub micro (C) = 1.618 X sub micro (A).
Then a third wave down should follow.
Lara,
Thank you for very timely excellent update, sliding in a Micro Wave 3 now.
GDX had a strong move down today on high volume, although volume was still below the very high up volume on June 3. This implies that the trend is still up.
The move down hit and then closed just above the lower targets that I had for Minute ((c)). Minor 4 could be complete today, but with gold expected to drop further, it seems that GDX may drop further also.
GDX is close to trend channel support and only 3.9% above Minor 4’s invalidation point. Hopefully the trend channel will hold as a confirmed break could mean that a higher level correction is due.
Here’s the daily with the channel shown and two critical support levels.
Stockcharts Daily. Note that On Balance Volume is still above the trend line and has a little room to move lower without a breach. A breach of the trend line would be more bearish.
Most excellent GDX analysis, thank you Dreamer for sharing!
Thanks Lara. If gold is to remain on track with Intermediate 3 and higher targets, then I would think the GDX trend channel should hold at least until it reaches Intermediate 4 or maybe to the end of Intermediate 5.
That said, if GDX Minor 4 gets invalidated, then your expertise will be needed to rework the GDX daily count…
Dreamer, I appreciate your analysis! 🙂
Amazing GDX charts Dreamer, thanks a lot.
Thanks!