
The main Elliott wave count from last analysis expected price to move higher, which is what has happened.
Summary: At this stage, a third wave up is still the more likely scenario, but it remains possible a deeper second wave correction could be completing first. If a new high is made in the next 24 hours, then if there is any divergence with price and RSI or MACD, then a counter trend movement should be expected. The trend is up. Downwards corrections are an opportunity to join the trend. Expect overall upwards movement over this next week to a target at 1,437 short term, and longer term at 1,582.
New updates to this analysis are in bold.
Last weekly chart can be found here.
Grand SuperCycle analysis is here.
DAILY ELLIOTT WAVE COUNT
Click chart to enlarge.
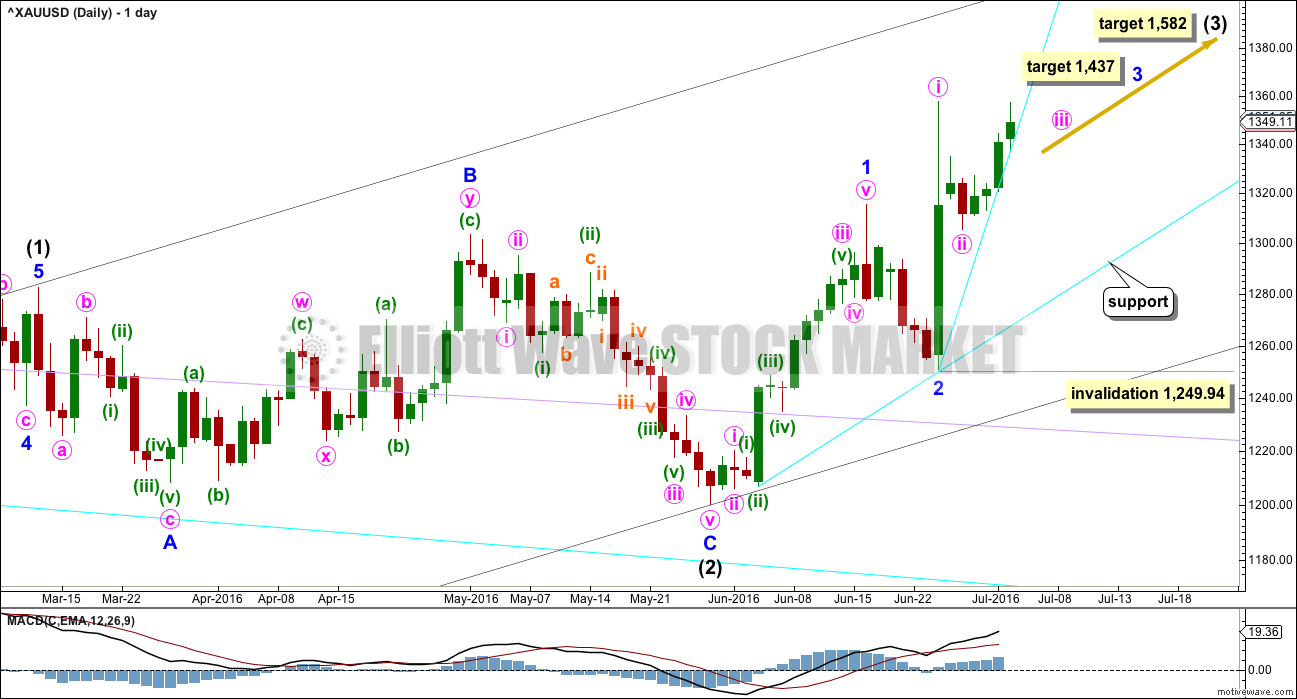
Intermediate wave (2) is a complete expanded flat correction. It is a shallow 0.350 correction of intermediate wave (1) lasting 56 days, just one more than a Fibonacci 55. There is no Fibonacci ratio between minor waves A and C. Minor wave C is a complete impulse.
I have looked back at the last two big cycle degree up movements within the last bull market: the first move from the low at 255.05 in April 2001, and the next move from the low at 682.75 in October 2008. Within the first move, the beginning series of corrections were 0.76, 0.6 and 0.96 in depth. Within the second move, the beginning series of corrections were 0.82, 0.68, 0.57 and 0.45. Early corrections within a new trend are most often deep.
Minor wave 2 may have been a quick, deep 0.57 zigzag over in just six sessions. If minor wave 3 has begun there, then at 1,437 it would reach 1.618 the length of minor wave 1.
When minor wave 3 is complete, then the following correction for minor wave 4 may be relatively brief and shallow. Intermediate wave (3) may end with a strong blowoff top typical of commodities. This may pull minor wave 4 up forcing it to be over very quickly. For position traders, the target of intermediate wave (3) may be more useful than a target for minor wave 3.
Add a base channel (black lines) to intermediate waves (1) and (2). Draw the first trend line from the low at 1,046.27 on 3rd December, 2015, to the low labelled intermediate wave (2), then place a parallel copy on the high of intermediate wave (1). Along the way up, downwards corrections should find support at the lower edge of the base channel, if they get that low. At this stage, it looks like corrections are shallow and may not reach back down to the base channel.
Minute wave ii may not move beyond the start of minute wave i below 1,249.94.
At 1,582 intermediate wave (3) would reach 1.618 the length of intermediate wave (1).
Add a support line, drawn here in cyan. Along the way up, if another relatively deep correction arrives, then it should find support at this line. Another very steep support line is added today. This steep line is very likely to be broken, sooner rather than later. If it is, then a correction has begun which may complete a red daily candlestick or doji.
MAIN HOURLY ELLIOTT WAVE COUNT
Click chart to enlarge.
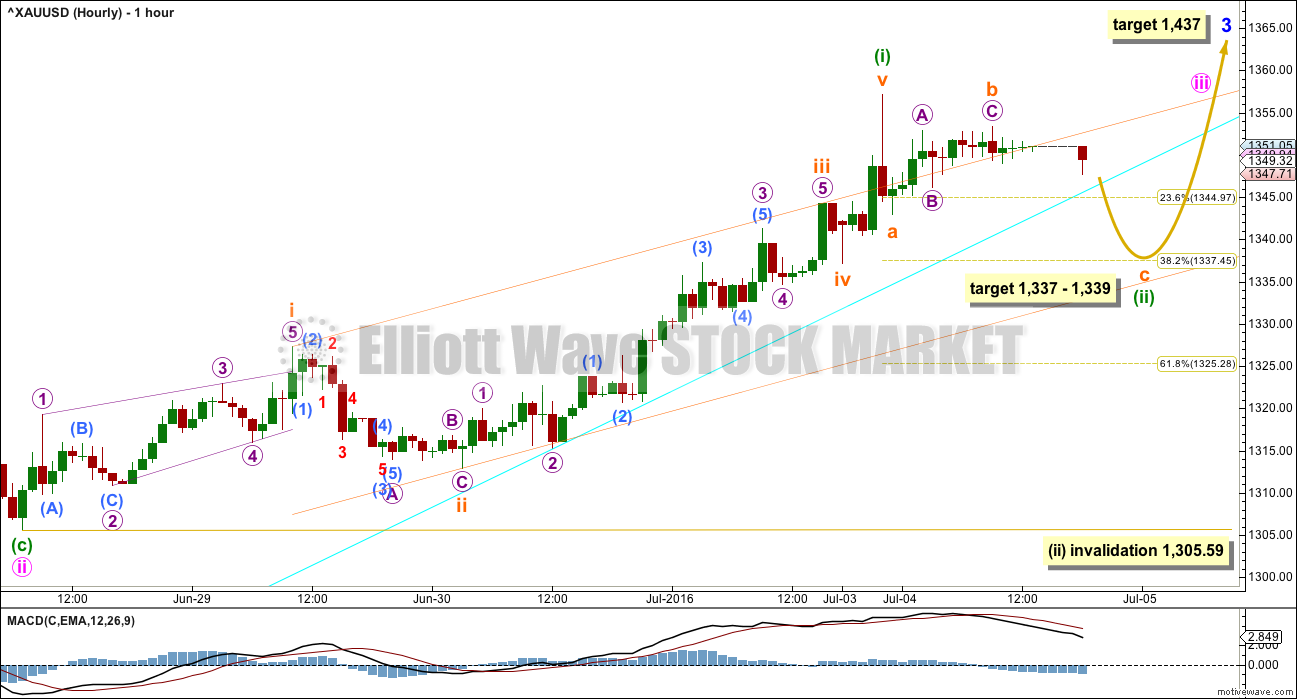
This wave count today sees minute wave ii over as a complete zigzag ending just below the 0.382 Fibonacci ratio as a relatively shallow 0.48 correction.
If this is correct, then a third wave up may be underway. The target for minor wave 3 remains the same. At 1,437 minor wave 3 would reach 1.618 the length of minor wave 1.
If minute wave ii was very quick as labelled, then minute wave iv may be quicker still. A target is not given for minute wave iii because the following correction for minute wave iv may be too quick to show up on the daily chart.
Minute wave iii may only subdivide as an impulse. It looks like the first wave within it, minuette wave (i), may now be complete.
Minuette wave (ii) should unfold lower and may not move beyond the start of minuette wave (i) below 1,305.59.
So far minuette wave (ii) may be unfolding as a relatively quick and simple zigzag. Subminuette waves a and b may be complete. At 1,339 subminuette wave c would reach equality in length with subminuette wave a. This is fairly close to the 0.382 Fibonacci ratio of minuette wave (i) at 1,337 giving a $2 target zone for a small correction to end. If it is time consuming enough, it may show as a small red daily candlestick or a small doji.
Draw a channel using Elliott’s first technique about this impulse unfolding upwards. Draw the first trend line from the ends of subminuette waves i to iii, then place a parallel copy on the end of subminuette wave ii. Look for corrections to find support at the lower edge while minuette wave (i) is still unfolding. If the lower edge of this channel is breached, then a deeper correction for minuette wave (ii) may be underway.
However, the lower edge of this channel may not be breached by minuette wave (ii). As a third wave begins to develop momentum, the corrections within it may begin to be more brief and shallow.
Price is still within minute wave i territory. Any long positions opened below 1,357.51 may be held for a longer time frame (if that is your trading style) because when minute wave iii is complete the following correction for minute wave iv may not move below 1,357.51. When minor wave 3 is complete, the following correction for minor wave 4 may be expected to be quite brief and shallow. Price action right up to the end of intermediate wave (3) may increase in momentum with corrections becoming more brief and shallow, until a blowoff top is seen.
ALTERNATE HOURLY ELLIOTT WAVE COUNT
Click chart to enlarge.
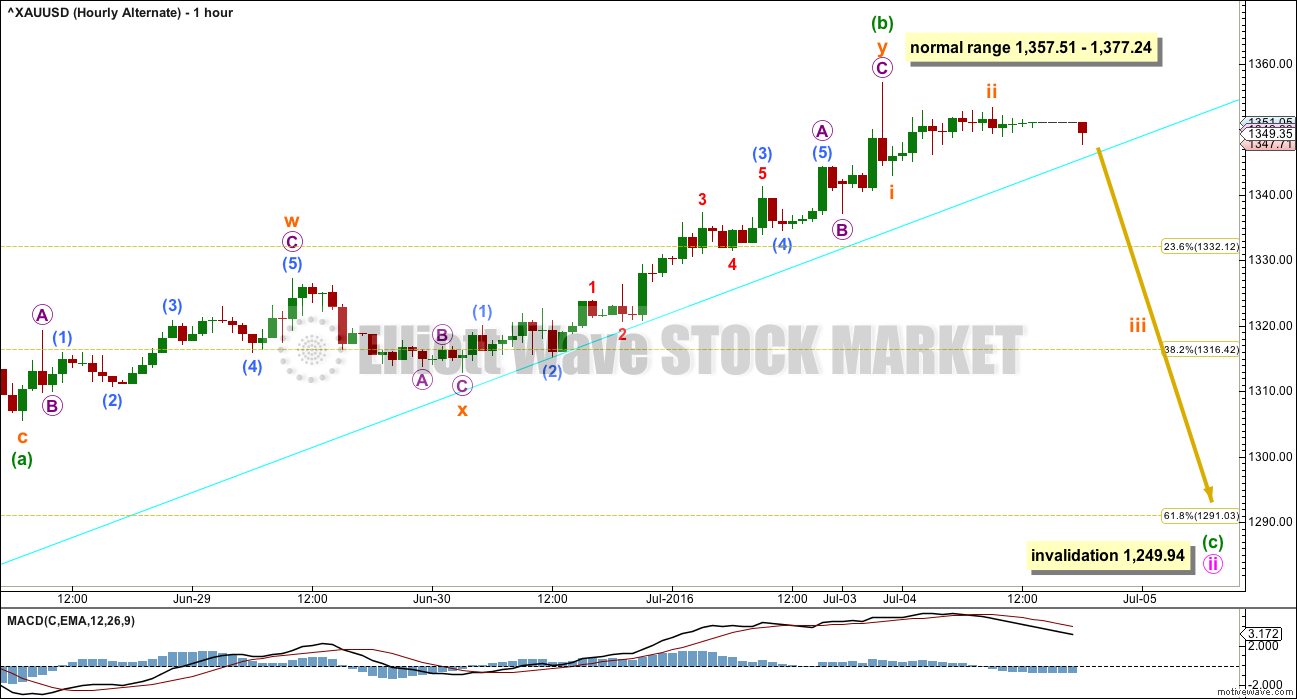
Minute wave ii may still be unfolding as a flat correction.
If minute wave ii is unfolding as a flat correction, then within it minuette wave (a) is a completed three, a zigzag. Minuette wave (b) must subdivide as a three and must be a minimum 0.9 length of minuette wave (a) at 1,352.32.
Minuette wave (b) may be complete as a double zigzag. Minuette wave (b) has passed the minimum 0.9 length of minuette wave (a), so the rule for a flat correction is now met. Minuette wave (b) is 0.99 the length of minuette wave (a). While price continues to print green daily candlesticks, has not made a new high and remains above the new steep cyan support line, it will remain possible that minuette wave (b) could continue higher. There is still no upper invalidation point for this alternate; a new high does not necessarily mean this alternate cannot be correct.
The normal range for minuette wave (b) within a flat is 1 to 1.38 the length of minuette wave (a) giving a range of 1,357.51 to 1,377.24. A new high above 1,357.51 may still be part of minute wave ii as in an expanded flat, which are very common structures.
If a new high is seen, then careful attention to volume and RSI will indicate the probability of this wave count vs. the main hourly wave count.
TECHNICAL ANALYSIS
DAILY CHART
Click chart to enlarge.
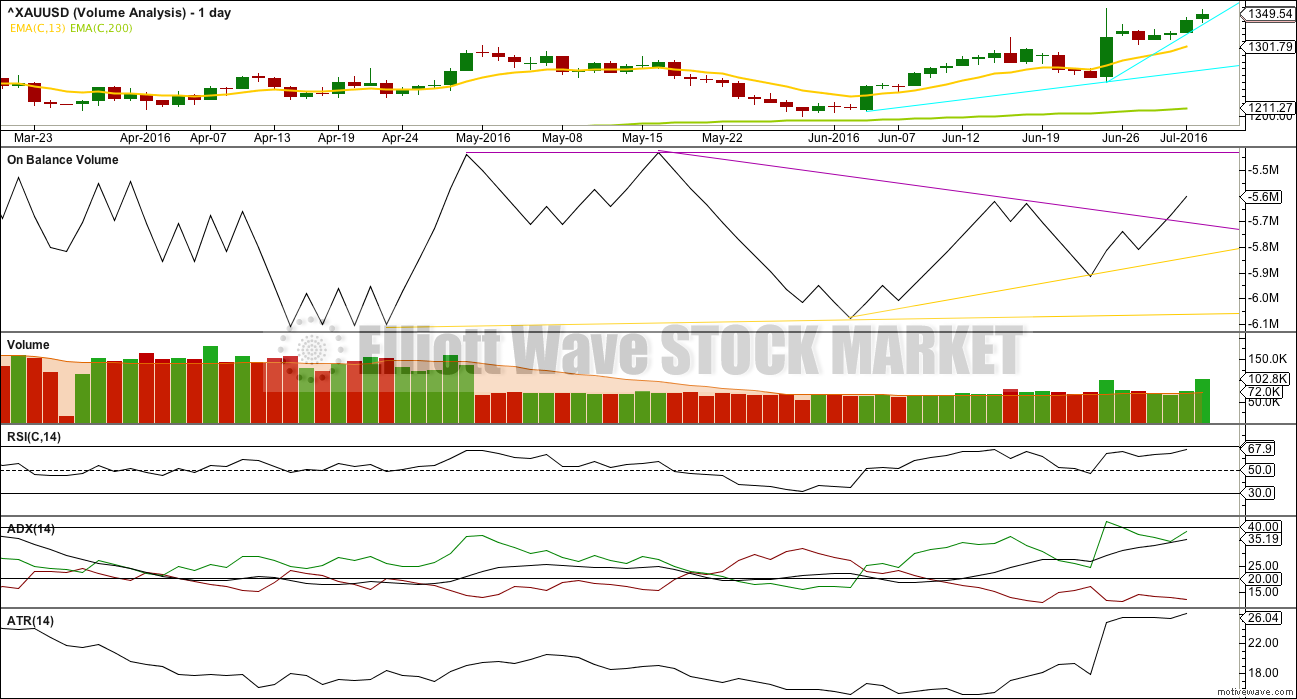
StockCharts only supply data for NY trading sessions. With NY closed for the 4th of July holiday today, COMEX data will be used for regular technical analysis.
Surprisingly, today shows an increase in volume for upwards movement. This supports the main hourly wave count over the alternate. Price has moved higher on increasing volume for three days in a row now. This supports the rise in price and is normal for a third wave up.
RSI shows very slight hidden bearish divergence with price today. But if price makes a new high, that hidden bearish divergence would disappear and the main hourly Elliott wave count would be supported. If price continues lower for a day from here, then the alternate hourly Elliott wave count must be seriously considered as a risk to long positions.
ADX is still increasing and the +DX line is still above the -DX line. There is an upwards trend in place. ATR agrees today as it too is increasing. ADX is below 45, so the trend is not yet extreme. There is plenty of room for it to continue.
Overall, classic technical analysis supports the main hourly Elliott wave count better today than the alternate.
This analysis is published @ 07:50 p.m. EST.
Hi Lara, just quickly, do we get an update today?
That is the question of the night, I just looked now.
Hopefully her neck is better as problems last Friday I think?
Thanks Lara, you’re awesome!
You’re welcome. I’m pretty pleased today that I got it right and profited from it. May we all have many more profitable days ahead.
Well that was a pretty good analysis from the main hourly chart! Price came down to right in the target zone and turned there.
Next stop…. 1,437. Hope everyone’s on board this train!
But seriously folks, it still can’t make a new high and there is still divergence showing weakness in price. Now that sometimes just disappears. But caution is advised. I’m moving my stop up today to protect some profit, and I’ll use the lower edge of the orange channel I think to put a stop there.
This correction broke below the steep cyan line (it should be expected that steep lines are broken sooner rather than later) and now price is finding resistance at the lower edge.
The main wave count now has Gold in a third wave at four degrees. Upwards movement should be accelerating now, not showing any weakness. Volume should be increasing.
If we see any further weakness and hesitation I would be very concerned for the main wave count. Today I need to see if the alternate can fit well with a new high.
Yes, it was another “Lara Amazing” main hourly wave count.
congratulation 🙂
…looking forward to today’s hourly wave count,… possibly offering the next entry point? Great work Lara !
Thank you very much folks.
I’m holding onto my long position, considering where to move my stop up now to protect some profit, and looking to add to it on the next correction.
Unfortunately for me these corrections tend to happen in hours when I’m fast asleep.
Hi Lara,
Just curious, but which investment did you choose; GDX, NUGT, UGLD, GC?
Lara: Now that gold is in cycle wave b Grand super cycle wave analysis needs to be updated at your convenience.
It is nice that you have link above in the report for the super cycle wave analysis.
Thanks.
True.
The historic charts will barely change, but the monthly charts will change.