
Upwards movement was expected as most likely from the main Elliott wave count. The alternate expected a little downwards movement.
Summary: The trend is up. Corrections present an opportunity to join the trend. Expect upwards momentum to increase in coming weeks. The target for this third wave to end remains at 1,582. The middle of it may end about 1,463, but the correction after the middle may be brief and shallow.
New updates to this analysis are in bold.
Last weekly chart can be found here.
Grand SuperCycle analysis is here.
DAILY ELLIOTT WAVE COUNT
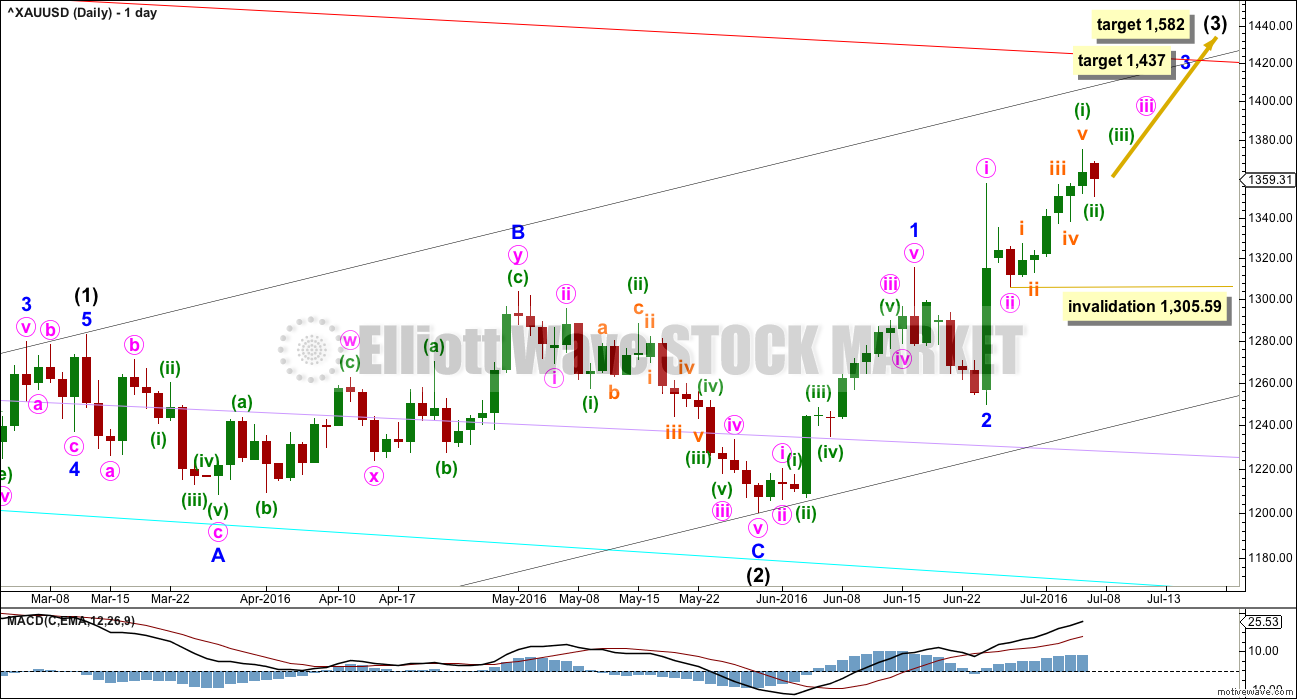
Click chart to enlarge.
Intermediate wave (2) is a complete expanded flat correction. It is a shallow 0.350 correction of intermediate wave (1) lasting 56 days, just one more than a Fibonacci 55. There is no Fibonacci ratio between minor waves A and C. Minor wave C is a complete impulse.
Minor wave 2 may have been a quick, deep 0.57 zigzag over in just six sessions. If minor wave 3 has begun there, then at 1,437 it would reach 1.618 the length of minor wave 1.
When minor wave 3 is complete, then the following correction for minor wave 4 may be relatively brief and shallow. Intermediate wave (3) may end with a strong blowoff top typical of commodities. This may pull minor wave 4 up forcing it to be over very quickly. For position traders, the target of intermediate wave (3) may be more useful than a target for minor wave 3.
Add a base channel (black lines) to intermediate waves (1) and (2). Draw the first trend line from the low at 1,046.27 on 3rd December, 2015, to the low labelled intermediate wave (2), then place a parallel copy on the high of intermediate wave (1). Along the way up, downwards corrections should find support at the lower edge of the base channel, if they get that low. At this stage, it looks like corrections are shallow and may not reach back down to the base channel. When intermediate wave (3) moves towards the middle, it should break above resistance at the upper edge of the base channel. When that trend line is breached, then it may offer support. A break above a base channel confirms a third wave up.
Within minute wave iii, no second wave correction may move beyond its start below 1,305.59.
At 1,582 intermediate wave (3) would reach 1.618 the length of intermediate wave (1).
Cyan, lilac and now red trend lines are copied over from the weekly chart. These are longer term lines which may offer support / resistance. Weekly and daily charts are on a semi-log scale.
Intermediate wave (1) lasted 71 days (not a Fibonacci number) and intermediate wave (2) lasted 56 days (one more than a Fibonacci 55). Intermediate wave (3) should be expected to be longer in length and duration than intermediate wave (1). An early expectation may be for it to total a Fibonacci 89 days. So far it has lasted 29 days.
MAIN HOURLY ELLIOTT WAVE COUNT
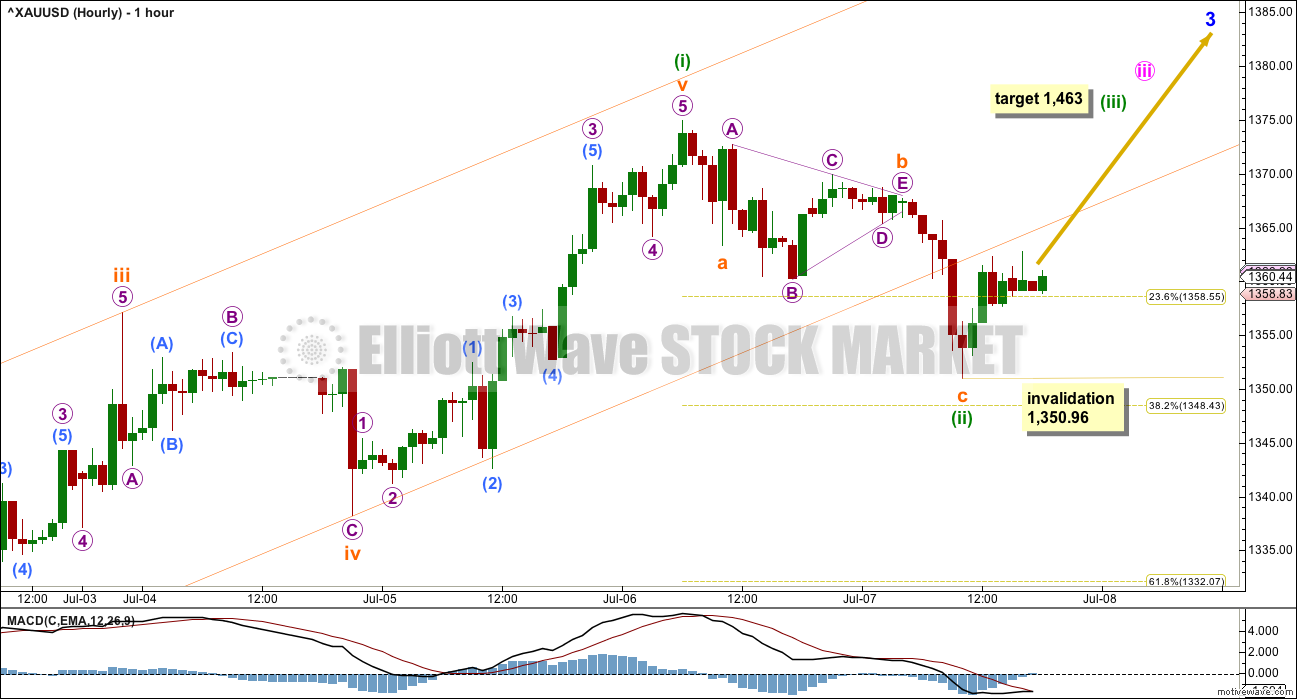
Click chart to enlarge.
This was the alternate wave count yesterday. It is now the main wave count. The red daily candlestick for Thursday’s session may have been minuette wave (ii). Because minute wave ii one degree higher was quick lasting only two days, and relatively shallow at 0.48, then minuette wave (ii) should be over more quickly and is also likely to be shallow. This is today the main wave count for this reason.
Minuette wave (ii) may have been quick lasting only one day, and shallow at only 0.35 of minuette wave (i).
At 1,463 minuette wave (iii) would reach 1.618 the length of minuette wave (i). This target makes the target for minor wave 3 on the daily chart irrelevant. Minor wave 3 may not exhibit a Fibonacci ratio to minor wave 1.
This wave count now expects to see a the middle of a big third wave up begin here. Upwards momentum should increase strongly, ending with a blowoff top at the end of minor wave 3 and possibly also at minute wave iii.
Within minuette wave (iii), no second wave correction may move beyond the start of its first wave below 1,350.96. A new low below this point would invalidate this main wave count and confirm the alternate below.
ALTERNATE HOURLY ELLIOTT WAVE COUNT
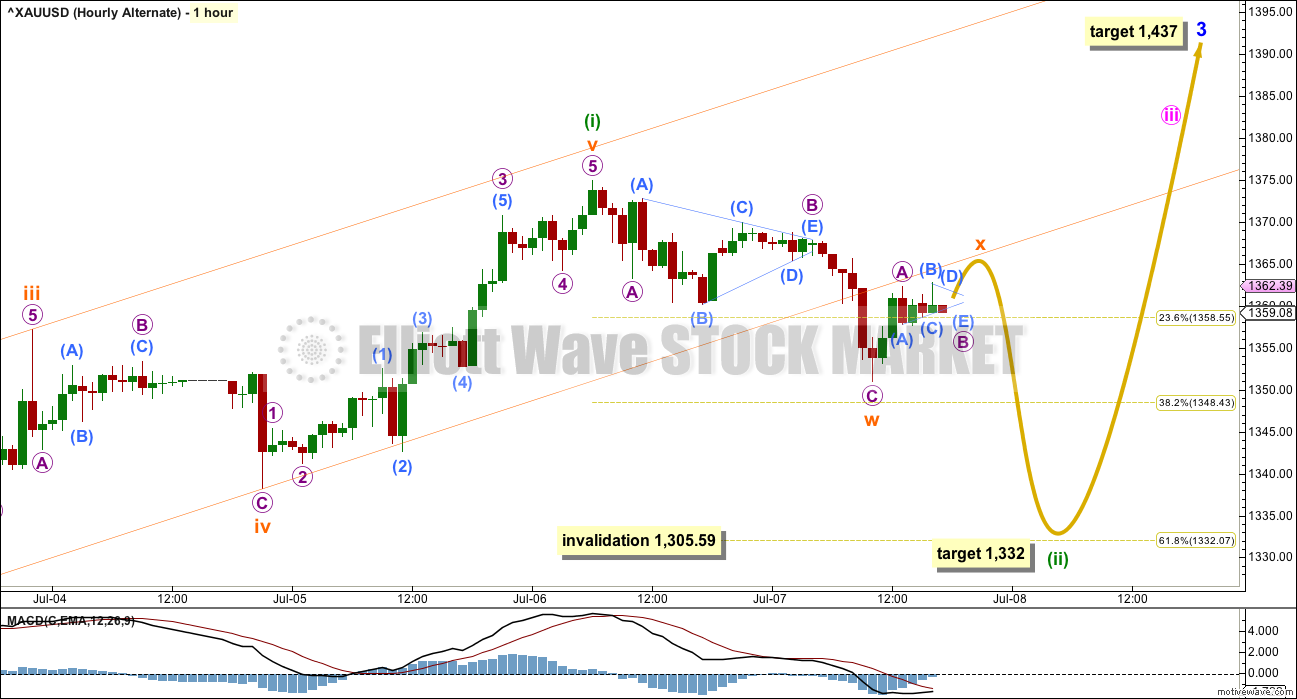
Click chart to enlarge.
It is possible that minuette wave (ii) is not over. It may be deeper and longer lasting than the main wave count expects. This is less likely though because it would see minuette wave (ii) longer lasting and probably also deeper than minute wave ii one degree higher.
Low probability does not mean no probability. This alternate wave count illustrates the short term risk to long positions today.
The most likely structure for minuette wave (ii) to continue as would be a double zigzag. The most likely point for it to end, if it deepens, would be the 0.618 Fibonacci ratio at 1,332.
Minuette wave (ii) may not move beyond the start of minuette wave (i) below 1,305.59.
TECHNICAL ANALYSIS
DAILY CHART
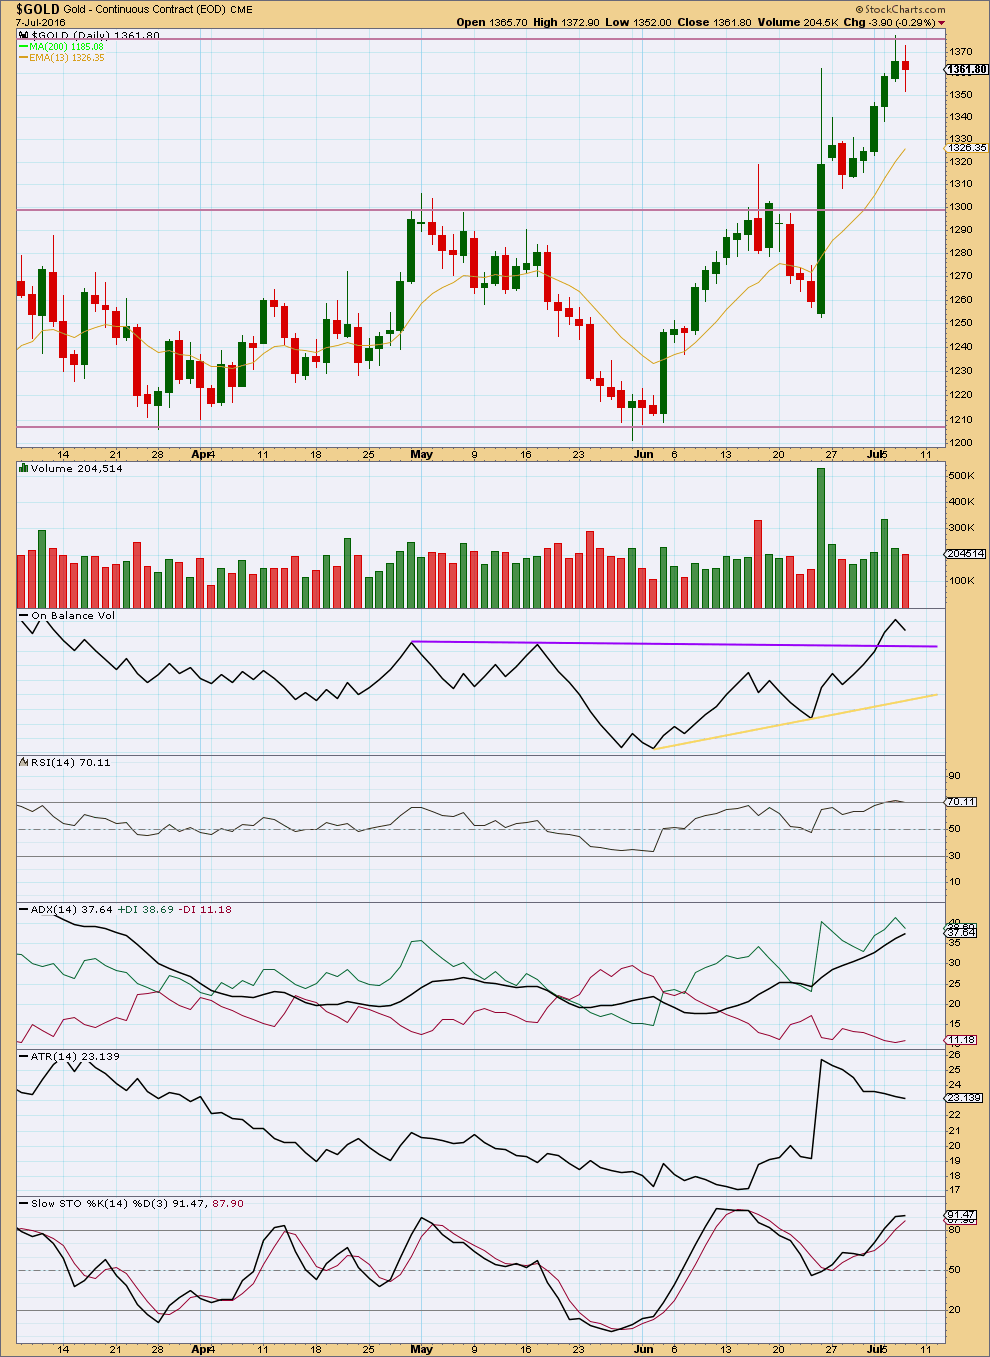
Click chart to enlarge.
There is resistance from a prior area of congestion about 1,375. This is about where price has turned to complete a red daily candlestick.
Volume has been increasing as price has been rising. The rise in price is supported by volume. Price today moved lower on lighter volume; downwards movement looks so far corrective.
On Balance Volume remains bullish above the purple line. If price moves lower, then it may end when OBV comes to find support at that line.
RSI is just entering overbought and shows no divergence with price at the last high. RSI can remain extreme for several days during a trending market. Divergence would indicate weakness in the trend. There is no weakness seen today.
ADX still indicates there is an upwards trend in place. It is now extreme. Looking back over Gold’s strong third wave movements, ADX can remain extreme for several days towards the end of a third wave.
ATR is still declining due to the strong upwards day of 24th of June being part of this average. Overall, ATR is still reasonable for a third wave.
Stochastics still shows divergence with price at the last two swing highs. This divergence may be resolved by one day of downwards movement, but it may also require a little more.
While the market is trending, it should be expected that the 13 day moving average will provide support for deeper corrections along the way up.
This analysis is published @ 07:41 p.m. EST.
Lara are you surfing this weekend?
Need I ask?
25 very good reasons why surfing is so addictive
http://www.surfertoday.com/surfing/7688-25-very-good-reasons-why-surfing-is-so-addictive
It’s a great way of living life!!!!
I have a GoPro, I analyse my surfing 🙂 And get to relive each session I film.
No surf this weekend, it’s an onshore mess. Maybe Monday?
Here’s a video from a recent session…. small waves but clean and fun.
I surf because I need to for my soul.
This is a very special site, comments, members, and leading edge process with advanced updates by Master Advisor and Guru forecaster Lara Iriarte.
That’s very kind Richard, thank you.
I’m really uncomfortable with being called a guru though.
The membership is growing, and we have a large number of very experienced members here. The wealth of knowledge and expertise is huge.
To those members who are kind enough to share your experience, thank you. Together we can all make better decisions.
Yes, the alternate was correct. Minuette (ii) is now a complete double zigzag, and it was NFP release that made it whipsaw and complete the correction very quickly. So the proportion is still really good.
The wave count now has Gold in the early stage of a third wave up at multiple degrees.
Lara,
Are we in Sub-minuette 3 now nearly completed?
No, minuette (iii) only beginning.
As per Alan’s comment below, we both have the wave count in subminuette i of minuette (iii).
So only within the first wave of the middle of a big third. This should be really good next week!
thanks, this sub-minuette i of (iii) nearly over at 4 PM or more to go yet?
We are currently in subminuette 1 of minuette 3, going to complete micro 5.
I wouldn’t want to risk a long drawn out submicro 4, so I cashed out at the end of submicro 3 just now, a very respectable gain of $16 in NUGT in 3 hours.
For next week, I will be waiting for subminuette 2 to end before riding the third wave (subminuette 3) up. My best guess is that submicro 5 and hence subminuette 1 should end around 1364 to 1368. Minuette 2 ought to finish around 1348. The rise up in subminuette 3 should be just in excess of $50. That’s my road map. This supposes that Lara’s Minor 3 target is too low.
Have a wonderful weekend. Good night for me.
Hello Alan,
Thank you for your well measured trading plan.
Always very appreciated!
Pete
Thanks Pete, hope you find it useful.
Thanks Alan, great comment, helpful strategy as usual.
Alan,
It appears Sub-minuette 3 of minuette 1 is over at 4:00PM
Sorry, was asleep.
I still maintain that we are in subminuette 1 micro 4. Submicro 3 has completed. Submicro 4 is underway. I do hope subminuette 1 would complete by my Monday afternoon, US Sunday mornng wee hours, and subminuette 2 is underway. Just can’t wait to fully load up for that explosive bull run. There are already four 1-2s, so this third wave will be very strong indeed. My gut feeling is that it would surpass Lara’s conservative estimates.
Edit: we are in subminuette 1 micro 5 …
Thanks Alan
With Laura and your input it’s like the dynamic duo !
That’s why this site is so valuable. Otherwise most would be lost wondering.
Many thanks to both !
My pleasure.
Let’s just say we share our ideas for mutual profits.
8:31 low 1335.40 end of minuette wave (ii) down
9:15 high 1370.53 top of 1st wave up
9:59 1350.99 bottom 2nd wave down
10:20 1357.34 1st wave up
11:30 1351.10 bottom 2nd wave
11:44 1353.82 top 1st wave up
11:51 1351.20 bottom 2nd wave
1:39 1360 now maybe n the 5th wave of maybe a 3rd up
NUGT up $15 from today’s low.
Range 149.76 – 164.84
likely a drop soon
Richard – With all of your valuable input, do you get a discount on your membership? If not, you definitely should! Hahahaha
As a confession: I sold premarket. It looked like a good move for about 1 minute. Then, I was thinking about the double zig zag and thought that gold may need to reach back down to the fib. Oh well, my trading has been so awful. Now, I need to sit and wait until Wednesday morning due to account issues. Hopefully, I won’t buy in when gold corrects… again!
Stephen K,
I was one of Lara’s first clients who signed up for a special rate limited quantity offer when she switched from free to charging in the fall of 2013.
My timing needs improving. I thought of the double zigzag also for awhile.
Then afterwards doing some rough EW counts I figured that the usual still applies, buy and hold at the market miners morning low until it looks like topping.
Maybe use a 5 minute MACD like a MACD TwoLines in TOS Think or Swim system and DMI Oscillator and EMA/SMA and a few other trend indicators and maybe combine a 1 minute and a 5 minute for intraday trading with the 5 being the main trend and the 1 being a warning indicator.
Luckily because my funds are in a sort of government registered saving plan so I have zero waiting for funds to settle. I can trade in and out in seconds no settlements.
Where do you live? I want to sit down with you!!!! LOL!
I figured your funds were in a Swiss Bank Account at this point in time!
Thank you for your tips and care! You’re a good man!
Richard
I want a special rate too!
Kidding. I feel very blessed to have the great imputs of all on the site on top of Lauras detailed work!
Stephen K,
Sorry to hear that you sold premarket as that was actually a great buying opportunity. If I may, imho, the middle of a 3rd wave is very powerful. You may want to consider buying a position small enough that you are comfortable holding for days, weeks, or even months. Trying to trade in and out of every correction will likely frustrate you, drain your account, or cause you to miss big moves. Just because Lara shows the most probable hourly moves, that doesn’t mean you should try to trade those moves.
Sure things could change, but as of now, corrections will likely be minimal until we get to the end of minor 3, then the end of Intermediate 3 after that. Personally, swing trading works best for me. I like to hold for days or weeks at a time. Good luck with your trading.
Rambus on the GDX gap
https://rambus1.com/2016/07/07/gdx-update-68/
Alternate hourly wave count is now validated as the Main hourly wave count was invalidated below 1,350.96 as gold low at 1,335.40 at 8:31 am , which I believe is likely to be the low of the day and gold mainly moves up from here.
Gold reached within 2.40 of Lara’s 1332 target.
Does anyone have quick thoughts on the S&P and if/ when it will drift lower/ higher? It’s continuing to climb on low daily/ weekly volume and today’s jobs information is supportive of more gains ahead. Shorts are getting crushed over and over again.
I guess I was thinking that the S&P would need to fall to assist with gold’s rally but maybe not?
Lastly, I’m wondering about Lara’s comments found with the Alternate… longer lasting portion assuming that we will need more time than just today to correct?
It is possible that minuette wave (ii) is not over. It may be deeper and longer lasting than the main wave count expects. This is less likely though because it would see minuette wave (ii) longer lasting and probably also deeper than minute wave ii one degree higher.It is possible that minuette wave (ii) is not over. It may be deeper and longer lasting than the main wave count expects. This is less likely though because it would see minuette wave (ii) longer lasting and probably also deeper than minute wave ii one degree higher.
I wouldn’t be shorting the stock market after the very strong US jobs report this morning.
Correlation between stock market up and gold down is usually but now always like today.
Gold did drop but investors quickly buy at gold and miners dips as Lara suggests.
Minuette ii has to be over at low this AM. It then shot up $35 in 30min before pulling back $17. My concern is we have been moving sideways ever since. does not look like third of a third.
I’d say very likely it is over at the morning low.
Perhaps we did get a double zigzag over the last two days down to morning low.
If SPX manages to break the all time high, a bull market may occur. As of now, it is edging closer and closer to that. I would wait out this rise and then decide. I know analysts are divided as to whether a bull market would ensue, or a large drop may happen. I’m not taking sides. Technical analysis points to a bear but sentiments are entrenched in the bull. I’ll let price be the final arbiter.
Sounds like Lara, “Let price be your guide with gold.”
Yup. Nothing beats price. It’s one of the reasons I depend so much on it. With Elliott Wave framework and price movement there is actually no need for indicators. More tools = more confusion. Just like “too many cooks”.
Did we get a double zigzag already?
Was the drop to $1,335.40 the bottom today or is there one more zigzag to 1332 still?
“The most likely structure for minuette wave (ii) to continue as would be a double zigzag. The most likely point for it to end, if it deepens, would be the 0.618 Fibonacci ratio at 1,332.”
FRIDAY, JULY 8 8:30 am US Nonfarm payrolls – It is usually big news.
Hiring roars back in June with 287,000 gain in new jobs
July 8, 2016 9:06 a.m. ET
http://www.marketwatch.com/story/us-economy-adds-287000-jobs-in-june-2016-07-08
We all know now that alt wave count is in play.
Hopefully this dip to $1336ish completes minuette ii. Just as suspected, I knew either a big rip or big dip after NFP release.
Keep an eye on bonds. They didn’t sell off nearly as hard as other markets suggested they would have.
Could be an interesting day/next week if we kick off these middle 3rd waves up in gold.
Lara,
I’m going to ask you to walk out on a limb and take a stab at a timeframe. I know EW analysis doesn’t say anything about the time it should take to reach various levels. Even projecting those levels involves some (educated) guesswork. But just want to ask your opinion, based on your years of experience in analyzing gold: do you expect it to take weeks or months to get to your target of 1582?
Lara states above:
“Intermediate wave (1) lasted 71 days (not a Fibonacci number) and intermediate wave (2) lasted 56 days (one more than a Fibonacci 55). Intermediate wave (3) should be expected to be longer in length and duration than intermediate wave (1). An early expectation may be for it to total a Fibonacci 89 days. So far it has lasted 29 days.”
So that leaves approx 60 trading days to hit the Intermediate 3 target of 1,582.
If my math is right, the tentative date for Intermediate 3 to end is Sept 30.
Then gold would correct until about the end of the year for Intermediate wave 4 and then proceed up starting around Jan 2017 for Intermediate 5. This seems to make sense from a gold seasonality standpoint also.
Thanks Dreamer.
What he said 🙂
best thing for the bulls would be a new low below $1352 before NFP release in 10.5 hrs. Big moves in gold have generally come on NFP in the past 5+ yrs. Tomorrow should be no exception. It’s just a matter of do we get a dip to complete minuette ii after release or does minuette iii begin right after release?
Here’s a look at GDX. While the correction may be over already (gold main hourly count), there’s also room for GDX to move down another 5% and it would still be considered a healthy correction and would not invalidate Lara’s current GDX wave count.
Maybe we get a quick reaction down tomorrow with NFP and then GDX recovers? This scenario would align with the gold alternate hourly count.
A very handy chart, thanks again, Dreamer! 🙂
Lara, FYI the grand super cycle link needs to be updated to the latest one.
Oh yes, thank you Dreamer.