
Last week expected overall downwards movement, which was expected to be choppy and overlapping. This is exactly what has happened.
Summary: More downwards movement is expected for the next week.
New updates to this analysis are in bold
MONTHLY ELLIOTT WAVE COUNT
Click chart to enlarge.
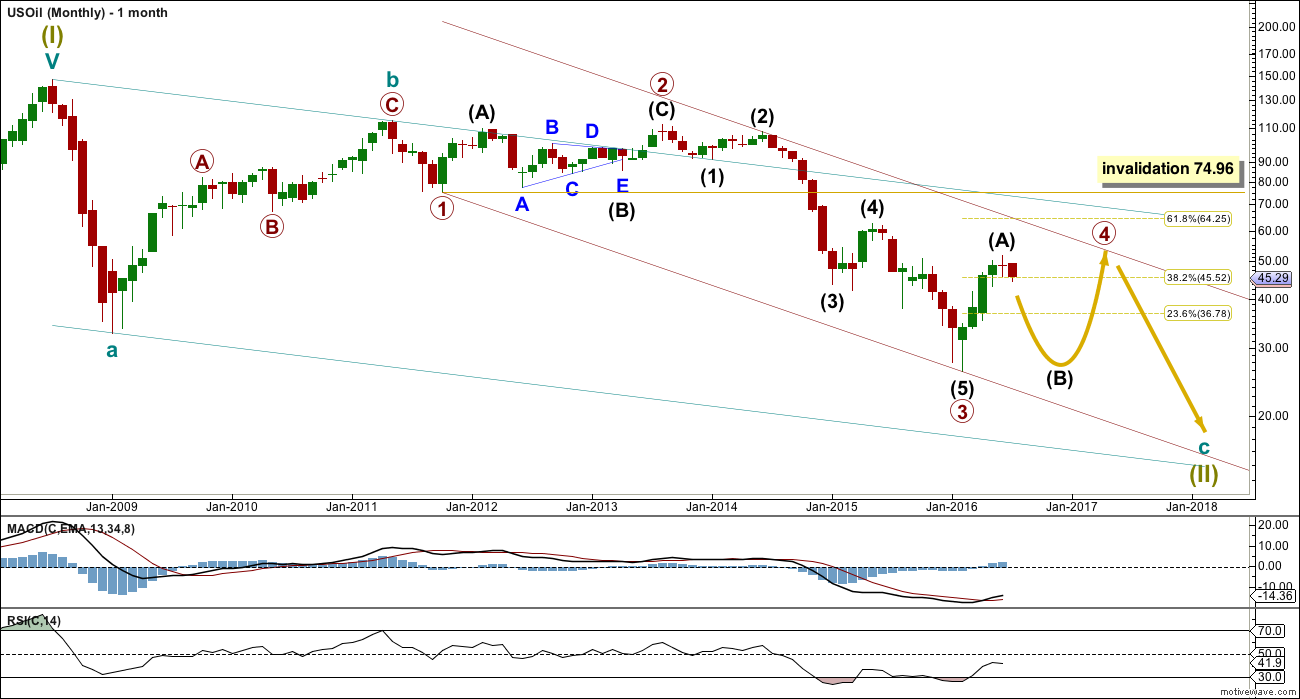
Within the bear market, cycle wave b is seen as ending in May 2011. Thereafter, a five wave structure downwards for cycle wave c begins.
Primary wave 1 is a short impulse lasting five months. Primary wave 2 is a very deep 0.94 zigzag lasting 22 months. Primary wave 3 is a complete impulse with no Fibonacci ratio to primary wave 1. It lasted 30 months.
Primary wave 4 is likely to exhibit alternation with primary wave 2. Primary wave 4 is most likely to be a flat, combination or triangle. Within all of these types of structures, the first movement subdivides as a three.
Primary wave 4 is likely to end within the price territory of the fourth wave of one lesser degree; intermediate wave (4) has its range from 42.03 to 62.58.
Primary wave 4 may end if price comes up to touch the upper edge of the maroon channel. The upper edge of this channel has been pushed up to sit on the end of intermediate wave (2) within primary wave 3.
Primary wave 4 is most likely to be shallow to exhibit alternation in depth with primary wave 2. So far it has passed the 0.382 Fibonacci ratio at 45.52. It may now move mostly sideways in a large range.
Primary wave 4 may not move into primary wave 1 price territory above 74.96.
DAILY ELLIOTT WAVE COUNT
Click chart to enlarge.
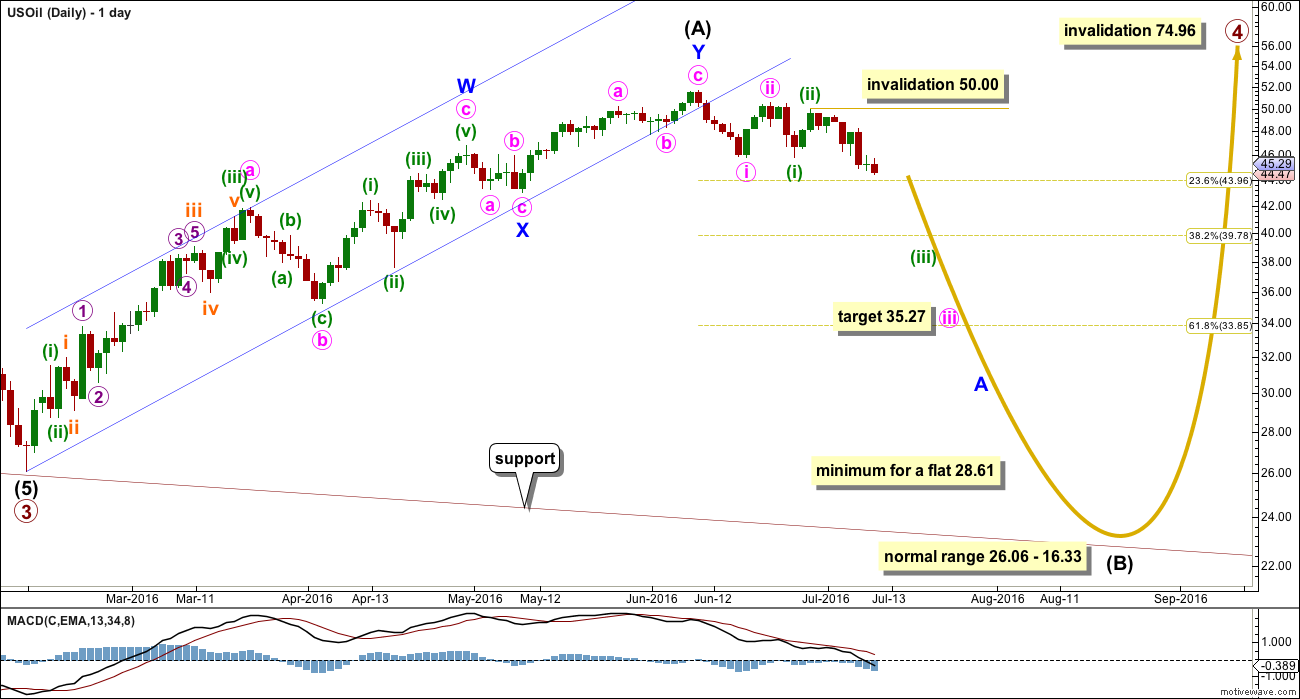
Intermediate wave (A) may be complete as a double zigzag. The best fit channel about intermediate wave (A) has now been breached by downwards movement. This may indicate a trend change.
If intermediate wave (A) is a three, then intermediate wave (B) is most likely to be a very deep correction. It may make a new low below the start of intermediate wave (A) at 26.06.
If primary wave 4 is to be a flat correction, then intermediate wave (B) must be a minimum 0.9 length of intermediate wave (A) at 28.61. The normal range for intermediate wave (B) would be 1 to 1.38 the length of intermediate wave (A) at 26.06 to 16.33.
If primary wave 4 is to be an expanded flat correction, then intermediate wave (B) should be 1.05 the length of intermediate wave (A) or longer, at 24.78.
If primary wave 4 is to be a triangle, then intermediate wave (B) has no minimum nor maximum. It must only subdivide as a three wave structure. It may make a new low below the start of intermediate wave (A) at 26.06 as in a running triangle.
Primary wave 4 may not move into primary wave 1 price territory above 74.96.
Intermediate wave (B) may be any of more than 23 possible corrective structures. It would most likely be a single or multiple zigzag in order to be a deep correction. It may also be an expanded flat to be deep. It may find support at the lower edge of the maroon channel.
Minor wave A would most likely subdivide as a five but may also be a three. At this stage, it looks like minor wave A may be unfolding as a five wave impulse. Within minor wave A, minute waves i and ii look complete, and within minute wave iii it looks like minuete waves (i) and (ii) may be complete. A third wave within a third wave down at low degrees may see a couple of days of strong downwards movement. At 35.27 minute wave iii would reach 2.618 the length of minute wave i.
Within minuette wave (iii), no second wave correction may move beyond the start of its first wave above 50.00.
ALTERNATE DAILY ELLIOTT WAVE COUNT
Click chart to enlarge.
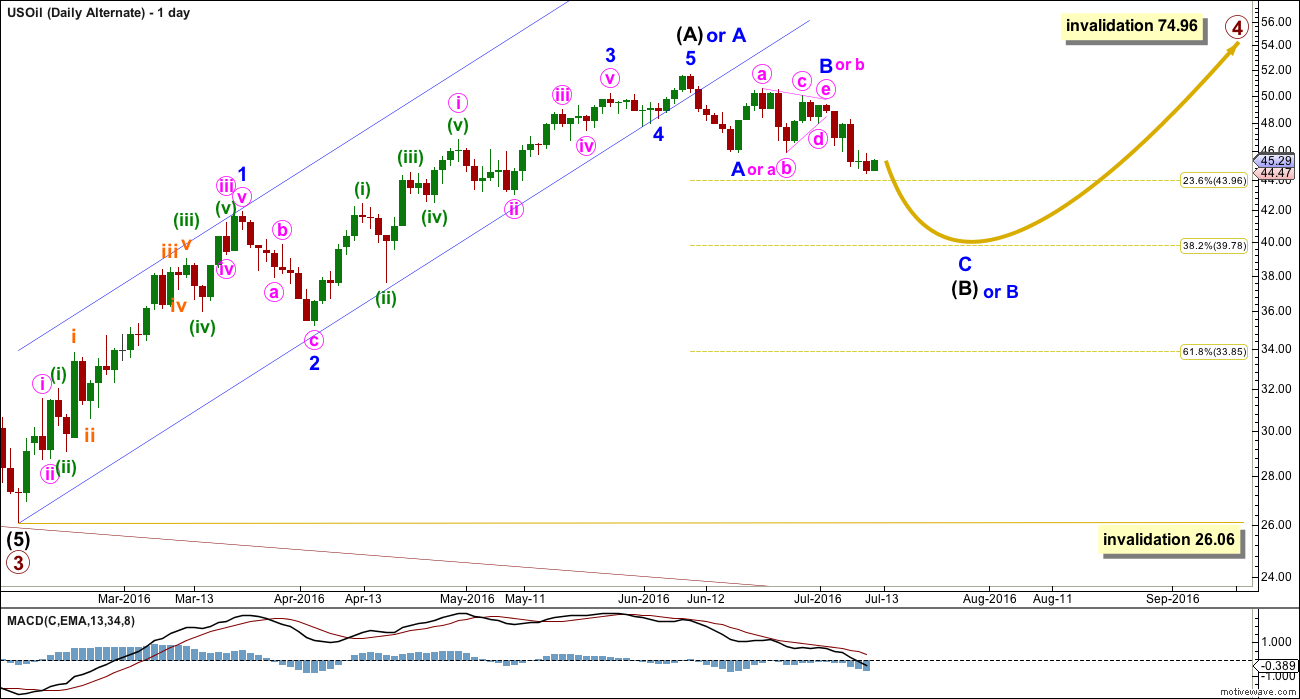
Primary wave 4 may be unfolding as a zigzag, or a zigzag upwards may be almost complete for intermediate wave (A) (as per alternate labelling on this chart).
It is possible that only minor wave A is a five wave structure complete upwards and minor wave B down is unfolding. If minor wave B is a flat correction or running triangle, then within it minute wave b may make a new high. There is no upper invalidation point for this wave count this week for this reason.
This wave count looks forced this week. But it remains valid because no Elliott wave rules are broken and all guidelines are reasonably met.
If intermediate wave (B) or minor wave B is still moving lower, then it may end about the 0.382 Fibonacci ratio of intermediate wave (A) or minor wave A upwards, about 39.78.
If intermediate wave (A) or minor wave A is a five wave structure, then intermediate wave (B) or minor wave B may not move beyond its start below 26.06.
TECHNICAL ANALYSIS
DAILY CHART
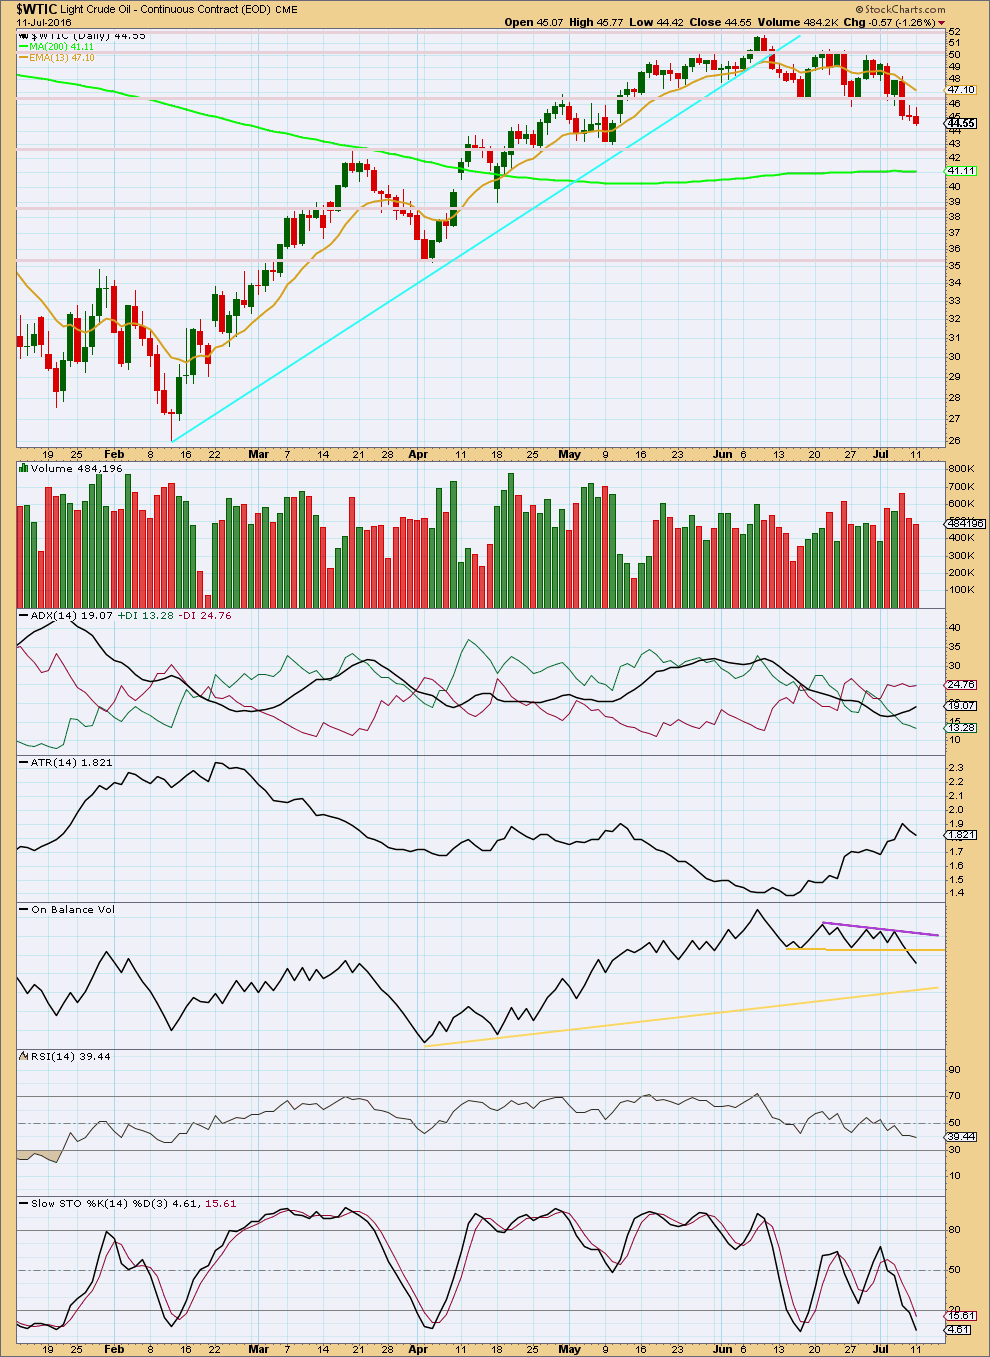
Click chart to enlarge. Chart courtesy of StockCharts.com.
Downwards days have stronger volume than upwards days. This supports the idea of more downwards movement mid term. However, price is falling on declining volume for three days in a row. Oil can fall of its own weight though, and often does. This decline should not give too much concern at this time as long as volume remains reasonable.
ADX indicates a downwards trend is in place. ATR may be beginning to disagree. If ATR again turns up, then these two indicators would again be in agreement and more confidence would be had in a downwards trend.
On Balance Volume is bearish with a break below the upper yellow support line. The next line of support is some considerable distance away, allowing for a reasonable fall in price.
RSI is not extreme. There is no divergence between price and RSI at this time to indicate any weakness in price.
Stochastics is extreme but this oscillator may remain extreme for reasonable periods of time during a trending market.
Expect upwards corrections to find resistance at the 13 day moving average while Oil is in a downwards trend.
This analysis is published @ 06:17 a.m. EST on 12th July, 2016.
Hi Lara
Since general market is in a new bull trend do you think oil has already bottom and will move higher with the GM??