
Last week expected overall downwards movement. This is again exactly what has happened.
Summary: Some more downwards movement is expected for the next week and an increase in downwards momentum may be seen.
New updates to this analysis are in bold
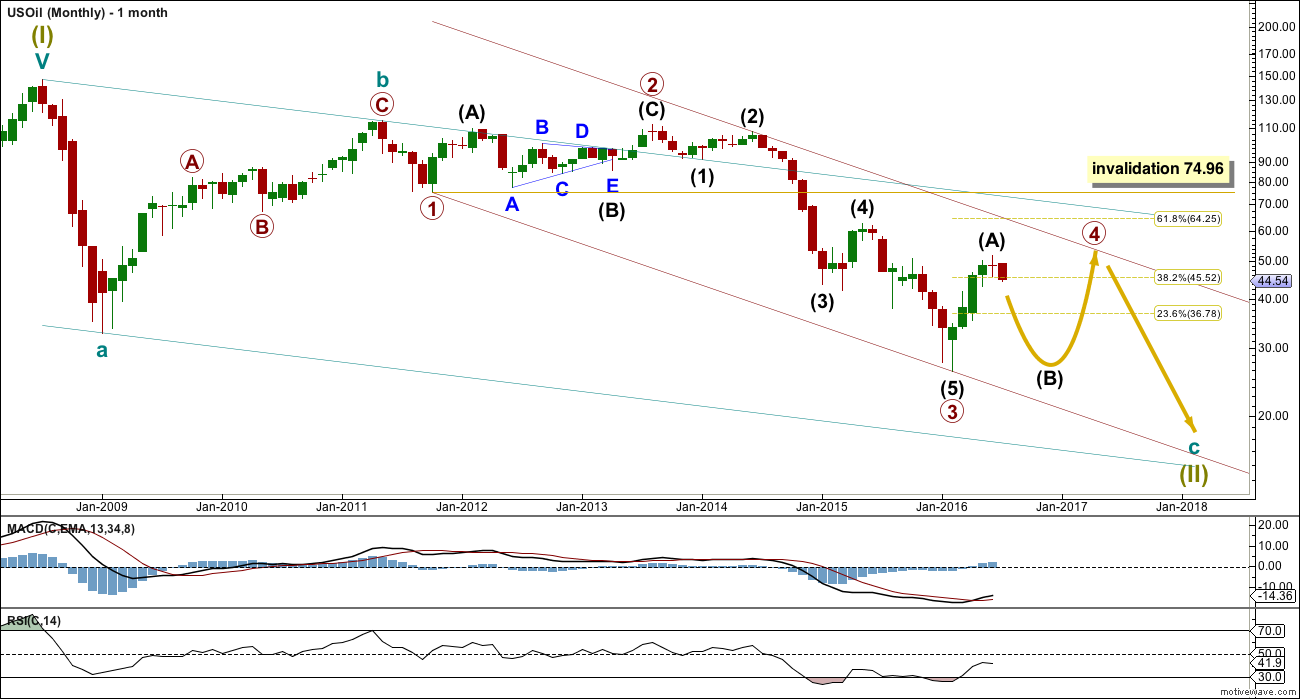
MONTHLY ELLIOTT WAVE COUNT
Click chart to enlarge.
Within the bear market, cycle wave b is seen as ending in May 2011. Thereafter, a five wave structure downwards for cycle wave c begins.
Primary wave 1 is a short impulse lasting five months. Primary wave 2 is a very deep 0.94 zigzag lasting 22 months. Primary wave 3 is a complete impulse with no Fibonacci ratio to primary wave 1. It lasted 30 months.
Primary wave 4 is likely to exhibit alternation with primary wave 2. Primary wave 4 is most likely to be a flat, combination or triangle. Within all of these types of structures, the first movement subdivides as a three.
Primary wave 4 is likely to end within the price territory of the fourth wave of one lesser degree; intermediate wave (4) has its range from 42.03 to 62.58.
Primary wave 4 may end if price comes up to touch the upper edge of the maroon channel. The upper edge of this channel has been pushed up to sit on the end of intermediate wave (2) within primary wave 3.
Primary wave 4 is most likely to be shallow to exhibit alternation in depth with primary wave 2. So far it has passed the 0.382 Fibonacci ratio at 45.52. It may now move mostly sideways in a large range.
Primary wave 4 may not move into primary wave 1 price territory above 74.96.
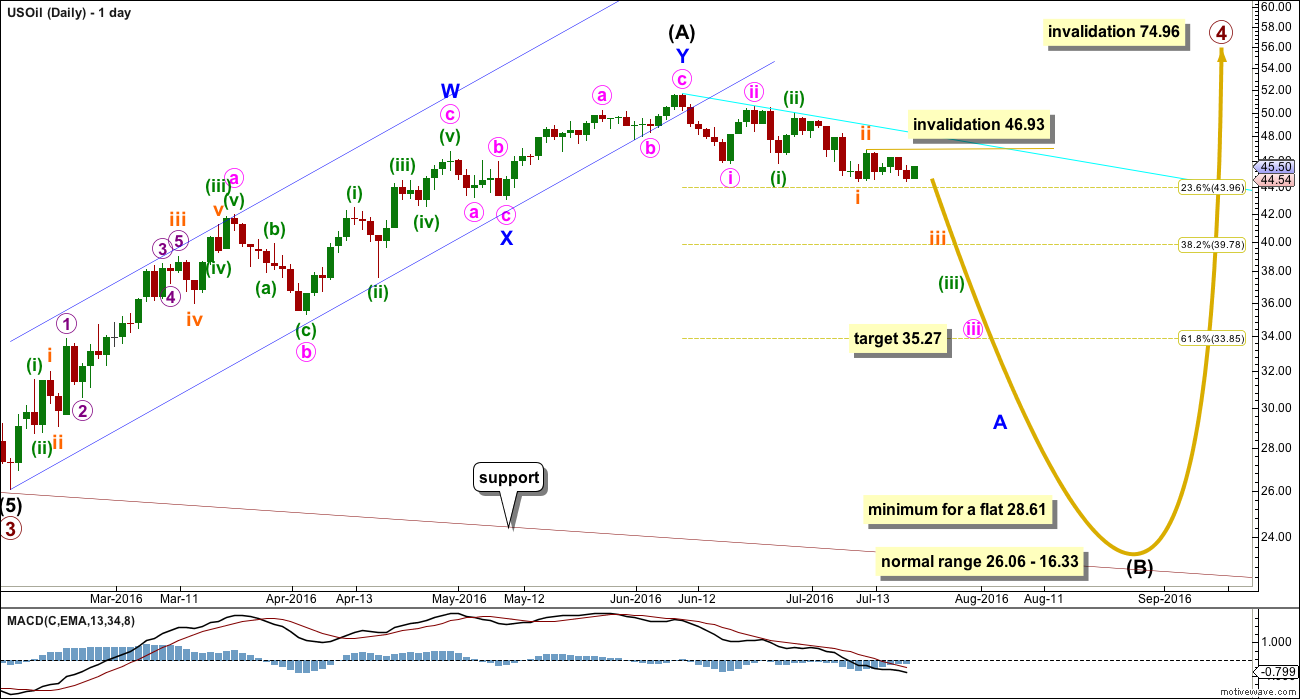
DAILY ELLIOTT WAVE COUNT
Click chart to enlarge.
Intermediate wave (A) may be complete as a double zigzag. The best fit channel about intermediate wave (A) has now been breached by downwards movement. This indicates a trend change.
If intermediate wave (A) is a three, then intermediate wave (B) is most likely to be a very deep correction. It may make a new low below the start of intermediate wave (A) at 26.06.
If primary wave 4 is to be a flat correction, then intermediate wave (B) must be a minimum 0.9 length of intermediate wave (A) at 28.61. The normal range for intermediate wave (B) would be 1 to 1.38 the length of intermediate wave (A) at 26.06 to 16.33.
If primary wave 4 is to be an expanded flat correction, then intermediate wave (B) should be 1.05 the length of intermediate wave (A) or longer, at 24.78.
If primary wave 4 is to be a triangle, then intermediate wave (B) has no minimum nor maximum. It must only subdivide as a three wave structure. It may make a new low below the start of intermediate wave (A) at 26.06 as in a running triangle.
Primary wave 4 may not move into primary wave 1 price territory above 74.96.
Intermediate wave (B) may be any of more than 23 possible corrective structures. It would most likely be a single or multiple zigzag in order to be a deep correction. It may also be an expanded flat to be deep. It may find support at the lower edge of the maroon channel.
Minor wave A would most likely subdivide as a five but may also be a three. At this stage, it looks like minor wave A may be unfolding as a five wave impulse. Within minor wave A, minute waves i and ii look complete, and within minute wave iii it looks like minuete waves (i) and (ii) may be complete. Within minuette wave (iii), now it looks like subminuette waves i and ii may be complete. Price next week may move into a third wave down at three small degrees, so some increase in momentum should be seen if this wave count is correct.
At 35.27 minute wave iii would reach 2.618 the length of minute wave i.
Add a resistance line from the high labelled intermediate wave (A) across the highs of minute wave ii and minuette wave (ii) (drawn here in cyan). Along the way down, if another deep correction unfolds, then it should find strong resistance at that line.
Within subminuette wave iii, no second wave correction may move beyond the start of its first wave above 46.93.
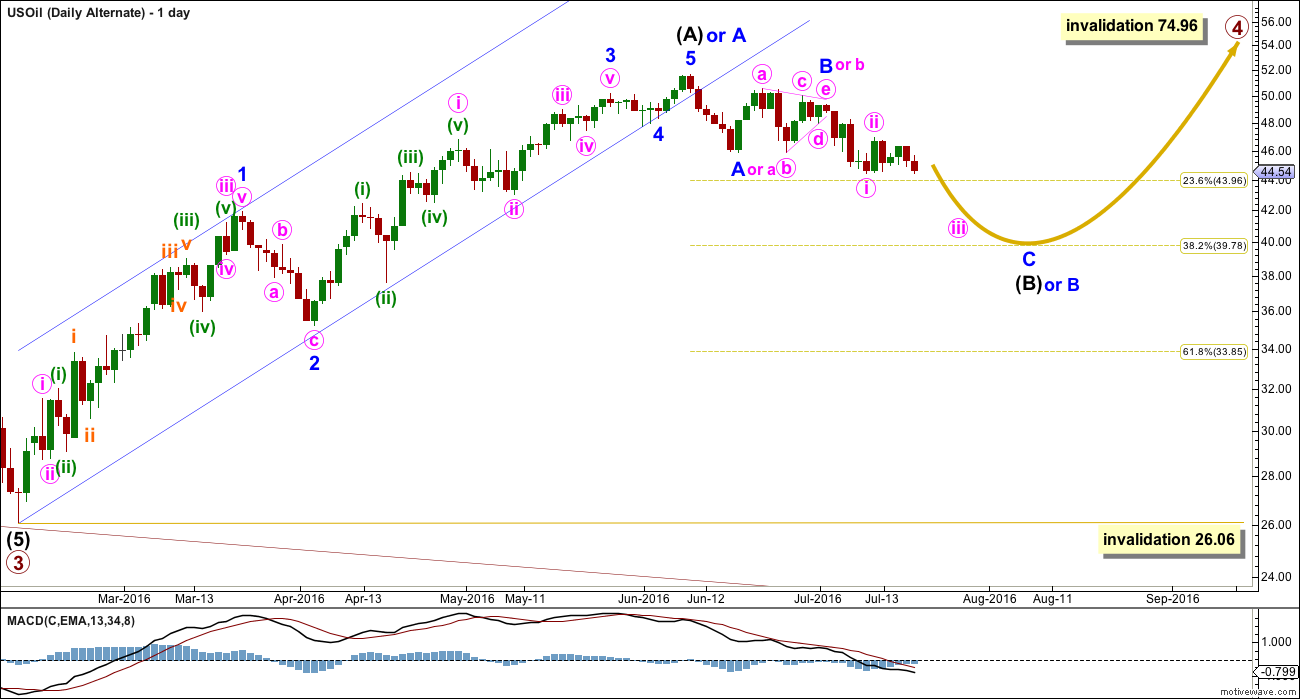
ALTERNATE DAILY ELLIOTT WAVE COUNT
Click chart to enlarge.
Primary wave 4 may be unfolding as a zigzag, or a zigzag upwards may be almost complete for intermediate wave (A) (as per alternate labelling on this chart).
It is possible that only minor wave A is a five wave structure complete upwards and minor wave B down is unfolding. If minor wave B is a flat correction or running triangle, then within it minute wave b may make a new high. There is no upper invalidation point for this wave count this week for this reason.
This wave count looks forced mostly because the triangle of minor wave B or minute wave b does not look right. It comes to too quick an end and the trend lines are too steep for a normal look. But it remains valid because no Elliott wave rules are broken and all guidelines are reasonably met.
If intermediate wave (B) or minor wave B is still moving lower, then it may end about the 0.382 Fibonacci ratio of intermediate wave (A) or minor wave A upwards, about 39.78.
If intermediate wave (A) or minor wave A is a five wave structure, then intermediate wave (B) or minor wave B may not move beyond its start below 26.06.
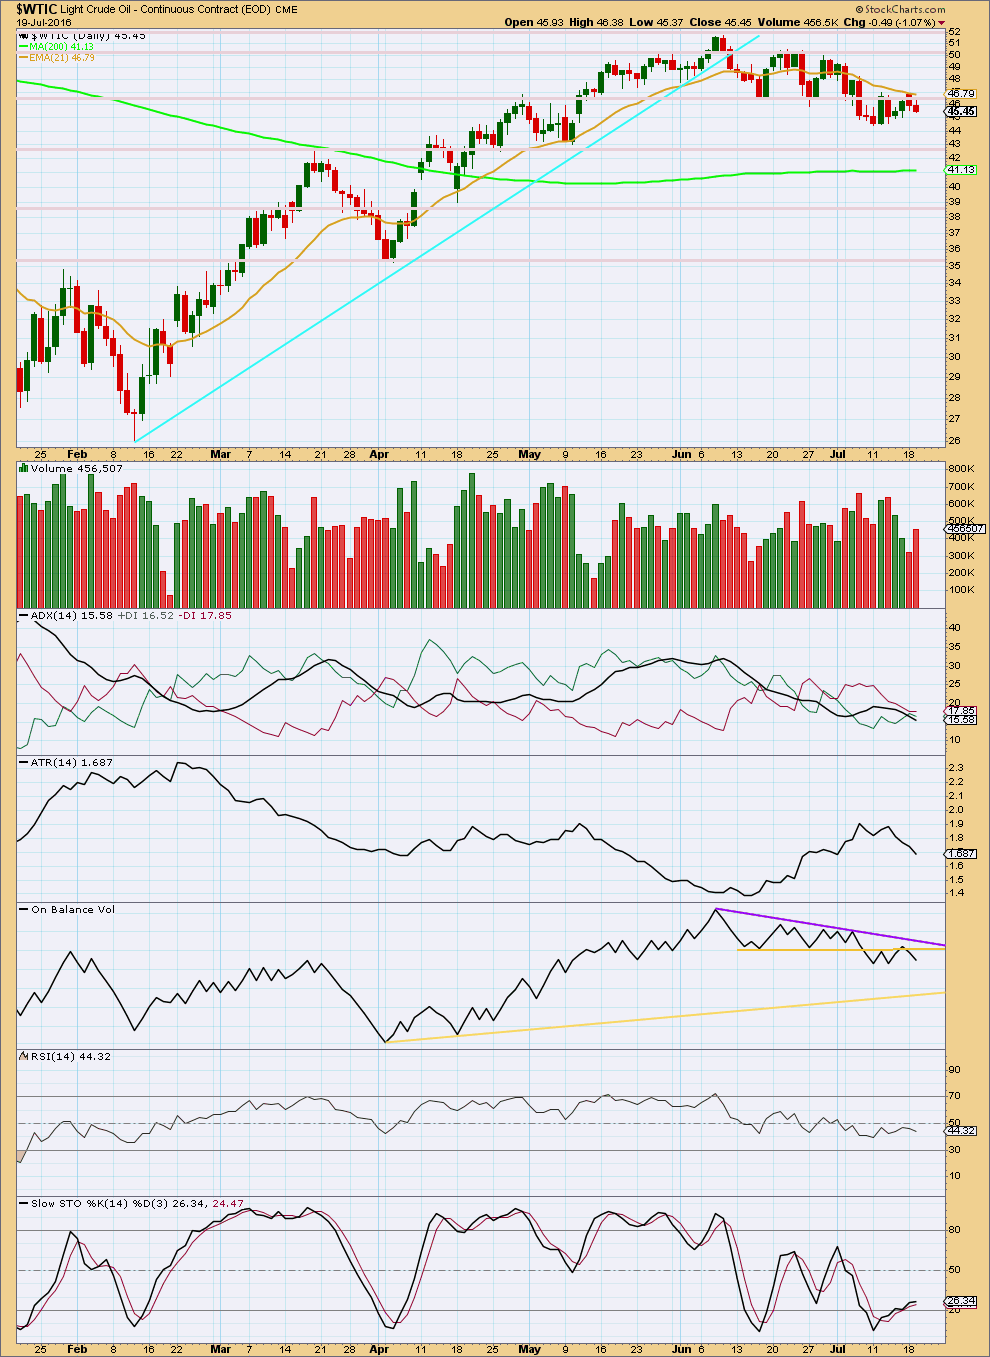
TECHNICAL ANALYSIS
DAILY CHART
Click chart to enlarge. Chart courtesy of StockCharts.com.
The last day here of 19th of July shows an increase in volume for downwards movement. Oil often falls of its own weight, but when moving into a third wave down it usually shows some increase in volume. The increase in volume today supports the wave count very well. The prior two upwards days also came with declining volume. The volume profile at this time is clearly bearish.
ADX no longer indicates a downwards trend is in place after a week of sideways movement from price. ADX does not indicate a trend change though, only a consolidation, because the -DX line remains just above the +DX line.
ATR is agreeing with ADX as it is declining.
On Balance Volume is bearish with a break below the upper yellow support line. The next line of support is some considerable distance away, allowing for a reasonable fall in price.
RSI is not extreme. There is no divergence between price and RSI at this time to indicate any weakness in price.
Stochastics is returning from oversold.
The short term moving average is changed from 13 days to a Fibonacci 21 days. This better shows where Oil finds support and resistance during a trend. At this stage, upwards movement is finding resistance at this average, and the last week looks like a small consolidation within a downwards trend.
A small bear flat pattern may be completing. A target for the next move down using the measured rule would be about 5.49 below the breakout price. It is important to wait for a breakout when using this continuation pattern. The breakout would come with a break below the lower blue support line.
This analysis is published @ 06:35 p.m. EST.
Hi Lara,
so far exactly like you analysed. Are we due for a correction which would offer another good entry point to go short?
Thanks for your great work 🙂