
Last week again expected overall downwards movement. This is again exactly what has happened.
An increase in downwards momentum was also expected and has been seen by MACD.
Summary: Some more downwards movement is expected for the next week and a further increase in downwards momentum may be seen.
New updates to this analysis are in bold
MONTHLY ELLIOTT WAVE COUNT
Click chart to enlarge.
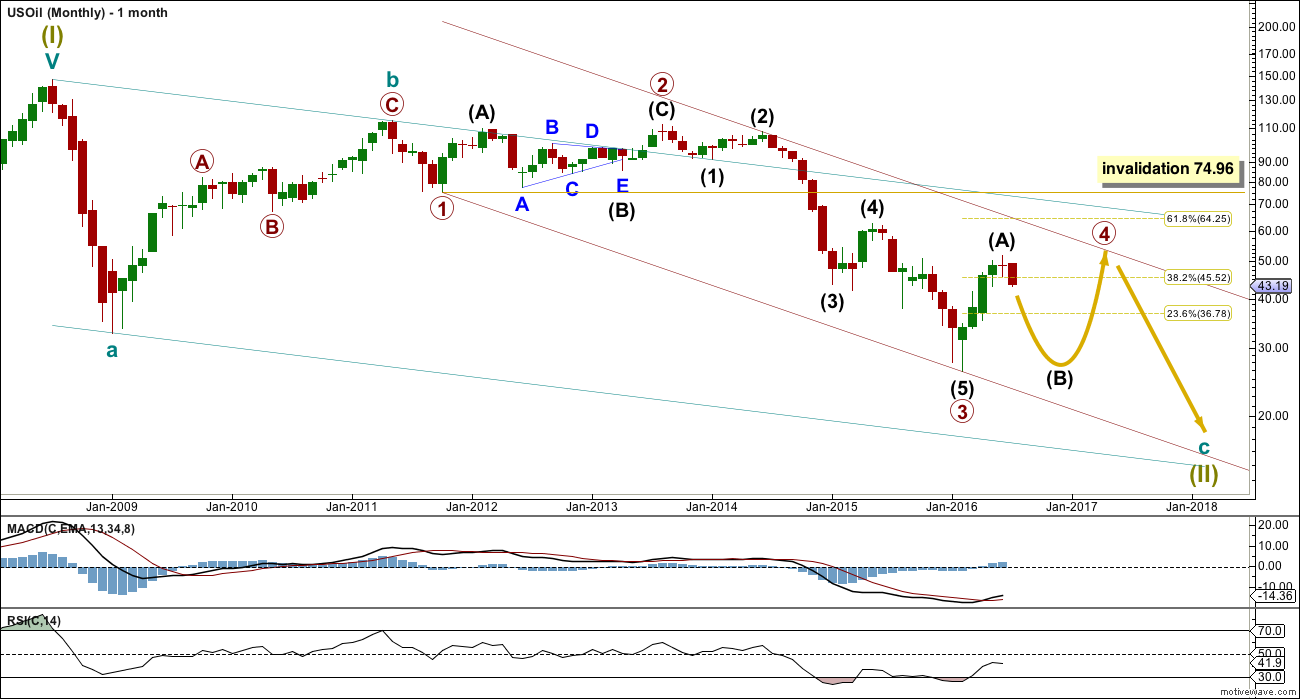
Within the bear market, cycle wave b is seen as ending in May 2011. Thereafter, a five wave structure downwards for cycle wave c begins.
Primary wave 1 is a short impulse lasting five months. Primary wave 2 is a very deep 0.94 zigzag lasting 22 months. Primary wave 3 is a complete impulse with no Fibonacci ratio to primary wave 1. It lasted 30 months.
Primary wave 4 is likely to exhibit alternation with primary wave 2. Primary wave 4 is most likely to be a flat, combination or triangle. Within all of these types of structures, the first movement subdivides as a three.
Primary wave 4 is likely to end within the price territory of the fourth wave of one lesser degree; intermediate wave (4) has its range from 42.03 to 62.58.
Primary wave 4 may end if price comes up to touch the upper edge of the maroon channel. The upper edge of this channel has been pushed up to sit on the end of intermediate wave (2) within primary wave 3.
Primary wave 4 is most likely to be shallow to exhibit alternation in depth with primary wave 2. So far it has passed the 0.382 Fibonacci ratio at 45.52. It may now move mostly sideways in a large range.
Primary wave 4 may not move into primary wave 1 price territory above 74.96.
DAILY ELLIOTT WAVE COUNT
Click chart to enlarge.
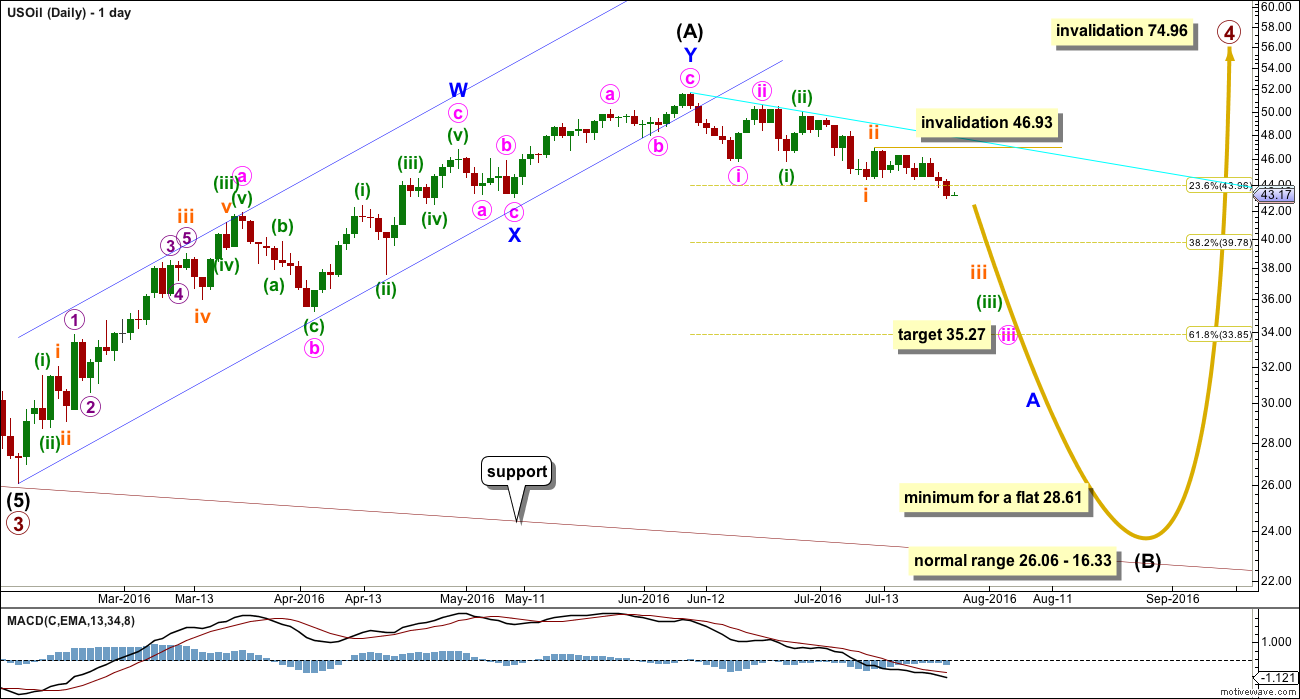
Intermediate wave (A) may be complete as a double zigzag.
If intermediate wave (A) is a three, then intermediate wave (B) is most likely to be a very deep correction. It may make a new low below the start of intermediate wave (A) at 26.06.
If primary wave 4 is to be a flat correction, then intermediate wave (B) must be a minimum 0.9 length of intermediate wave (A) at 28.61. The normal range for intermediate wave (B) would be 1 to 1.38 the length of intermediate wave (A) at 26.06 to 16.33.
If primary wave 4 is to be an expanded flat correction, then intermediate wave (B) should be 1.05 the length of intermediate wave (A) or longer, at 24.78.
If primary wave 4 is to be a triangle, then intermediate wave (B) has no minimum nor maximum. It must only subdivide as a three wave structure. It may make a new low below the start of intermediate wave (A) at 26.06 as in a running triangle.
Primary wave 4 may not move into primary wave 1 price territory above 74.96.
Intermediate wave (B) may be any of more than 23 possible corrective structures. It would most likely be a single or multiple zigzag in order to be a deep correction. It may also be an expanded flat to be deep. It may find support at the lower edge of the maroon channel.
Minor wave A would most likely subdivide as a five but may also be a three. At this stage, it looks like minor wave A may be unfolding as a five wave impulse. Within minor wave A, minute waves i and ii look complete, and within minute wave iii it looks like minuete waves (i) and (ii) may be complete. Within minuette wave (iii), now it looks like subminuette waves i and ii may be complete. Price may now be moving into a third wave down at three small degrees, so some increase in momentum should be seen if this wave count is correct.
At 35.27 minute wave iii would reach 2.618 the length of minute wave i.
Overall, this wave count still expects a few weeks of downwards movement. The clearest part of that trend may unfold this week and next. When the middle of the third wave is complete, then a series of fourth wave corrections should unfold and be followed by fifth waves down. Minor wave A looks like it is unfolding as an impulse.
When minor wave A is a complete five wave structure, then minor wave B should begin. As a B wave within a B wave, it is likely to be complicated and time consuming. Oil may then move into a consolidation. Trading this market when a B wave within a B wave unfolds should be avoided.
Within subminuette wave iii, no second wave correction may move beyond the start of its first wave above 46.93.
ALTERNATE DAILY ELLIOTT WAVE COUNT
Click chart to enlarge.
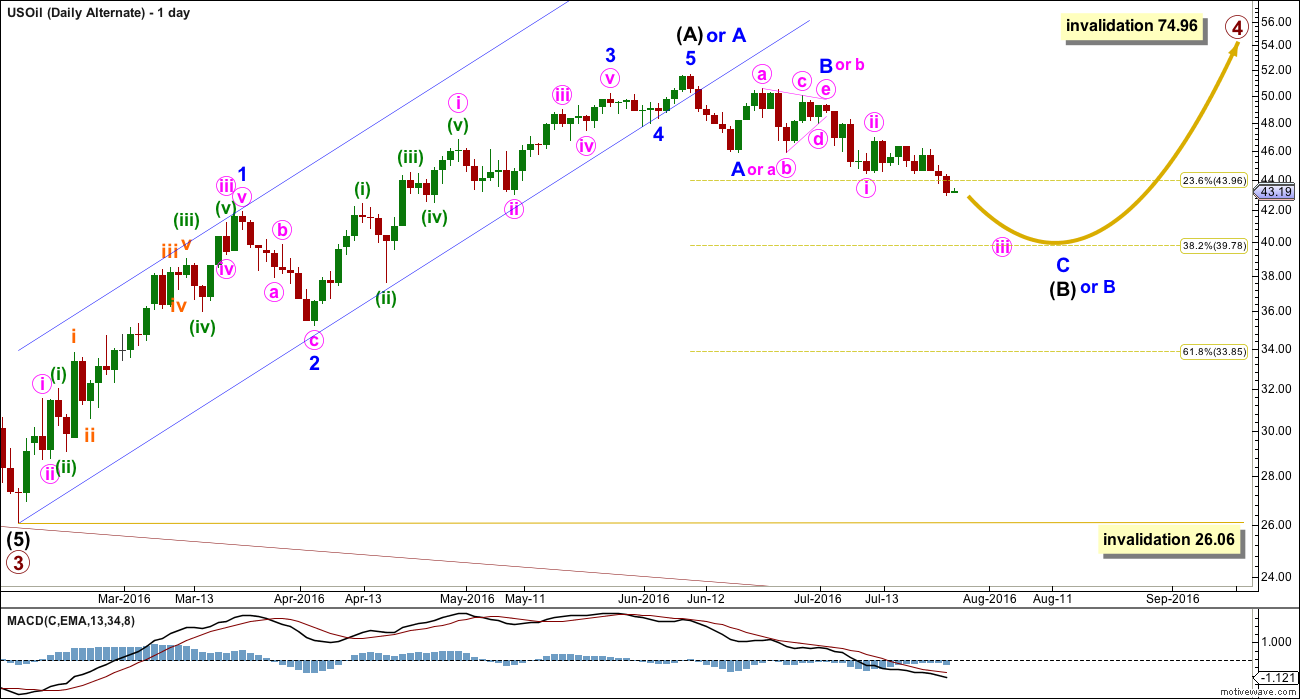
Primary wave 4 may be unfolding as a zigzag, or a zigzag upwards may be almost complete for intermediate wave (A) (as per alternate labelling on this chart).
It is possible that only minor wave A is a five wave structure complete upwards and minor wave B down is unfolding. If minor wave B is a flat correction or running triangle, then within it minute wave b may make a new high. There is no upper invalidation point for this wave count this week for this reason.
This wave count looks forced mostly because the triangle of minor wave B or minute wave b does not look right. It comes to too quick an end and the trend lines are too steep for a normal look. But it remains valid because no Elliott wave rules are broken and all guidelines are reasonably met.
If intermediate wave (B) or minor wave B is still moving lower, then it may end about the 0.382 Fibonacci ratio of intermediate wave (A) or minor wave A upwards, about 39.78.
If intermediate wave (A) or minor wave A is a five wave structure, then intermediate wave (B) or minor wave B may not move beyond its start below 26.06.
TECHNICAL ANALYSIS
DAILY CHART
Click chart to enlarge. Chart courtesy of StockCharts.com.
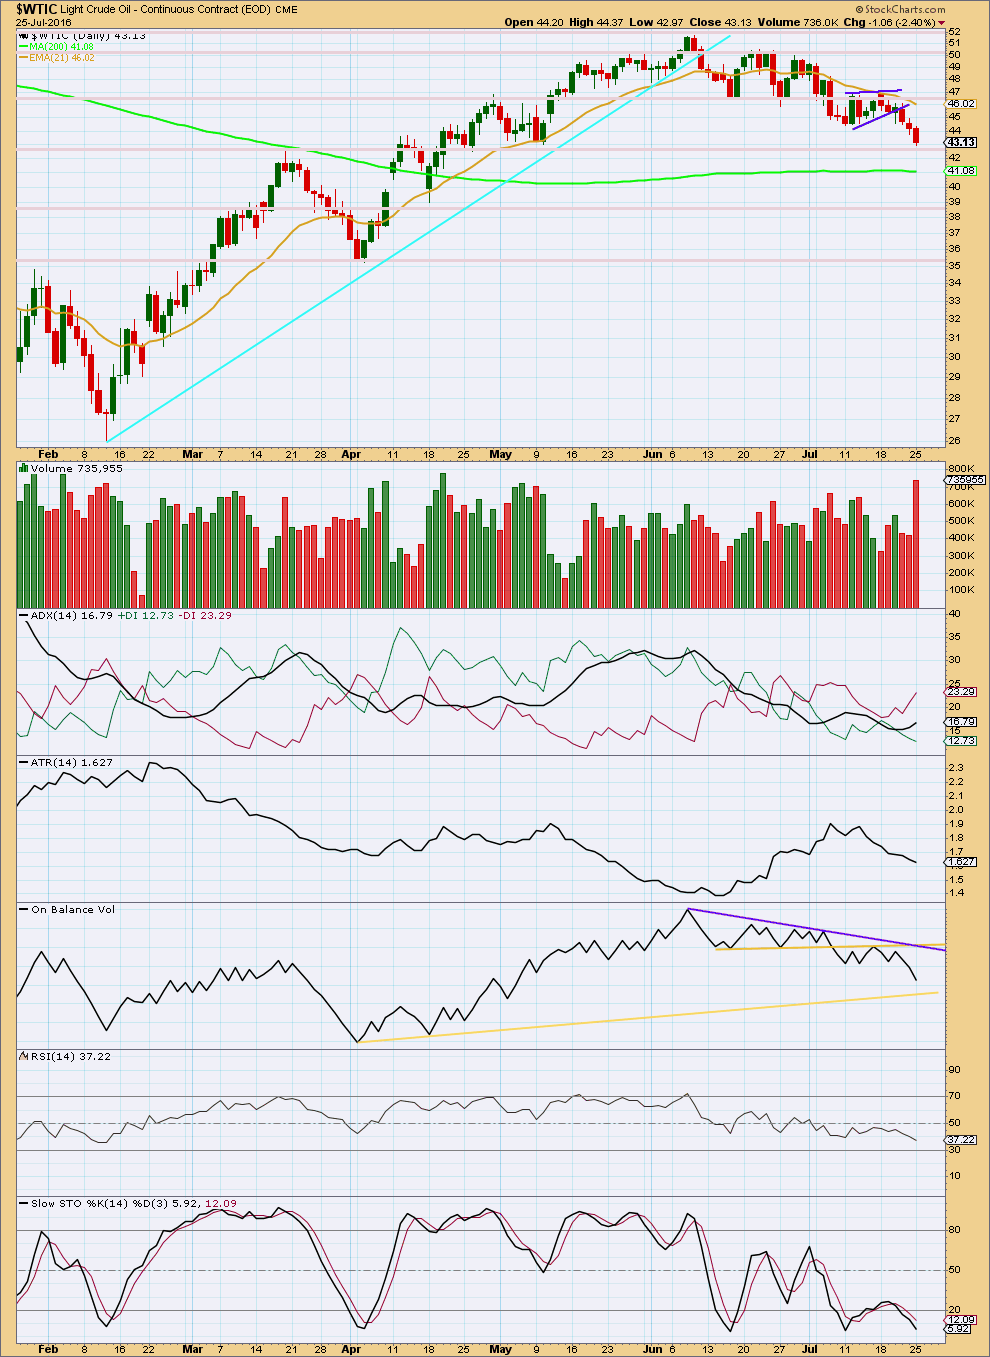
The small flag pattern correctly indicated a continuation of the downwards trend. Using the measured rule, a target of about 39.95 is indicated.
A strong increase in volume today supports a third wave down, and this supports the Elliott wave count.
Overall, volume is increasing as price is moving lower. There is support for this fall in price, so it is not suspicious. This also supports the Elliott wave count.
ADX is clear this week. It is increasing and the -DX line is above the +DX line. ADX indicates a downwards trend is in place for Oil at this time.
However, ATR disagrees as it is declining. There may be something wrong with this trend. Normally, a healthy trend sees ATR increase. This makes sense in terms of the Elliott wave count which expects this downwards wave may be a B wave. There is something wrong with B waves; they are suckers and caution is advised.
On Balance Volume is bearish with breaks below both the purple and yellow lines. Resistance is now at the upper yellow line. The next support line is not very far away. This may coincide with a bounce in price, so watch OBV carefully. When it comes down to the yellow line, then look for a bounce in price there.
RSI is not yet oversold. There is room for price to fall further.
Stochastcis is oversold but this oscillator may remain extreme for reasonable periods of time during a trending market. Stochastics is beginning to indicate some divergence with price, so this indicates caution. The trend may be weakening.
The volume spike for Monday’s session is giving a cautionary warning about this trend. Oil, typical of commodities, often exhibits volume spikes at the end of movements. That may possibly be what has happened today. This may be followed by some few days of sideways movement before the downwards trend resumes, or it may be followed by a trend change from down to up.
This analysis is published @ 09:40 p.m. EST.
Hi Lara,
Would it be possible to get an updated daily chart considering the significant declines we have seen over the last few days (as you predicted)!
Why exactly?
Price is doing exactly what the wave count expects. The targets haven’t been met yet.
It literally would be a copy and paste.
Well I guess if oil is going down so is the spx…
Not necessarily. Oil goes down…. S&P goes sideways….
They don’t appear to currently be correlated.
Yup, agree…
Lara, thanks for the analysis! 🙂
You’re welcome 🙂