
A one off Elliott wave and technical analysis of the USDJPY pair.
There may be a good buying opportunity.
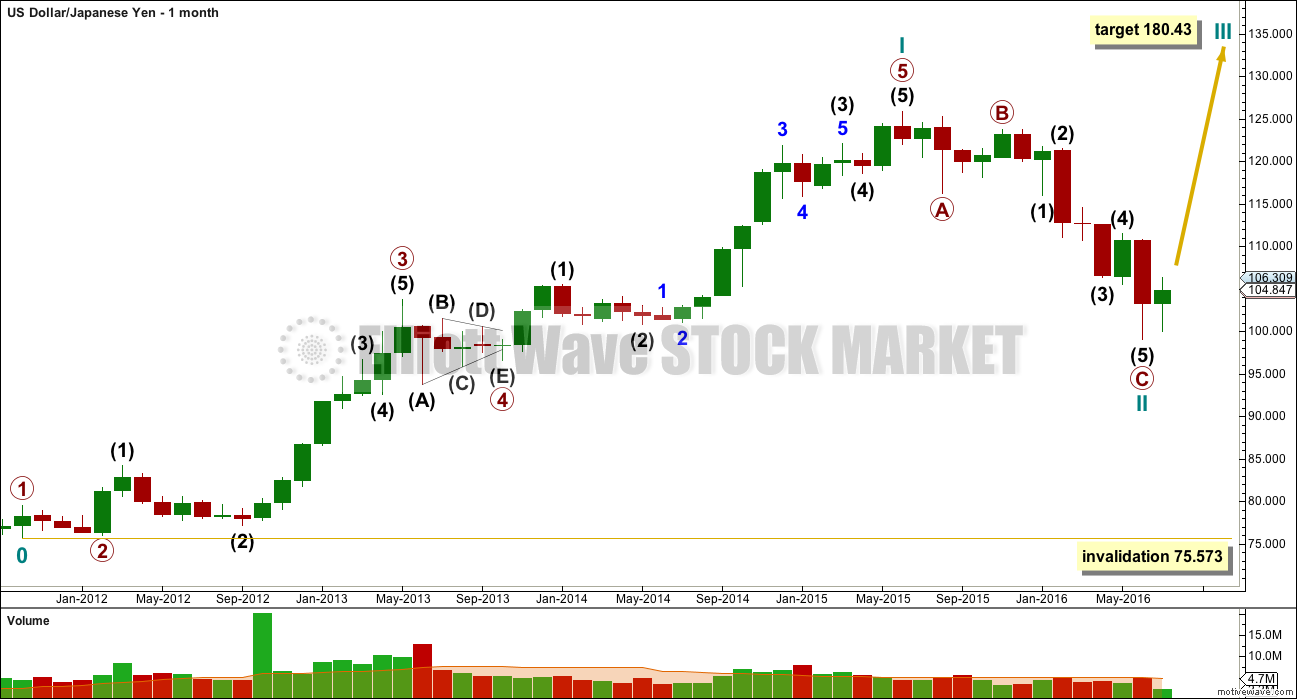
Click chart to enlarge.
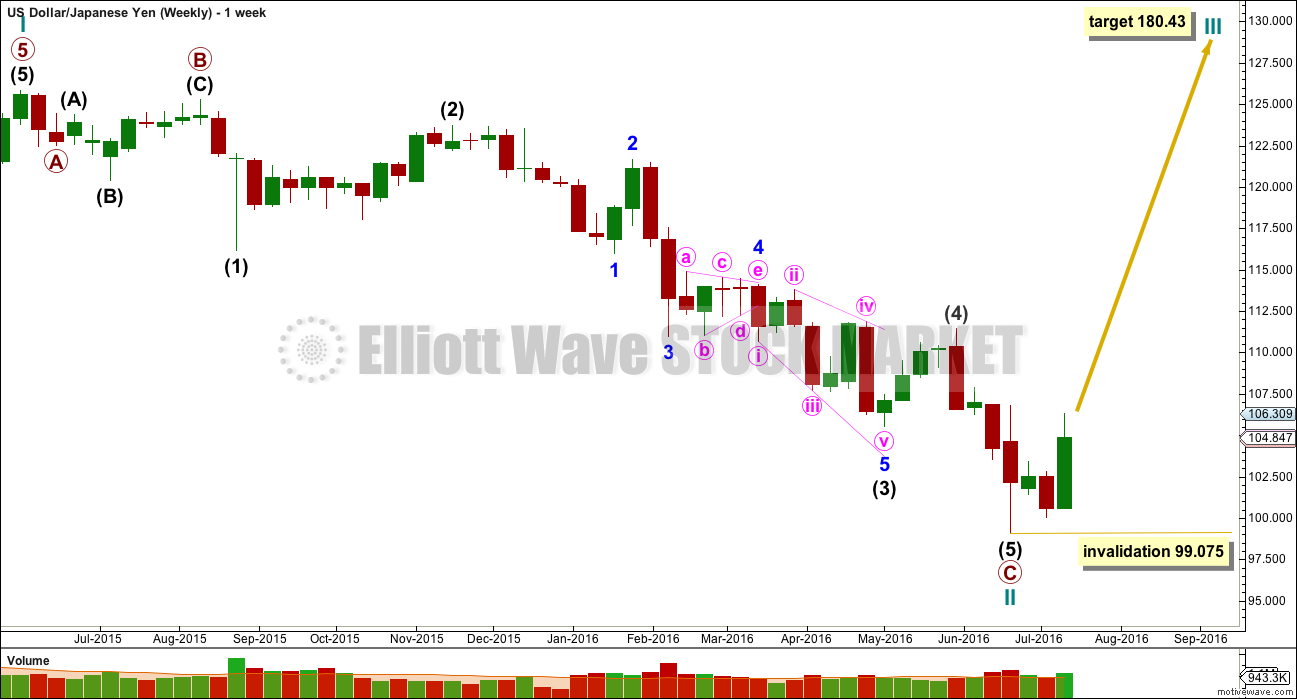
Click chart to enlarge.
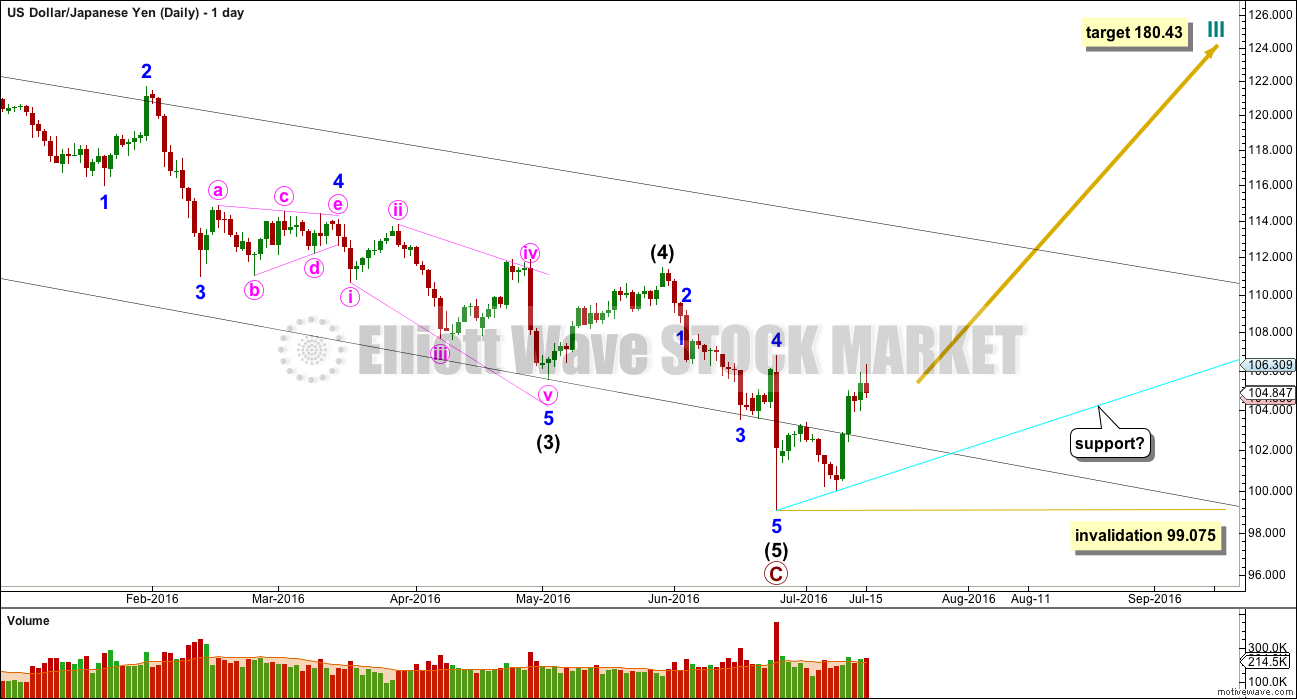
Click chart to enlarge.
Although intermediate (5) is labelled as a five wave structure, this looks very forced. It fits better as a three. That would indicate intermediate (4) is not over.
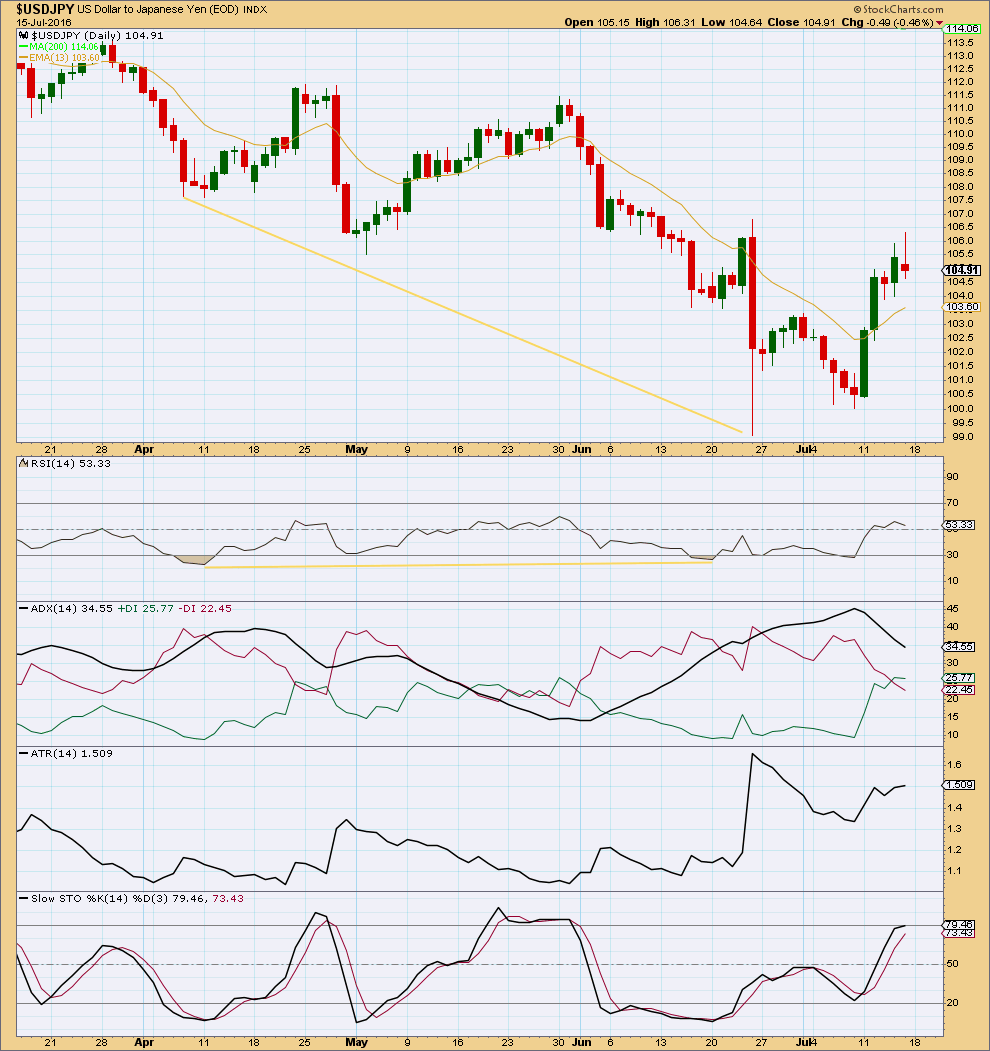
Click chart to enlarge.
Bottom line: A correction down can be seen complete for the Elliott wave count. There is divergence between price and RSI at the last low to indicate weakness.
But no trend lines have been breached to the upside. ADX does not yet indicate an upwards trend, although ATR is increasing.
The safest approach may be to wait for a break above the trend channel on the daily Elliott wave chart then enter long. A more risky approach may be to wait for a correction to find support at the cyan line on the daily Elliott wave chart to enter long. If price comes back down to this line, then risk will be lower because stops may be set just below the invalidation point.
This analysis is published @ 05:25 a.m. EST on 17th July, 2016.
Very much appreciated Lara.
EUR, GBP & CHF against USD EW structure also strongly suggests possible USD strength in the near future, which means PM’s should move in the same direction as USD if my counts are correct.
Thank you Lara for the analysis