
Last GDX technical analysis was very bearish.
Price has continued lower.
Summary: This downwards trend may be interrupted here for a bounce. How high the bounce goes may tell us what may happen next. There are multiple structural Elliott wave options open, so it is impossible to tell which wave count is correct at this time. A bounce about here is likely to end about 29.29. A new high above 31.79 would be a strong bullish signal.
New updates to this analysis are in bold.
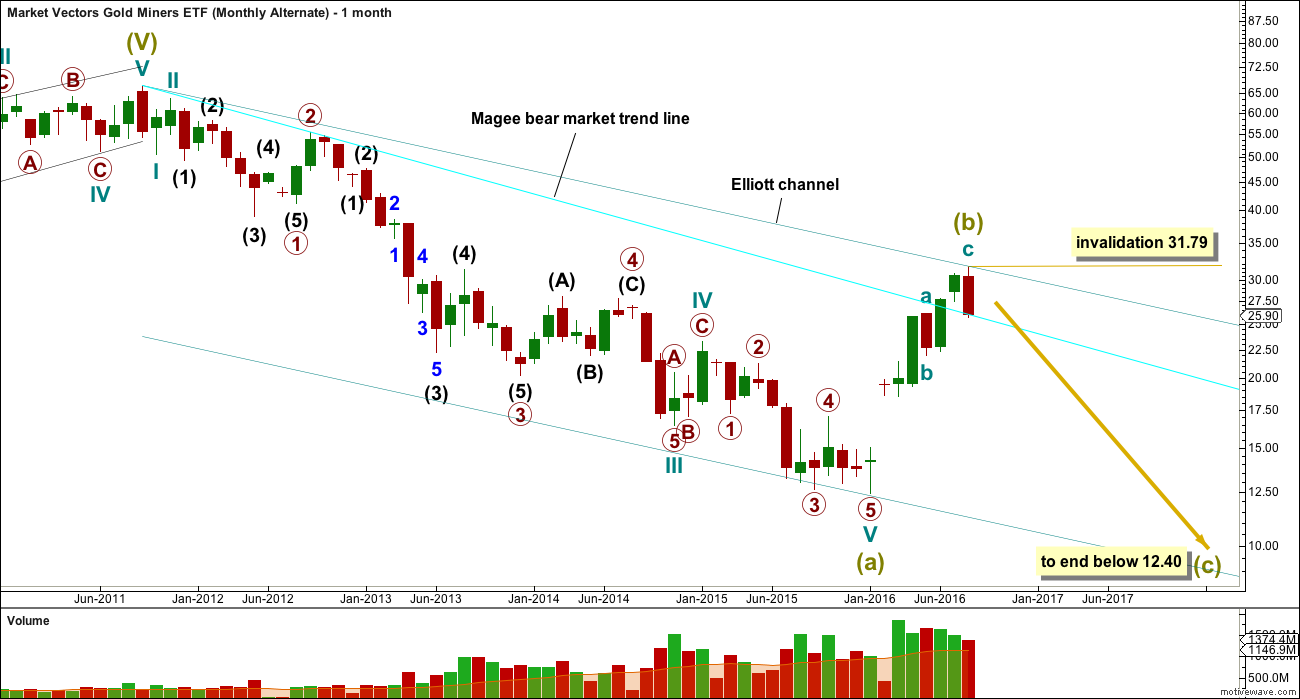
MONTHLY ELLIOTT WAVE COUNT
Click chart to enlarge.
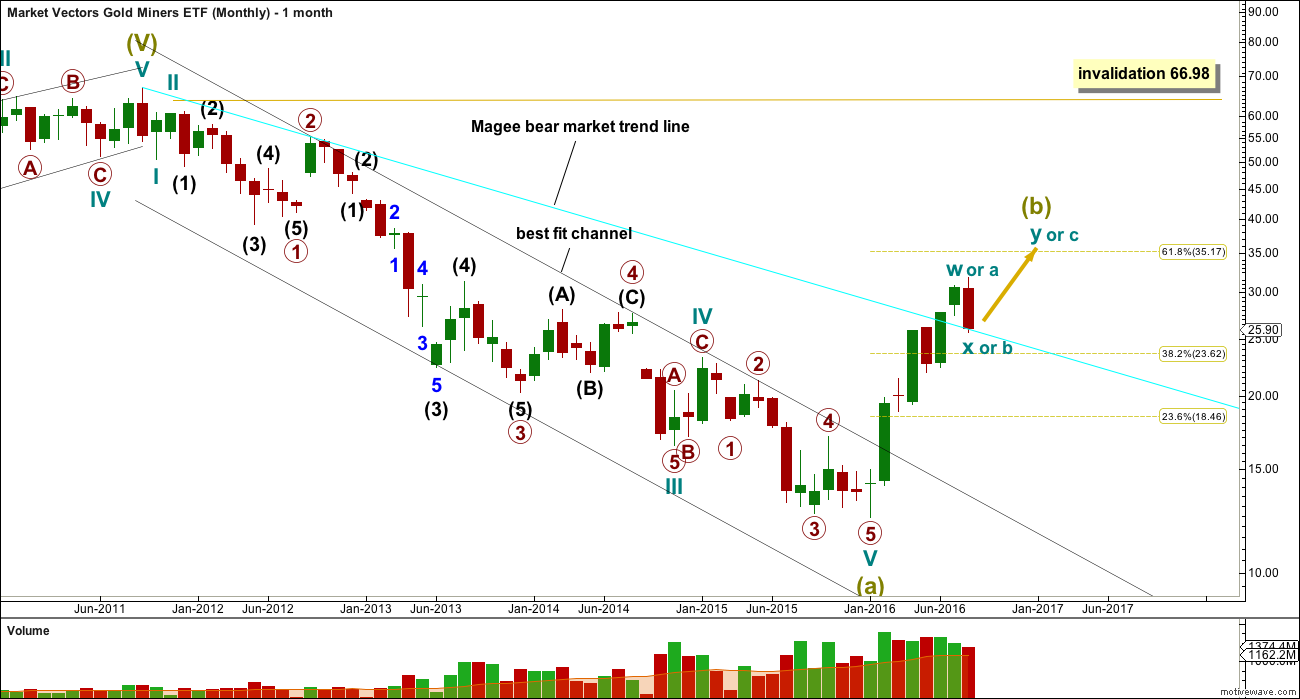
Everything for GDX is moved up one degree today to follow the Gold cash market wave count.
The whole wave down for Super Cycle wave (a) subdivides well as a five wave impulse. However, GDX does not have adequate volume to produce typical looking Elliott wave structures. As always, this wave count comes with the strong caveat that this market is not sufficient in volume for a reliable Elliott wave analysis. It is a rough guide only. The direction expected from the Elliott wave count should be fairly reliable, but targets and invalidation points may not be.
Ratios within Super Cycle wave (a) are: there is no Fibonacci ratio between cycle waves I and III, and cycle wave V is 0.33 short of 0.236 the length of cycle wave III.
Ratios within cycle wave III are: primary wave 3 is 3.48 short of 1.618 the length of primary wave 1, and primary wave 5 has no Fibonacci ratio to primary waves 3 or 1.
Ratios within primary wave 3 are: intermediate wave (3) has no Fibonacci ratio to intermediate wave (1), and intermediate wave (5) is just 0.02 longer than equality in length with intermediate wave (1).
Ratios within intermediate wave (3) are: minor wave 3 is 0.38 longer than equality in length with minor wave 1, and minor wave 5 has no Fibonacci ratio to either of minor waves 3 or 1.
Within cycle wave V, there are no adequate Fibonacci ratios between primary waves 1, 3 and 5.
The black channel is a best fit; this movement does not fit into an Elliott channel. The channel is breached very clearly and price has made a major new swing high above 17.04. A trend change was confirmed in February.
If analysis of downwards movement is correct that Super Cycle wave (a) has subdivided as a five wave structure, then this tells us two things:
1. The bear market for GDX must be incomplete because a five may not be a corrective structure, so this must only be wave A.
2. Super Cycle wave (b) may not make a new high above the start of Super Cycle wave (a) at 66.98.
Super Cycle wave (b) may be any one of 23 possible corrective structures. It may be a swift sharp zigzag, or it may be a sideways structure such as a flat, combination or triangle. It should last one to several years. It is possible that it is over. An alternate at the end of this analysis looks at this possibility.
The first movement up for Super Cycle wave (b) must be a clear five wave structure for a trend of this magnitude. It looks like this completed at the Magee trend line where price found resistance and rebounded down. This line is now breached, providing further strong confidence that GDX is in a bull market for a longer term.
DAILY ELLIOTT WAVE COUNT
Click chart to enlarge.
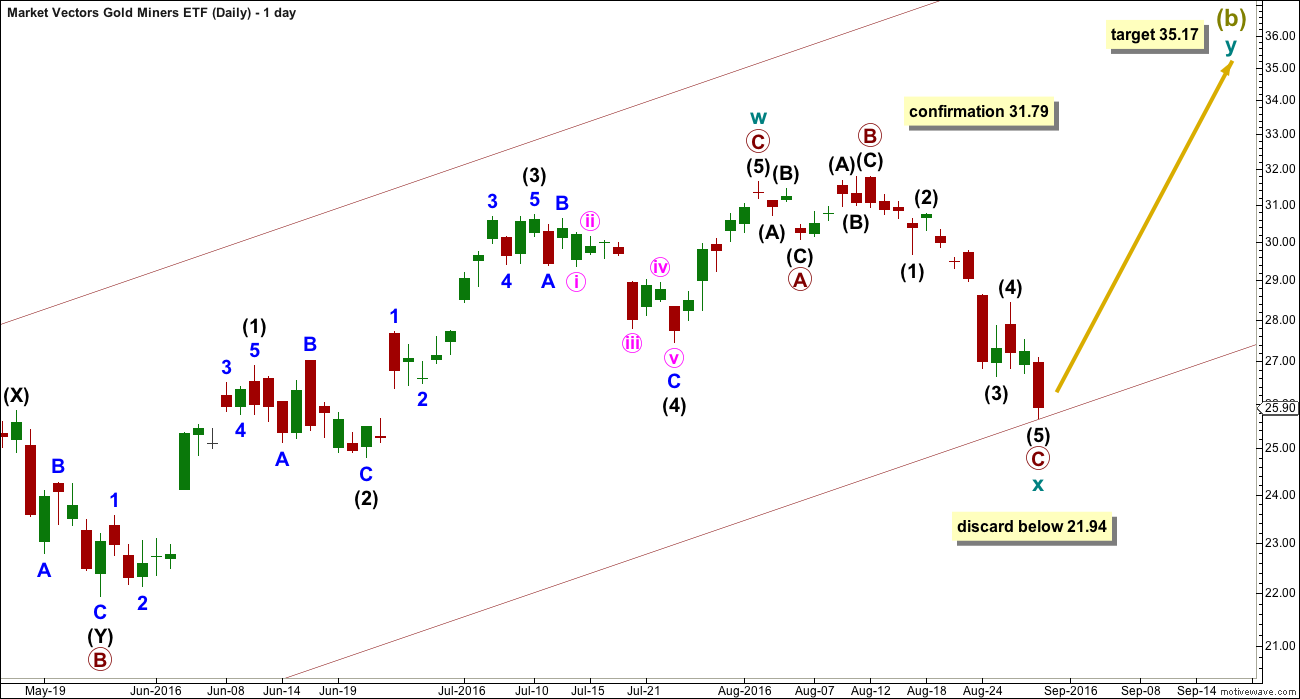
So far there is a zigzag complete upwards. The best fit for the fifth wave to end it is to see the structure over at 31.64 on 2nd of August, not at the next swing high of 11th of August. In this way the final fifth wave up looks like a five and not a three.
If a 5-3-5 zigzag ended there, then it would most likely be the first zigzag on a double zigzag for Super Cycle wave (b). Double zigzags are very common structures. This may see Super Cycle wave (b) continue higher to end closer to the 0.618 Fibonacci ratio at 35.17.
The purpose of a second zigzag in a double is to deepen the correction when the first zigzag does not move price deep enough. To achieve this purpose the X wave of a double zigzag is normally brief and shallow. There is no maximum length for an X wave within a double zigzag, but it makes no sense for X waves to make new price extremes beyond the start of the first zigzag in the double, and it also makes little sense for an X wave within a double zigzag to make a new price extreme beyond the B wave within the first zigzag.
A new low below 21.94 for cycle wave X would not fit the purpose of an X wave within a double zigzag, so a new low below this point would see this idea discarded on the basis that it would no longer have the right look.
Cycle wave X fits as an expanded flat. These are very common structures. Within cycle wave X, primary wave A fits as a three and primary wave B fits as a three and is a 1.09 length of primary wave A. Primary wave C is 0.56 short of 4.236 the length of primary wave A.
A new high above 31.79 would provide some price confirmation of this main wave count.
ALTERNATE DAILY ELLIOTT WAVE COUNT
Click chart to enlarge.
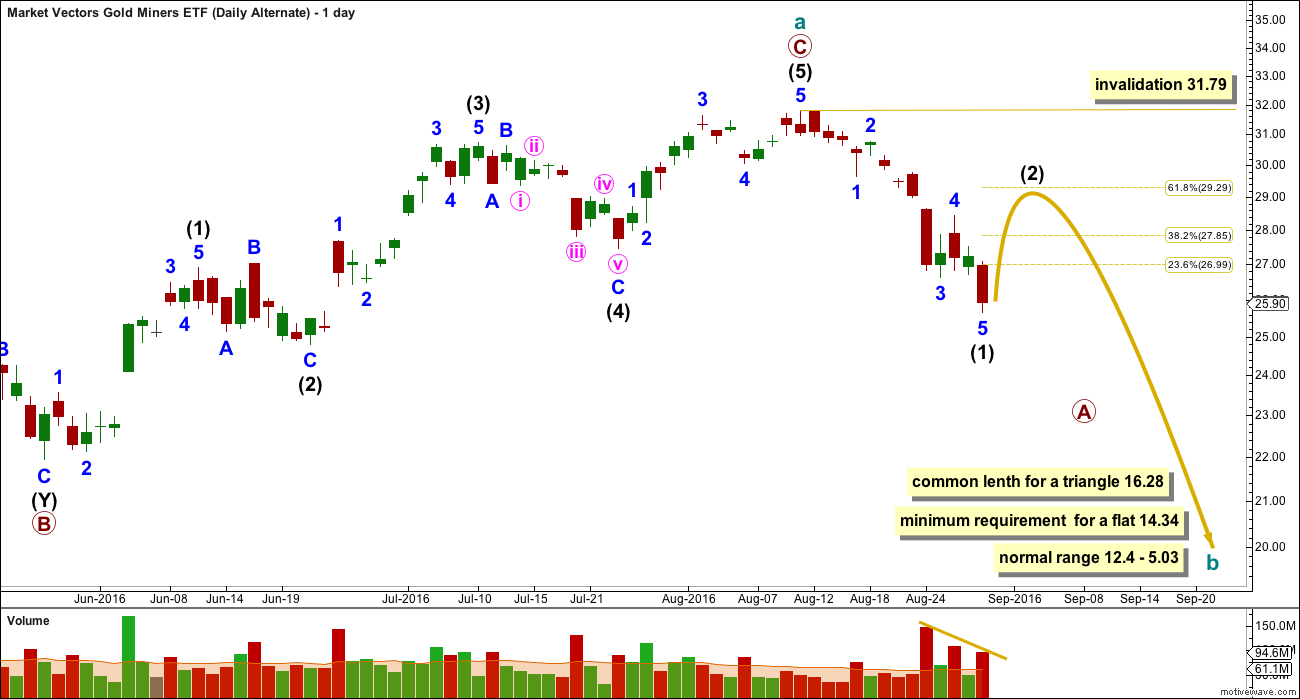
If a zigzag upwards is complete at the last high, then cycle wave a may have subdivided as a zigzag within Super Cycle wave (b).
If cycle wave a is a three, then Super Cycle wave (b) may be unfolding as a flat correction or a triangle.
If Super Cycle wave (b) is unfolding as a flat correction, then within it cycle wave b must retrace a minimum 0.9 length of cycle wave a at 14.34. The normal length for cycle wave b within a flat correction would be 1 to 1.38 the length of cycle wave a giving a range from 12.4 to 5.3. Cycle wave b may make a new price extreme beyond the start of cycle wave a below 12.4 as in an expanded flat.
If Super Cycle wave (b) is unfolding as a triangle, then there is no minimum requirement for cycle wave b within it. A common length for triangle sub-waves is about 0.8 the length of the prior wave giving an expectation for cycle wave b within a larger triangle of about 16.28. Cycle wave b may make a new price extreme beyond the start of cycle wave a below 12.4 as in a running triangle.
If cycle wave b has begun, then it should have a large clear five down. This may be intermediate wave (1) complete. Intermediate wave (2) may not move beyond the start of intermediate wave (1) above 31.79.
SECOND ALTERNATE DAILY ELLIOTT WAVE COUNT
Click chart to enlarge.
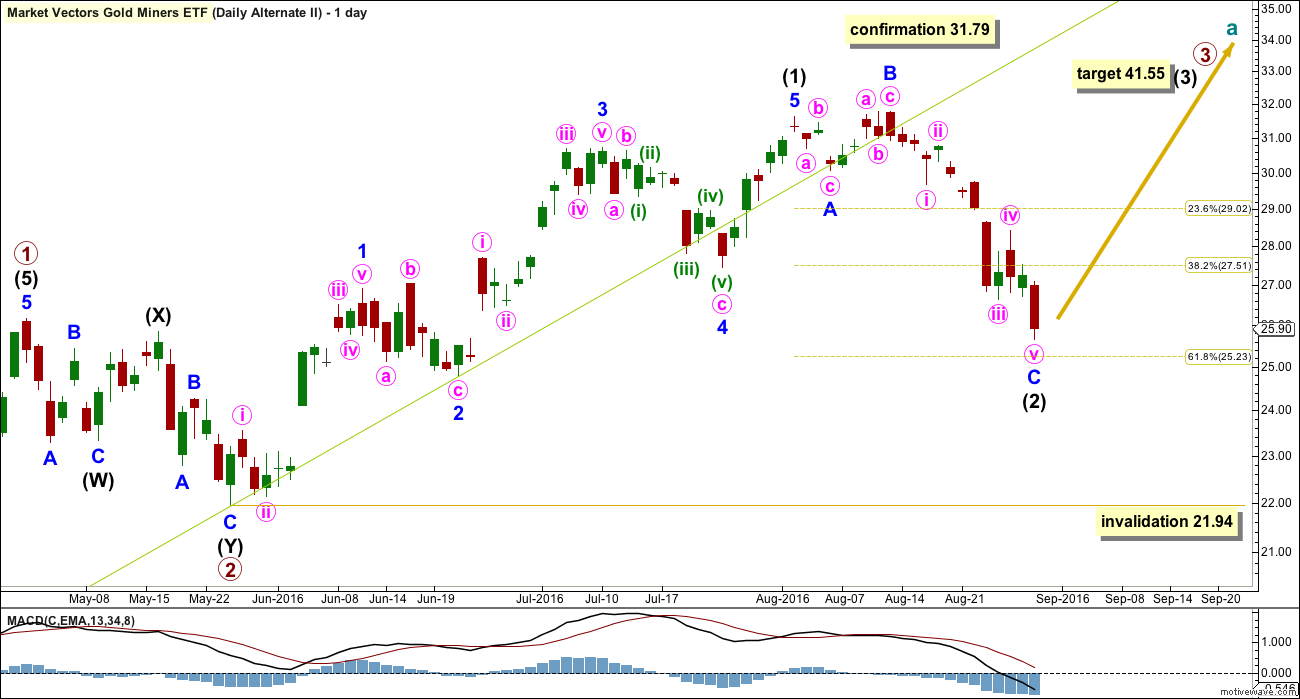
It is possible that cycle wave a is an incomplete impulse. Within cycle wave a, primary waves 1 and 2 may be complete.
Primary wave 3 may be extending and intermediate waves (1) and (2) within it may be complete. Intermediate wave (2) may be a relatively deep expanded flat ending just short of the 0.618 Fibonacci ratio of intermediate wave (1).
If a base channel were to be drawn about primary waves 1 and 2, intermediate wave (2) would substantially breach the lower edge of that channel (shown in green). This substantial breach must reduce the probability of this wave count to the least likely alternate.
Intermediate wave (2) may not move beyond the start of intermediate wave (1) below 21.94.
ALTERNATE MONTHLY ELLIOTT WAVE COUNT
Click chart to enlarge.
It is possible that Super Cycle wave (b) is now a complete zigzag. It may have ended just short of the 0.618 Fibonacci ratio and looks like a clear three wave structure on the monthly chart.
If Super Cycle wave (a) is a five and Super Cycle wave (b) is a three, then Super Cycle wave (c) downwards must subdivide as a five. Within Super Cycle wave (c), no second wave correction may move beyond the start of its first wave above 31.79.
In trying to calculate a target for Super Cycle wave (c) the 0.382 Fibonacci ratio yields a truncation and the 0.618 Fibonacci ratio yields a negative value. Super Cycle wave (c) may not exhibit a Fibonacci ratio to Super Cycle wave (a).
Super Cycle wave (c) would be very likely to make at least a slight new low below the end of Super Cycle wave (a) at 12.40 to avoid a truncation.
TECHNICAL ANALYSIS
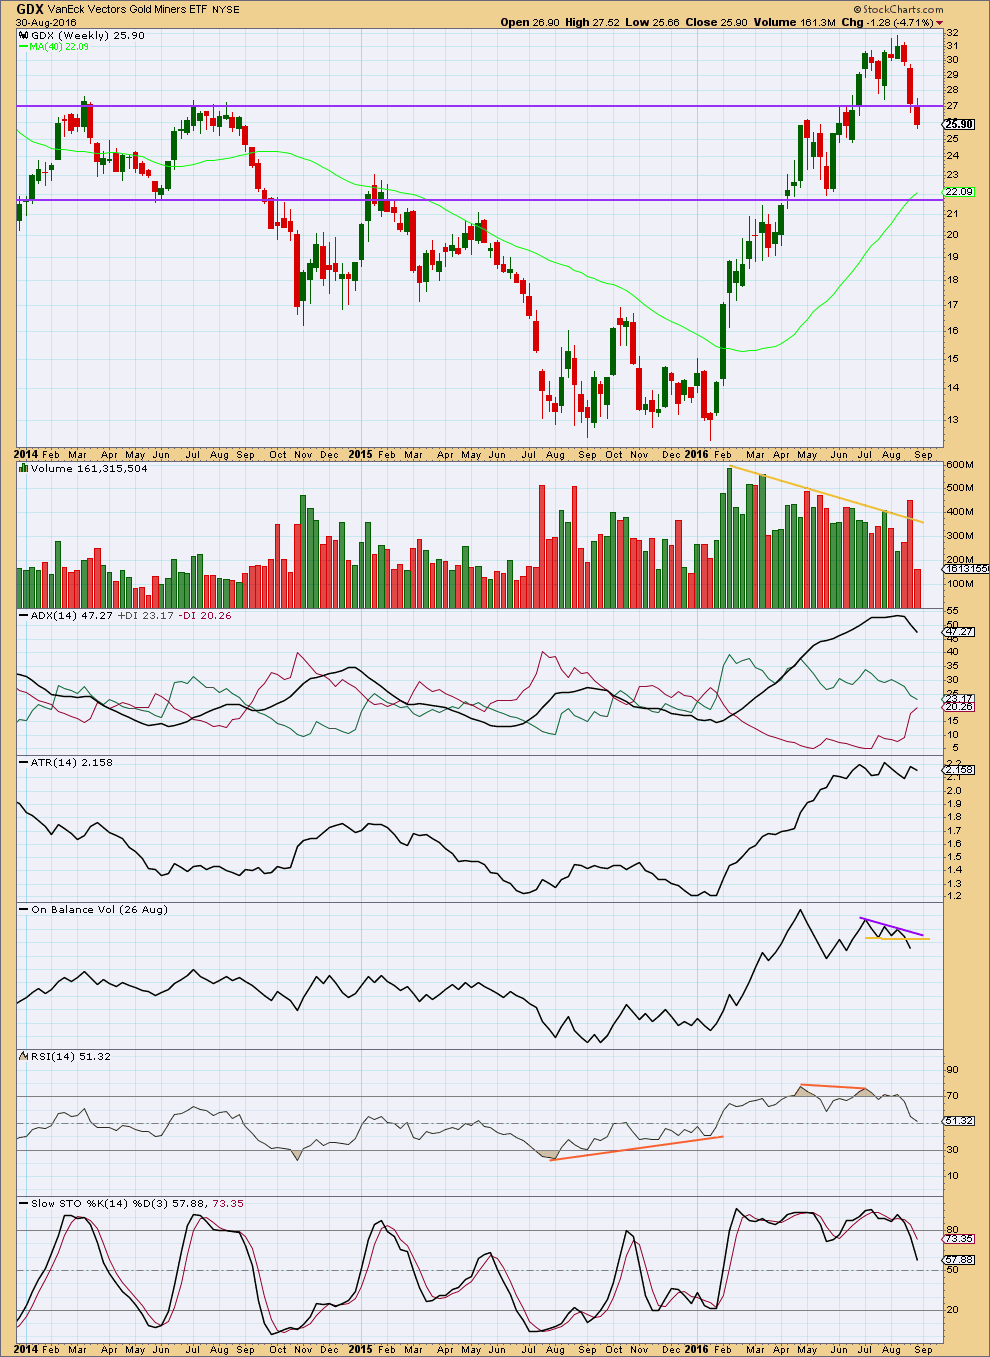
WEEKLY
Click chart to enlarge.
Volume is supporting downwards movement. It is likely that price will continue lower.
The next strong area of support is about 21.75.
Overall, volume is declining as price has been moving higher since January. The rise in price is not supported well by volume. This favours a bearish outlook mid term for GDX.
ATR has been strong and increasing. Now it is levelling off, so some decline would be expected.
ADX is very extreme, well above 35, and is now declining. ADX is indicating the trend is most likely exhausted here for GDX but a trend change has not yet been indicated.
On Balance Volume has broken below the yellow support line. This is a reasonable bearish signal.
RSI is returning from overbought after exhibiting double negative divergence with price at the last high. There is room for price to fall further, or to rise, with RSI now close to neutral. This downwards movement so far may be enough to resolve the prior divergence between price and RSI.
Overall, this analysis is still very bearish for GDX at this time.
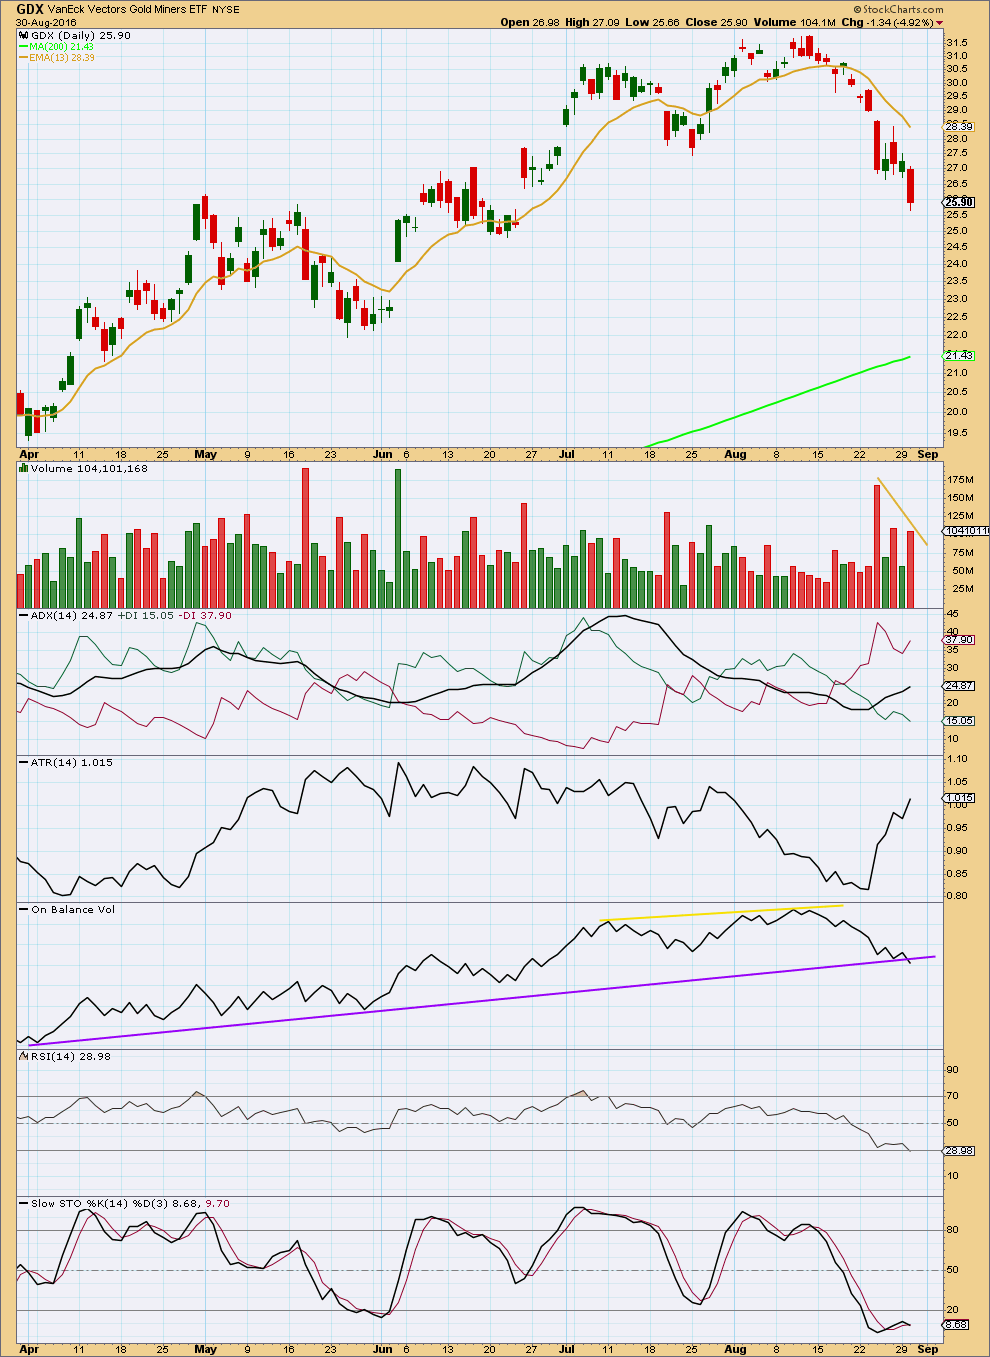
DAILY
Click chart to enlarge.
Volume is showing some decline at the end of this fall. The fall in price still has support from volume: downwards days are stronger than upwards days. But the support is waning, which does not signal that downwards movement must stop here but just indicates caution now about this downwards trend.
ADX still indicates a downwards trend is in place for GDX, and it is not yet extreme. This trend may yet continue for a while longer.
ATR agrees with ADX as it too is increasing.
On Balance Volume today gives a small bearish signal. However, this trend line has only been tested once before, so it does not have much technical significance; the signal is weak.
RSI is only just entering oversold. It shows no divergence with price yet to indicate any weakness. It may be expected that RSI may yet move further into oversold before price stops this downwards movement. If any divergence shows between price and RSI at a new low, that would be a very strong bullish signal.
Stochastics is oversold and does exhibit some divergence with price to indicate weakness in the last day of downwards movement. However, Stochastics may show double or even triple divergence at lows before price turns. It is not as reliable a signal as RSI and divergence.
Both Stochastics and volume indicate some caution now with this downwards movement. If it is not over here, then it may be over soon. Or these two may be indicating a bounce may arrive here before the downwards trend continues.
This analysis is published @ 04:12 a.m. EST.
I don´t like to open the home directory and look on open analysis. This is annoying to scroll down. I would prefer to have public analysis to be open as the private ones.
Avi Gilburt, EW – 31 Aug 2016, 9:43 AM
Below this support region, we have the $24.40 region for GDX.
Rambus sees GDX going to 24.50
https://rambus1.com/2016/08/30/gdx-update-71/
Good chart! Thanks!
Well…now we have enough options to make our heads spin! ? That’s the challenge and beauty of EW. Sometimes the picture is very clear and at other times we have to let the market tell us which path it will take.
So Lara, thanks for the extra effort to again thoroughly update GDX. There seems to be a lot of members that trade the many miner ETF’s and they appreciate more frequent updates. ?
Dreamer, I agree. It’d be nice if we could get frequent updates of GDX. Many members are trading gold miners. 🙂
The problem with GDX updates are that they are not as accurate as Gold due to the fact that GDX has much less volume than gold and doesn’t follow EW as accurately as Gold and Gold follows EW by the text book, and when in doubt then follow the gold analysis. That is as per Lara comments about GDX over the years.
That may be true, but frequent GDX analysis is a must for those trading the miners. I have found that even though GDX does have a lot of gaps due to golds overnight trading, EW still applies and is relatively accurate. That’s why I do my own EW analysis to supplement what we get from Lara. I personally think that GDX has plenty of volume for EW analysis.
Of course it’s always important to follow the EW count for gold when trading the miners.
Hi Dreamer and Lara,
Thank you for your responses, charts, etc to my questions (and others) Tues, 30th. Dreamer’s GDX chart and Lara’s GDX update is greatly appreciated.
I reviewed several sites today and come up w/similar commentary and levels.
I pasted a few strings to articles/video in case other traders would like to review:
1. good ‘public’ article and charts- GDX update from Rambus –
https://rambus1.com/2016/08/30/gdx-update-71/
2. A Gann Global Financial video http://www.gannglobal.com/webinar/2016/August/16-08-Video9-2ndChance.php?inf_contact_key=6bfe26cc4ed77b7a1061fca74af91ab0a35ac21caf5a16de9ece2ab5cafcfa82
3. The Daily Gold- published a ‘Flash Update’ this morning suggesting that the Aug. Jobs Report has been sub par to median estimates for the last 5 years. If it is sub par this Friday, a bounce is likely in the next few days.
Levels for GDX since Brexit Gap filled Aug 30:
Just below $25, then $23- close to trendline support (Mar highs/May lows), $22ish- current 400 dy. ema and rising/also 50% retrace of entire rebound, 38% retrace is in the high $24s.
GOLD Levels:
Initial support $1310-1300 with a test of $1280 as a possibility, then $1250 (Key level) to $1260. If the jobs report is good, the risk of a test of lower end of targets mentioned increases.
Good waiting, good trading…
I found that AAPL didn’t have enough volume for reliable EW analysis, so I don’t think that GDX would.
AAPL had what looked like a very clear five down on the monthly chart. Yet it went to make a new ATH. And it wasn’t a five down for wave C of an expanded flat. It made no sense. It was at that stage that I concluded individual equities don’t have enough volume.
Lara, just for the heck of it, I pulled up the last 3 month volume averages for GDX and AAPL. As you can see, GDX volume on average has been 2.29 times more than AAPL. While 73 Million shares a day seems like a whole lot of “social mood” to analyze, is it enough?
Whether it is or not, it is helpful for us that trade miners to analyze the GDX EW count frequently and use that in conjunction with your gold analysis to help with our trading decisions.
That’s why we appreciate your GDX analysis whenever you are able to provide it for us.