Upwards movement was expected but did not happen.
Price moved lower, remaining above the invalidation point on the hourly Elliott wave count.
Summary: The trend is up. The target remains at 1,582. Further and substantial confidence may now be had in the trend and targets if price can move above 1,366.87. A new low below 1,310.84 would invalidate the main wave count and confirm a new alternate. At that stage, a target for downwards movement to end would be 1,279.
New updates to this analysis are in bold.
Last weekly charts, and a more bearish weekly alternate, are here.
Grand SuperCycle analysis is here.
DAILY ELLIOTT WAVE COUNT
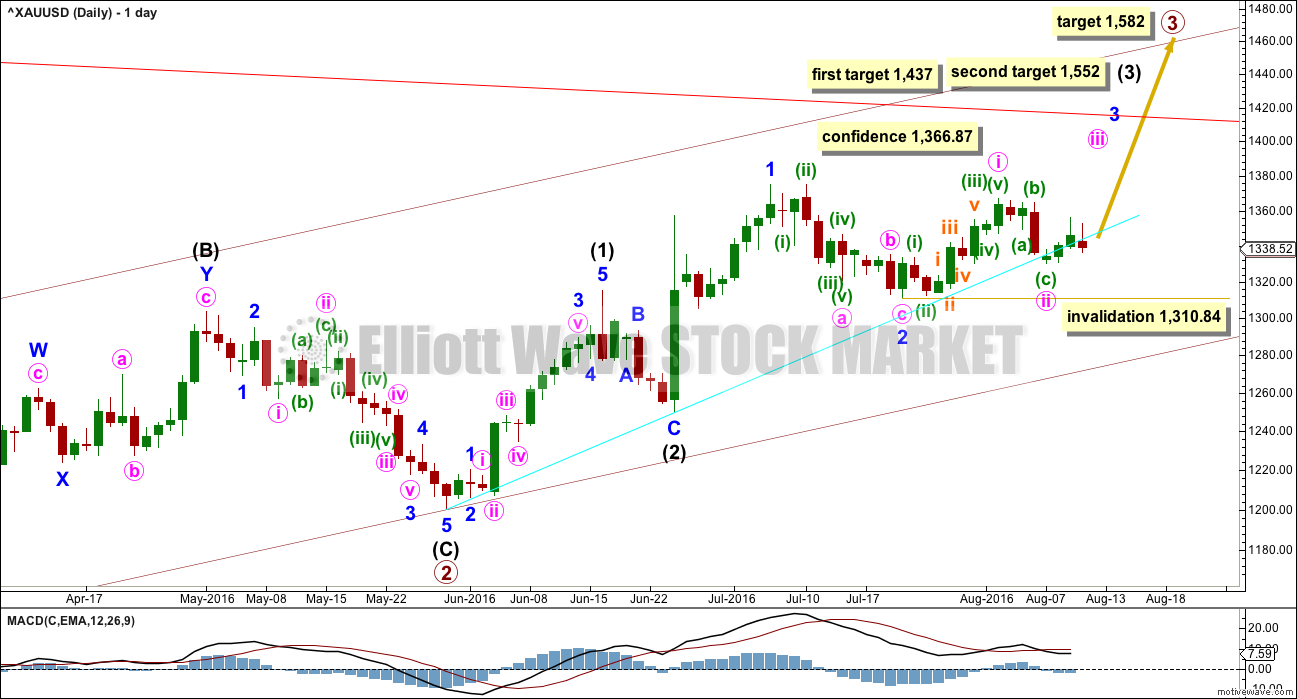
Primary wave 2 is a complete expanded flat correction. Price from the low labelled primary wave 2 has now moved too far upwards to be reasonably considered a continuation of primary wave 2. Primary wave 3 is very likely to have begun and would reach 1.618 the length of primary wave 1 at 1,582.
Primary wave 3 may only subdivide as an impulse.
So far intermediate waves (1) and (2) may be complete within primary wave 3. The middle of primary wave 3 may have begun and may also only subdivide as an impulse.
Within intermediate wave (3), the end of minor wave 1 is moved up to the last high. This fits on the hourly chart although it looks odd here on the daily chart. There was a small fourth wave correction up at the end of minor wave 1 and it subdivides on the hourly chart as an impulse. Minor wave 2 may be a complete zigzag, also subdividing as a zigzag on the hourly chart. If minor wave 2 is over, it would be 0.50 the depth of minor wave 1.
No second wave correction may move beyond the start of its first wave below 1,310.84 within minor wave 3.
At 1,437 intermediate wave (3) would reach 1.618 the length of intermediate wave (1). If price keeps going upwards through this first target, or if it gets there and the structure is incomplete, then the next target would be at 1,552 where intermediate wave (3) would reach 2.618 the length of intermediate wave (1).
The support line in cyan is adjusted today. Draw it from the start of intermediate wave (1) to the end of intermediate wave (2). Downwards corrections may bounce upwards from about this support line.
There may now be four overlapping first and second waves complete: primary, intermediate, minor and now minute. This wave count expects to see an increase in upwards momentum beginning this week.
A new high above 1,366.87 would invalidate the new alternate wave count below and provide price confirmation of this main wave count.
Primary wave 1 lasted 14 weeks and primary wave 2 lasted 12 weeks. Primary wave 3 should be longer in both price and time as it should be extended. It may be about a Fibonacci 34 weeks. So far it has lasted ten.
HOURLY ELLIOTT WAVE COUNT
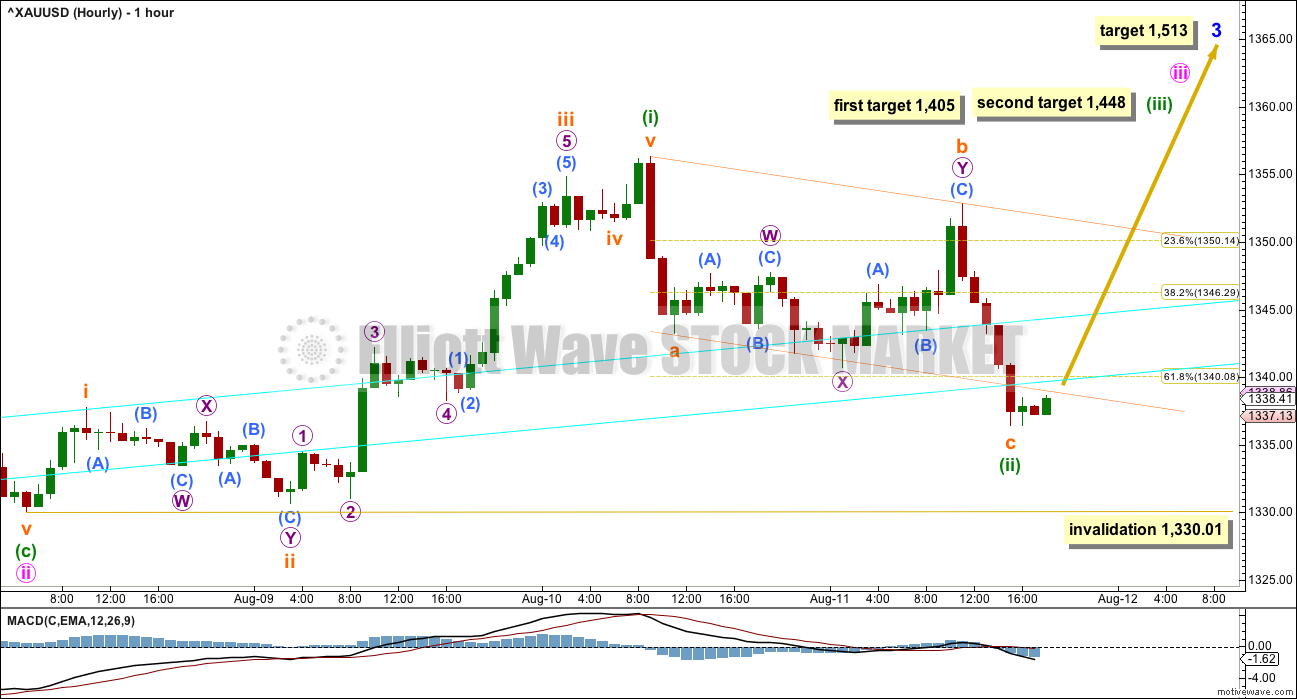
It looks like price is still finding some support about the cyan support line, not perfectly but close to it.
Downwards movement may be a continuation of minuette wave (ii) as a deeper zigzag. The channel drawn about it is redrawn. If price breaks above this channel, it would now be a very strong indication that minuette wave (ii) is complete and minuette wave (iii) upwards is underway.
At 1,405 minuette wave (iii) would reach 2.618 the length of minuette wave (i). If price gets to this first target and the structure is incomplete, or if price keeps rising through the first target, then the second target would be used. At 1,448 minuette wave (iii) would reach 4.236 the length of minuette wave (i). For the middle of a big extended third wave this Fibonacci ratio is entirely reasonable.
Minuette wave (iii) may only subdivide as an impulse. Momentum and volume should increase during the middle of it, and may continue to increase further. It is very likely to exhibit a strong extended fifth wave for subminuette wave v, ending with a blowoff top.
Minuette wave (iv) may be a brief and shallow correction; It may be over within 24 hours and not show up on the daily chart as a red candlestick or doji.
It is possible that minuette wave (ii) may yet continue lower while there is no confirmation that it is over at this point. Minuette wave (ii) may not move beyond the start of minuette wave (i) below 1,330.01.
THIRD WAVE EXAMPLE – DAILY CHART
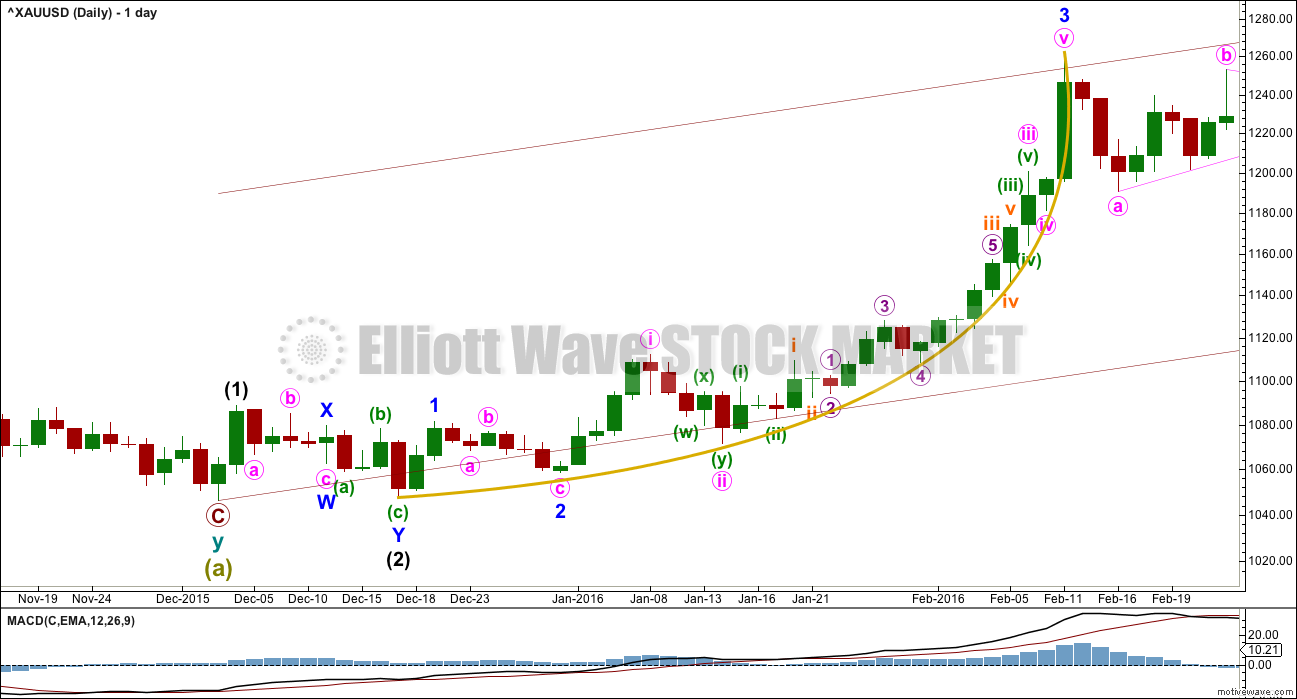
In discussing the curved look to Gold’s impulses, particularly for its third waves, here is an example.
Within primary wave 1, the third wave of minor wave 3 had a strong curved look to it. The impulse begins more slowly and has deep and relatively time consuming second wave corrections: Minor wave 2 was 0.68 of minor wave 1, minute wave ii was 0.76 of minute wave i, minuette wave (ii) was 0.56 of minuette wave (i), and subminuette wave ii was 0.64 of subminuette wave i.
The curved look comes from the disproportion between second and fourth wave corrections within the impulse. Here, minute wave ii lasted 4 days and shows clearly on the daily chart yet minute wave iv was over within one day and does not show up with any red candlesticks or doji on the daily chart.
Momentum builds towards the middle of the impulse, continuing to build further during the fifth wave and ending in a blowoff top. This is typical of Gold and all commodities.
This tendency to blowoff tops and curved impulses is particularly prevalent for Gold’s third waves.
ALTERNATE DAILY ELLIOTT WAVE COUNT
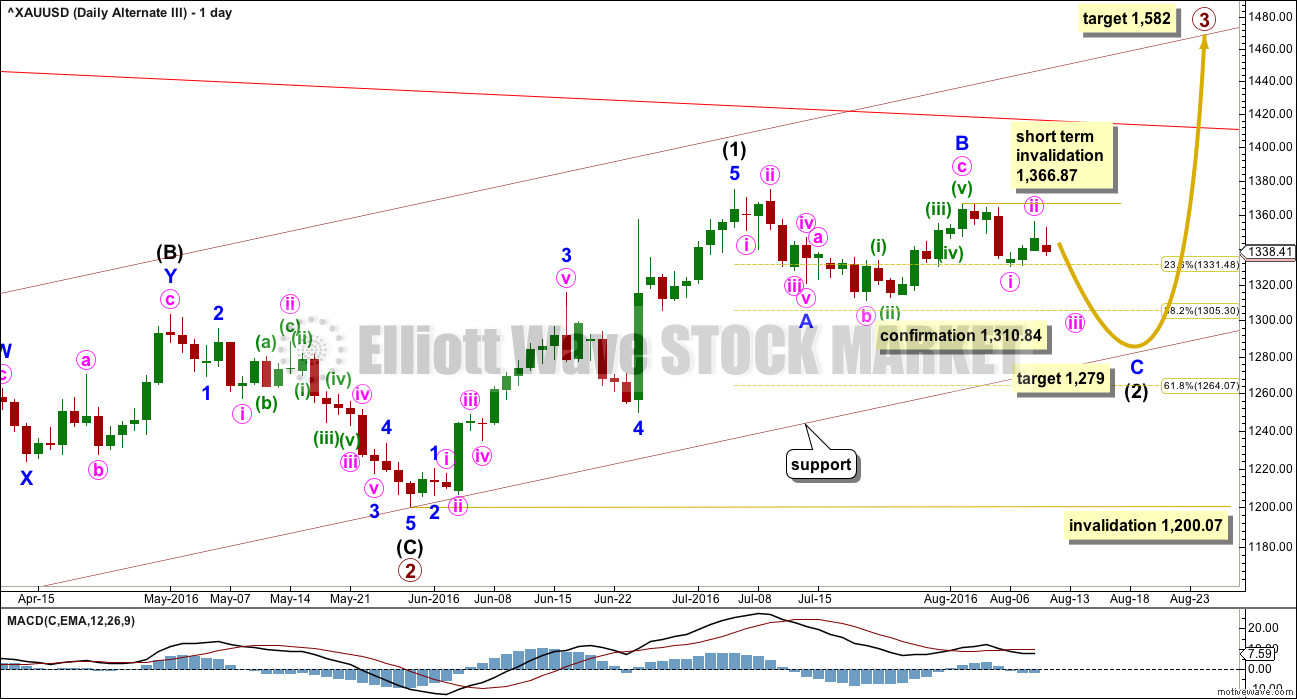
This wave count is identical to the main wave count up to the end of primary wave 2. Thereafter, what if only intermediate wave (1) ended at the last high?
This movement will fit as a five wave impulse, although it does not have a very good look on the daily chart. This reduces the probability of this wave count.
If intermediate wave (1) was over at the last high, then it may have lasted 27 days. So far intermediate wave (2) may have taken 25 days and would still be incomplete. The proportions of this part of the wave count look slightly better than the main wave count.
There is a problem now with structure on the hourly chart within minor wave C. Minute wave i would have to be complete. It will fit on the hourly chart, but it does not have a good look as a five and looks better as a three on the hourly and daily chart levels. This slightly reduces the probability of this wave count.
Within minor wave C, minute wave ii may not move beyond the start of minute wave i above 1,366.87.
Minor wave C must be a five wave structure. So far within it minute waves i and ii would be complete. Minute wave iii downwards should be underway. It is concerning for this wave count today that the small red daily candlestick comes with a decrease in volume. A third wave down should be supported by volume. Although price did move lower today, this wave count is not supported.
At 1,279 minor wave C would reach 1.618 the length of minor wave A. Price may end downwards movement when it finds support at the lower edge of the maroon base channel drawn about primary waves 1 and 2.
Intermediate wave (2) may not move beyond the start of intermediate wave (1) below 1,200.07.
TECHNICAL ANALYSIS
WEEKLY CHART
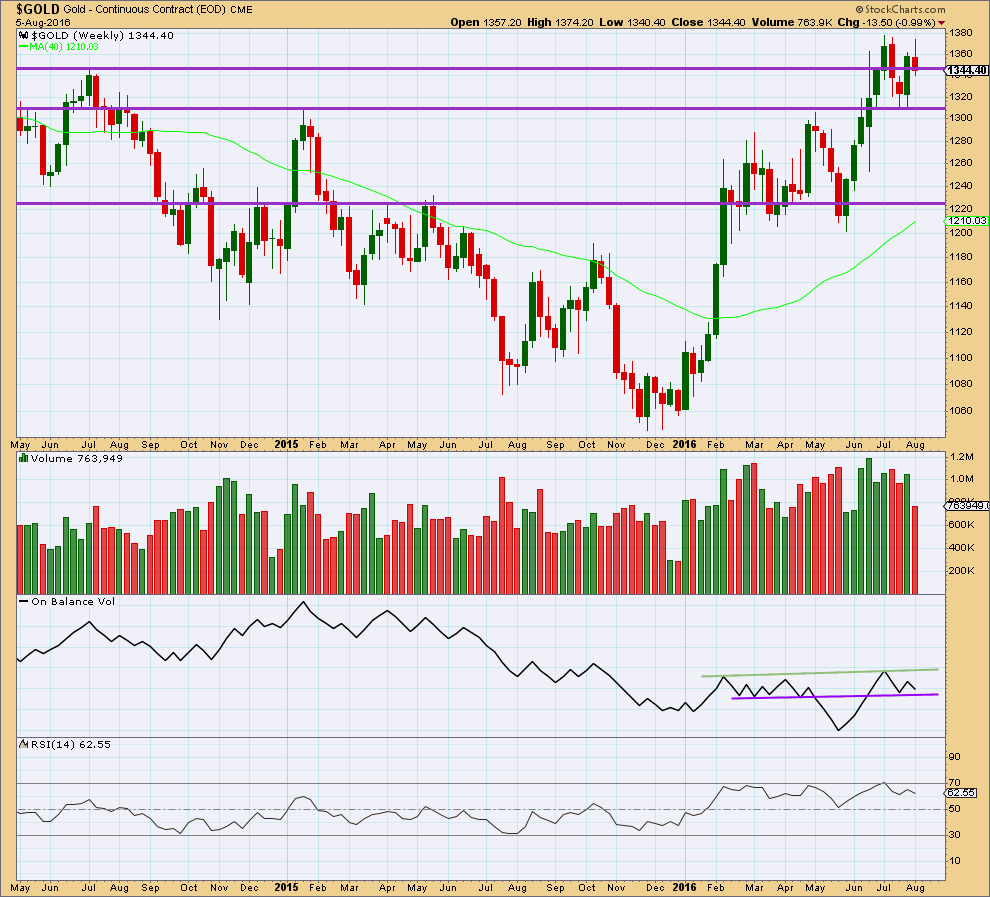
The week before last completed a bullish engulfing candlestick pattern supported by stronger volume than the prior downwards week. Last week made a new high, then completed a red candlestick on lighter volume. Overall, the fall in price last week is not supported by volume at the weekly chart level. Last week looks to more likely be a corrective movement than a new trend.
On Balance Volume is still relatively bullish above the purple trend line, which is redrawn at the end of last week. A break below the purple line would be bearish. A break above the green line would be bullish.
RSI is not extreme. There is room for price to rise or fall.
DAILY CHART
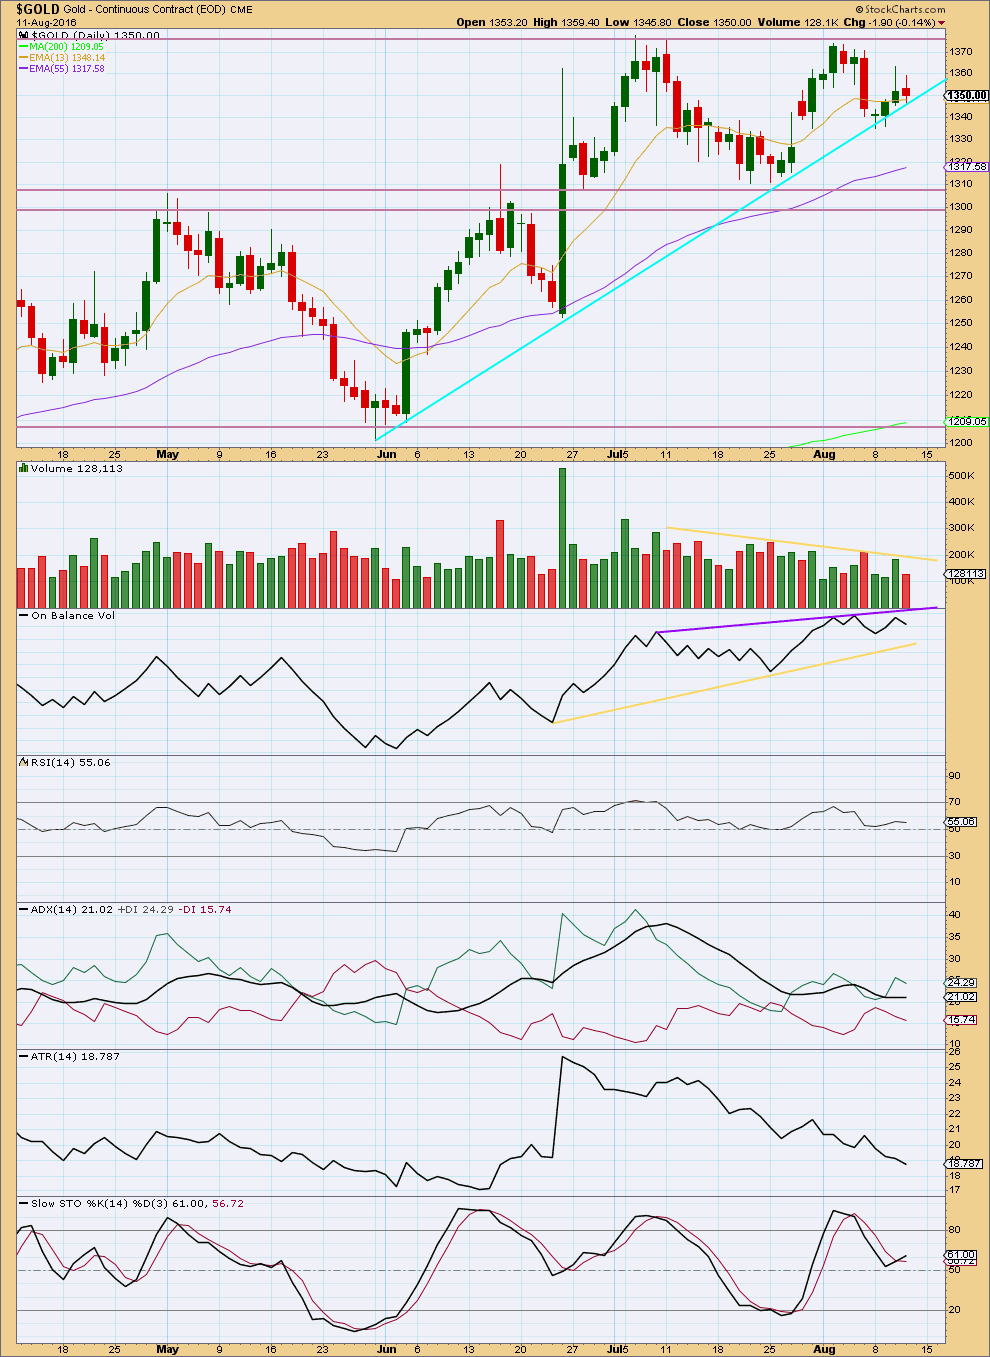
From the last high on 2nd of August, volume increased as price fell. The fall in price was supported by volume.
Price moved higher on increased volume yesterday and today price moved lower on decreased volume. This short term volume profile is now bullish and supports the main Elliott wave count over the alternate. It looks today like price is finding support about the cyan trend line.
It looks like price is range bound between resistance about 1,375 and support about 1,305. ADX has been mostly declining since 12th of July and price has overall moved sideways within this range. ATR has also been declining during this period, This supports ADX in expecting the market is consolidating. Volume is declining as price moves sideways.
ADX today has very slightly increased for the second day in a row, and it may now again be indicating an upwards trend may be returning. With ATR still declining though, this is not as clear as it could be. If ATR turns upwards, then some reasonable confidence in an upwards trend may be had.
It is the upwards day of 8th of July, during this big consolidation, that has strongest volume suggesting an upwards breakout is more likely than downwards.
It should be expected during a consolidation that price will swing from support to resistance and back again. Stochastics may be used to indicate when one swing ends and the next begins. At this stage, Stochastics is returning from overbought and is now about neutral. A downwards swing may be expected to continue until Stochastics reaches oversold and price reaches support about 1,305 at the same time.
Price swings during a consolidation do not move in straight lines, and support or resistance may be overshot yet price returns back to within the consolidation. This is one reason why consolidations are so difficult to trade. The final expected swing never eventuates, as finally price breaks out of the consolidation. This is another reason why consolidating markets are difficult and more risky to trade than trending markets.
RSI is close to neutral. There is room for price to rise or fall.
Trend lines on On Balance Volume are redrawn. A break above the purple line would be a bullish signal. A break below the yellow line would be a bearish signal.
This analysis is published @ 07:53 p.m. EST.

Why cant we see the volume profile in a diffrent way lara ?
I mean that in the confusing scenario like we had on friday inspite of looking at the volume of whole day why cant we look the 4 hourly candle volume and diffrentiate between the strength of the upward and downward volume and make a conclusion.
Yaa it can be a stupid thought but its a thought 🙂
Lara any idea when gold might begin moving up in a strong bullish hourly channel with strong bottom support like months ago when it did it for about a month solid?
I thought it should have started to do that this week, but it hasn’t.
Imminently?
Third waves can start a bit slowly. Second wave corrections at the start can be more time consuming and deep, when they do that they convince us there will be no third wave.
There’s confusion with volume again today. StockCharts shows higher volume for today. It that’s correct then it supports the alternate wave count over the main.
But COMEX data shows lighter volume today; 14.6K today compared to 19.2K yesterday, and 30.4K the prior day which was upwards. COMEX volume data profile is bullish. StockCharts is bearish.
Lara. I can see why.
It has got to do with the interpretation of the submicro 3 data point.
In the COMEX data you use, you have a point lower than submicro 3 and hence terminates minuette 2. The subsequent price movement has got to be bullish, and their data profile supports this.
In the StockCharts and also the pmbull, ProRealtime data feed, the submicro 5 point you use is not the lowest, and a further drop is indicated. Somehow, they have the data profile to support this.
This is too coincidental. Does this imply that one or the other of the data is “massaged”?
Gold dropped to the 1 hour gold trend line today and Monday and Tuesday.
The top and bottom of the trend line was helpful this week.
http://www.pmbull.com
Richard,
I use the PMbull.com gold chart, both ‘Live’ and ‘Non flash’. This ‘snag’ you took looks like the ‘Live’ charts on hrly. basis. Many times, as I change the TF on ‘Live’ chart, these trend lines show up different frames, but disappear within a second.
How are you managing to get the trend lines to remain Visible on each TF?
Thank you,
Melanie, that is a great question. The disappearing lines happen to me too, which is frustrating. I was clicking on the + or – sign to get the lines to show up. My brother sent me this chart with the lines, which is useful so you are aware of them and help you trade. I’ll ask him and let you know.
Today we will surely have a volume spike due to this whipsaw.
Dont u think lara ?
See my comment about volume above.
Looking at COMEX data for volume on the hourly… the fall in price to todays low came on lighter and declining volume.
This doesn’t eliminate the possibility of a third wave down starting, sometimes they can start a bit slow.
But it doesn’t support the idea. The conclusion must be that at this stage that downwards movement looks more likely corrective / counter trend than the start of a new trend down.
Also, as price rose to the high for today it did it on stronger and increasing volume.
As for the alternate, there is a problem now with the possible structure of minute ii.
Within it minuette (c) would be truncated by 1.24. That’s not huge, but it’s not small either.
This is what it would look like on the hourly chart.
Publishing this does not mean I think it’s increased in probability today. At this stage I don’t.
Volume today will be important, and I won’t have that until StockCharts data is finalised and the session is closed.
If volume shows a good increase for today then it would favour more downwards movement.
If not, then it would favour the main wave count. Light volume would indicate a counter trend movement.
GLD volume indicates volume will be higher today than yesterday and previous 4 days, and i guess the candlestick might qualify as an outside reversal day? or is it bearish engulfing? Not sure i’m not a candlestick expert really just have a vague idea
It’s a bearish engulfing candle on higher volume. GLD is making a series of lower highs and lower lows which is the most basic definition of a downtrend. No offence to Lara, but I think the main wave count can be virtually eliminated even though it hasn’t been invalidated especially without a strong bounce from here.
I don’t know if i would move that fast to get super bearish – this is a sideways chop and during the summer doldrums. That said, i’m maintaining a small short term short against a very large long term long. We have to see further confirmation to get further bearish i believe
I never said I’m getting super bearish. A test of the Lower BB is all I would look for right now.
The real body of todays candlestick isn’t big enough, it’s not engulfing yesterdays. So no, not a bearish engulfing pattern.
The real body today is very small, it could almost be a doji. Almost… not quite.
I’m not sure that GLD volume will mirror the COMEX volume, though. Also, GDX closed on lower volume.
Outside day, yes. Bearish engulfing, no.
Lara,
This could be an acceptable rare running flat with bearish implication?
? not sure what you mean by “this”
see my hourly chart for the alternate maybe?
Yes , looking at your alternate hourly chart, a rare running flat to go down.
Based on past experience bear running flats create large down moves, $40 to $100+ over 1-3 weeks
Well that’s confusing isn’t it! What a massive whipsaw.
I think todays price action illustrates why traders need to give the market room to move, and be patient. Have a plan and stick with it.
It looks like minuette (ii) has continued as a double combination: zigzag – X – expanded flat.
The expanded flat fits perfectly.
The only problem is subminuette y finishes below subminuette w, enough to give the movement a downwards slope. It’s still not a sharp slope, there is some sideways look due to the deep X wave, but still, if I’m going to be really picky that’s a slight problem with the wave count.
But every thing fits well for the main wave count.
The short term invalidation for the alternate now can be at 1,355.12. A new high above that point at this stage would offer strong confidence that the main wave count is correct and the alternate is wrong.
Lara. I was again defeated by the data feed.
In the charts that I use, submicro 3 (1333.30) is lower than the point at which your submicro 5 is.
I guess that’s where the confusion sets in. I am still waiting for minuette 2 to complete, whereas your data feed clearly indicates it is over.
After a good night’s sleep (sans waves), I can now see things more clearly.
If Lara’s data feed is correct, then we are in a slow ascent for Minuette 3.
If the data feed I use is correct, then minuette 2 is incomplete. In fact, we are in the midst of a triangle for submicro 4.
As I see it, the triangle only needs to complete the E wave. The last rise at closing reaching 1336.74 leaves us dangling in suspense. It has shown 2 subwaves, and needs a third wave up to complete. The high it reaches is telling. If it exceeds the last high of 1338.25 then the triangle is invalidated. If not, then I’m afraid we will see a submicro 5 down to finish up minuette 2 on Monday. If that drop falls below 1310.84, the alternate is in play. For the alternate, I can see minuette 2 of minute 3 completed. The continued drop will bring in minuette 3.
Graphic for the triangle for submicro 4.
Lara’s submicro 4 is the point “a” in the triangle.
Submicro 5 is “b”.
Do note that it the pmbull data feed, the point “b” is higher than the point labelled submicro 3.
At the 10 minute time frame, wave “d” of the triangle is not visible, and so are the two subwaves of “e”. I need to go down to the 1 minute to resolve those.
If Lara’s data feed is correct, then the points labelled “a’ and “b” will be the first two waves of a subwave of minuette 3 up.
Those will also be the first two waves of minute 3 for the alternate, at minuette level.
We will need to wait until Monday to resolve all these. Lara had already posted the contradiction in the volume data from both COMEX and StockCharts. And so, there is no clarity.
Apologies. Typo.
“Those will also be the first two waves for the alternate, at micro 3 level of subminuette 3 of minuette 3 of minute 3.”
I agree. No need to get our undies in a twist over today’s price action imo. We have not seen the end of this impulse up as this is not the way they typically conclude. I have been adding to my long positions on the pullbacks. My lines in the sand are 1310 for Gold and 1920 for silver. Until they are violated. preferably on high volume, no worries. I do agree the price action has been weak in PM and the miners but the old adage about assuming the trend remains the same until proven otherwise obtains.
Miners may have bottomed at 2:56 pm and gold at 12:48 pm at 1333.30.
1333.3331 <- Reversal Point of Gold
How should one understand the following action ?
Any comment ?
http://www.zerohedge.com/news/2016-08-12/european-close-sparks-selling-panic-precious-metals?
Typical. Banksters deciding it’s time to shake the trees and dislodge a few weak bulls. Any spike down next week will be massively bought. The paper shuffle has been loosing its potency of late. I wish they would change the COMEX rules regarding delivery so small players can take possession of the metal. I cannot believe it is legal for them not to deliver the metals under the current rules for futures contracts. 🙁
Great buying opportunity now almost at today’s low, when fear is in the air and weak hands panicking and dumping.
Today reminds me of last Friday a big down day in gold and miners were down quite a lot in panic dumping from Thursday’s close.
Since then miners made new highs this week and perhaps will do it again next week.
No invalidations today. Although gold did drop $10 below the cyan trend line support.
So is it time to load up now on miners while prices are cheap so can sell at a morning high next week then do it again every day or two instead of holding up and down and seeing paper profits come and go daily?
What a confusing trend this commodity is developing.
Lara is this kind of confusion is a part of Wave 3 of primary degree to create panic among the traders or you think this is a serious concern to the bull trend ?
If you look at the bollinger bands, they have been nearly sideways for 2 weeks. it may be confusing because there’s virtually been no trend for 2 weeks
It is confusing yes, and entirely normal for a correction.
There are corrections within third waves, and there are multiple structural possibilities for them.
Only possibility I can see for minuette wave (11) still being in play rather than aleternate if we hold above invalidation would be a combination consisting of a zig-zag-X-expanded flat Y with C wave of Y completing now. What do you think?
Wow. Instead of the wee drop I thought would happen, price went down to 1333.46 invalidating 1334.91 minuette 2 which most of us had assumed. It is now close to 0.886 Fib at 1333.08.
I mentioned in a comment to Dreamer that I consider the high of 1356.59 as micro 1 (because I was playing for 1513 Minor 3).
Since then, the (sleepy) consolidation followed by the (welcome) large drop constitutes micro 2. I count it as an A-B-C: 1356.59 – 1349.73 – 1354.26 – 1339.89(?).
The ending was not ideal as I have the target at 1339.54 / 1339.55 / 1339.57 at 3 different wave degrees. Maybe there is one small little drop to complete the C wave as it is hard to distinguish whether it is a 3 or a 5 even at the 1-minute level.
There is nothing bullish about this reversal…end of story.
on the 15 min chart that was a text book bull flag, that broke hard to the down side
….it was perfect….that is not a good sign
I’m guessing the alt is in play at this pt, this breakdown out of bull pennant is very bearish
Oil is spiking up today.
Oil futures aim for largest weekly gain in four months
Aug 12, 2016 12:17 p.m. ET
WTI oil tops $44, holds ground at 3-week high
http://www.marketwatch.com/story/oil-prices-extend-gains-after-saudi-hints-over-freeze-pact-2016-08-12
GDX and GDXJ is at 12:23 pm and almost at Thursday’s day low and is at today’s day low.
Gold is at 1340.59 at 12:23 pm.
Gold just dropped $10 in 30 minutes to $1,342.
Is that the bottom of a A wave of an A-B-C down from 8:46 am high of $1,356.59 or the bottom of the C wave?
Anybody have a wave count? The latest breakdown out of consolidation on the hourly has me slightly confused
Gold refuses to break through $1355 area. Lots of sellers in this area.
GDX daily is still looking good. An inverted H&S pattern may be forming with an upside target of 35.42. A resolution should be seen in the next week as GDX will either need to break upwards above resistance or breakdown below the support trend line that has held since January. My vote is for an upwards break.
Great stuff, thanks Dreamer
Hi Stephen K. It is good that you observed the continued drop; I was still sleeping after the trading session. You might have missed my post at 3:44 pm yesterday. It is reproduced verbatim below. At that point, I could clearly count only 3 waves down. The c (or y) wave needs to be a five.
“There’s still a nagging doubt in my mind.
The low of 1335.84 could still only be micro 3 of subminuette c/y.
After the rise (targeting 1340), there will still be one more drop targeting 1333 – 1335. Hope I’m wrong. (sic)”
Did the low at 8:15 pm meet your target for the final drop? (EDIT: Just saw Lara’s post below that answers my question.)
Good call Alan
Hi Lara,
Thank you for the updated analysis!
It appears that if price breaks 1340, confidence will be given to minuette ii ending at the low of 1335 – 1336 and that minuette iii is underway.
From time to time, Alan has provided us with a snapshot of expectations for price as it moves through it’s sub waves, etc… By chance, would you be able to offer some thoughts on what you’re expecting from gold in the overnight hours?
Also, it appears that you’re not in love with the alternate count. From a percentage standpoint, do you think the minuette ii is over?
Lastly, what if price does drop below the invalidation point of 1330 tomorrow after the data is released? While it can whipsaw, should we see gold drop below 1330 does this validate the alternate?
Whoa… while typing this, gold just made a new low at 1334.78 falling from 1339. I guess this begs the next question…. does this type of price activity a cause for concern? It’s recovered to 1337 but still swinging.
Your insight is very valuable and appreciated. Thank you!
IF minuette (ii) is over at the new low (and it fits as a double zigzag now) then overnight I’d be expecting upwards movement.
I’m not going to try and guess where each wave within minuette (iii) may end, Alan is welcome to try and do that and good luck to him. I fear my accuracy in any guess would be probably pretty horrible.
Price doesn’t move in straight lines though, there will be corrections along the way.
With the volume profile today looking fairly bullish no, there is not a serious cause for concern over this slight new low.
Some slight cause for concern perhaps, but not a serious cause.
As always, I could be wrong. That’s pretty much why I’ve given an alternate. If the main wave count is invalidated then expect price to continue overall lower. But today volume does not favour that scenario.
Here’s a quick update on the 15 minute chart from where Lara left off with her update. Looks to me like the bottom that Lara identified as Minuette 2 held.
We now likely have a 1st and 2nd wave up at Micro degree complete and are now in Micro 3 up. As long as the low that I have identified as Micro 2 at 1335.72 holds, then this may be the short term count.
Thank you for your insight Dreamer
Yes, I do have the same count except that instead of micro level, I place the price movement at submicro level (sm1 1341.36, sm2 1335.50) — a bit ambitious, as this would nicely lead to 1513 being the Minor 3 target.