Downwards movement unfolded exactly as expected.
Summary: Price should move a little lower to complete a five wave impulse. The short term target is at 1,315. If price breaks below 1,310, then a target for downwards movement to end is at 1,279. The longer term trend is still upwards. Corrections are an opportunity to join the trend.
New updates to this analysis are in bold.
Last weekly charts, and a more bearish weekly alternate, are here.
Grand SuperCycle analysis is here.
DAILY ELLIOTT WAVE COUNT
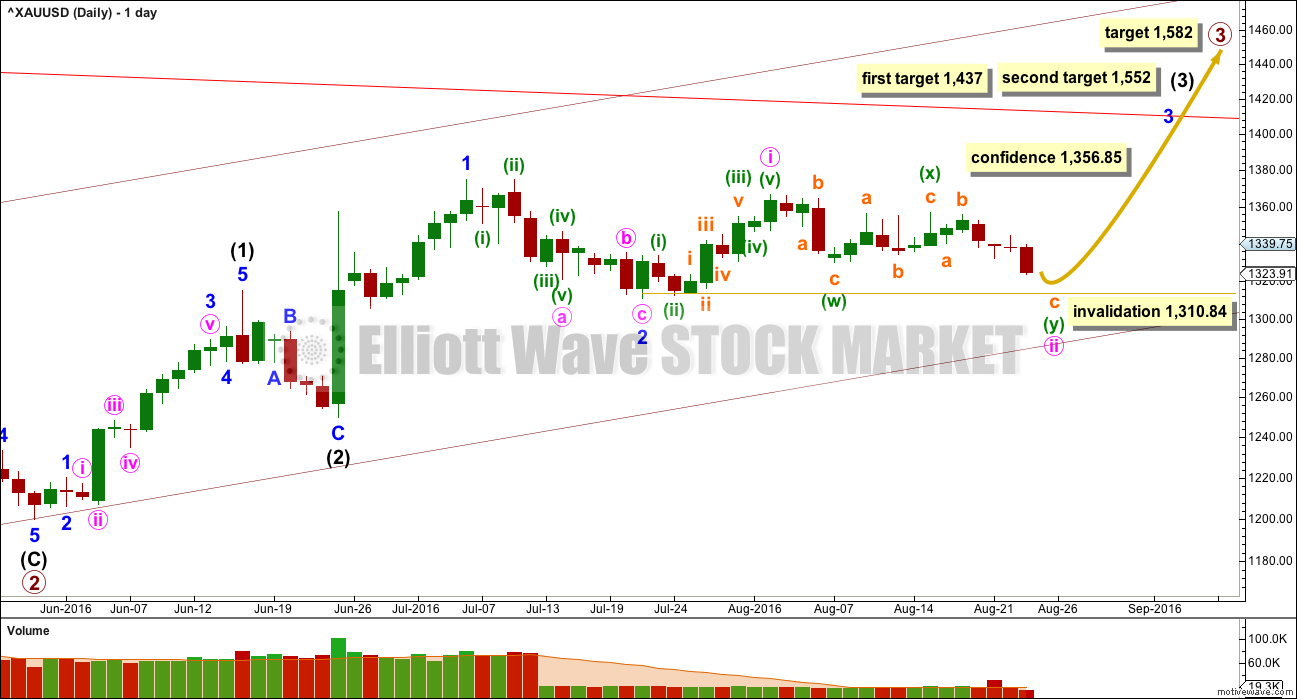
Primary wave 2 is a complete expanded flat correction. Price from the low labelled primary wave 2 has now moved too far upwards to be reasonably considered a continuation of primary wave 2. Primary wave 3 is very likely to have begun and would reach 1.618 the length of primary wave 1 at 1,582.
Primary wave 3 may only subdivide as an impulse.
So far intermediate waves (1) and (2) may be complete within primary wave 3. The middle of primary wave 3 may have begun and may also only subdivide as an impulse.
Within intermediate wave (3), the end of minor wave 1 is moved up to the last high. This fits on the hourly chart although it looks odd here on the daily chart. There was a small fourth wave correction up at the end of minor wave 1 and it subdivides on the hourly chart as an impulse. Minor wave 2 may be a complete zigzag, also subdividing as a zigzag on the hourly chart. If minor wave 2 is over, it would be 0.50 the depth of minor wave 1.
Minute wave ii is incomplete. It may be subdividing either as a double combination or double zigzag. Within the second structure in the double, labelled minuette wave (y), the structure is incomplete.
Minute wave ii may not move beyond the start of minute wave i below 1,310.84. This is the final risk to any long positions entered here or which members may still be holding. At this stage, I have chosen to close long positions, taking a little profit. I will wait for minute wave ii to be over before entering again.
At 1,437 intermediate wave (3) would reach 1.618 the length of intermediate wave (1). If price keeps going upwards through this first target, or if it gets there and the structure is incomplete, then the next target would be at 1,552 where intermediate wave (3) would reach 2.618 the length of intermediate wave (1).
A new high above 1,356.85 would invalidate the alternate wave count below and provide price confirmation of this main wave count.
Primary wave 1 lasted 14 weeks and primary wave 2 lasted 12 weeks. Primary wave 3 should be longer in both price and time as it should be extended. It may be about a Fibonacci 34 weeks. So far it has lasted eleven.
HOURLY ELLIOTT WAVE COUNT
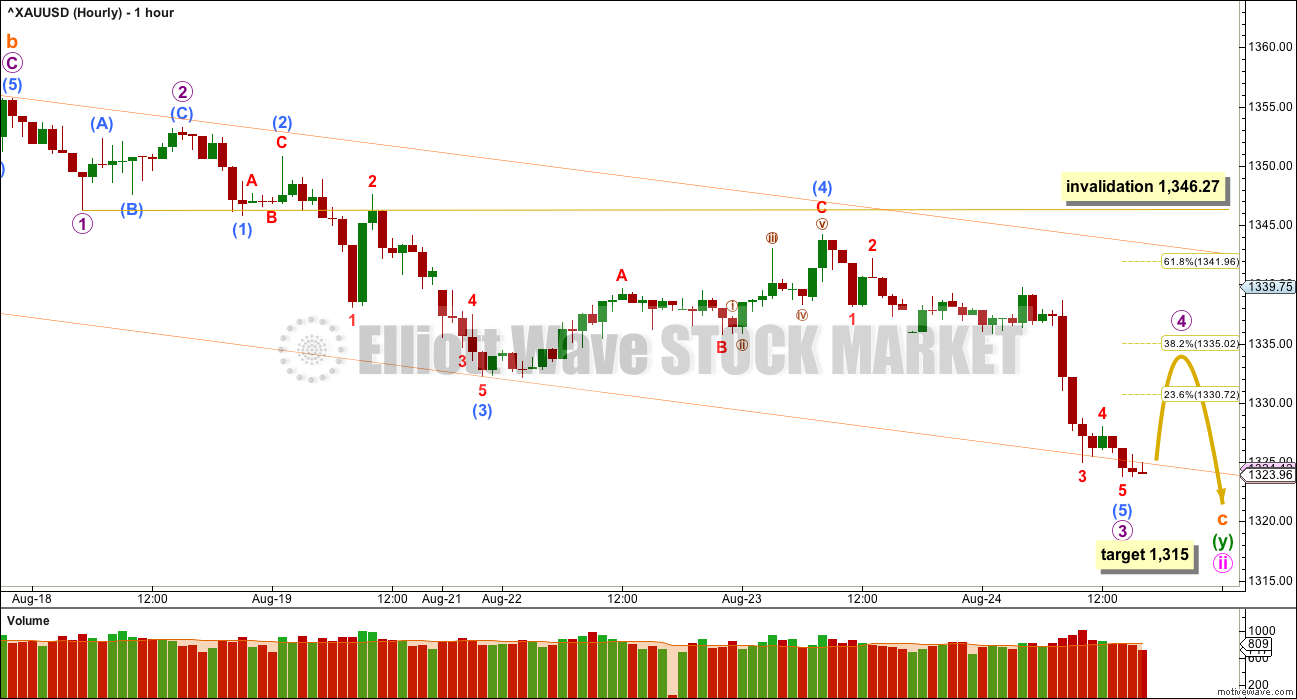
Minute wave ii fits as either a double combination or a double zigzag. The first structure in the double (seen on the daily chart) fits as a zigzag labelled minuette wave (w). The double is joined by a three in the opposite direction labelled minuette wave (x), which fits perfectly as a zigzag.
The second structure in this double may be either a zigzag or a flat correction. At 1,315 subminuette wave c would reach 2.618 the length of subminuette wave a. Subminuette wave c must subdivide as a five wave structure. It is not a diagonal. It is unfolding as a more common impulse. Within subminuette wave c, the structure looks to be incomplete.
Micro wave 3 may be over within subminuette wave c. Micro wave 4 may be relatively brief and shallow, or it may take up time and move sideways. It is impossible at this stage to tell which structure it will take and exactly how long it will last, only to say that it may not move into micro wave 1 price territory above 1,346.27.
When micro wave 4 is over, then more downwards movement for micro wave 5 would still be required to complete the structure.
The whole structure for minute wave ii may possibly end within the next 24 hours. With this wave count expecting the next move upwards to be the start of the middle of a big third wave, look out for surprises now to the upside.
If this wave count is invalidated short term with a new high above 1,346.27, then my labelling of subminuette wave c as incomplete would be wrong. Invalidation of this hourly wave count by upwards movement would indicate that minute wave ii is over and a third wave up should then be underway.
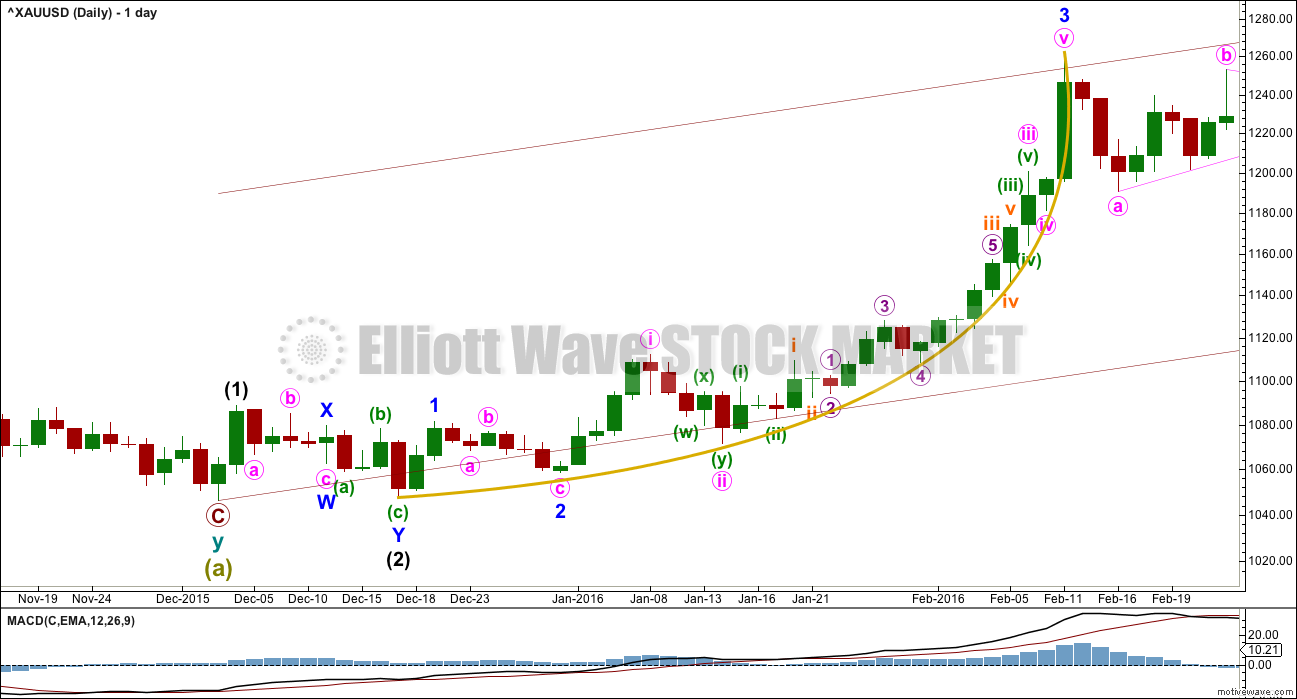
THIRD WAVE EXAMPLE – DAILY CHART
In discussing the curved look to Gold’s impulses, particularly for its third waves, here is an example.
Within primary wave 1, the third wave of minor wave 3 had a strong curved look to it. The impulse begins more slowly and has deep and relatively time consuming second wave corrections: Minor wave 2 was 0.68 of minor wave 1, minute wave ii was 0.76 of minute wave i, minuette wave (ii) was 0.56 of minuette wave (i), and subminuette wave ii was 0.64 of subminuette wave i.
The curved look comes from the disproportion between second and fourth wave corrections within the impulse. Here, minute wave ii lasted 4 days and shows clearly on the daily chart yet minute wave iv was over within one day and does not show up with any red candlesticks or doji on the daily chart.
Momentum builds towards the middle of the impulse, continuing to build further during the fifth wave and ending in a blowoff top. This is typical of Gold and all commodities.
This tendency to blowoff tops and curved impulses is particularly prevalent for Gold’s third waves.
Notice also how this third wave began with a series of overlapping first and second waves. When third waves extend, which is very common, this is very often how they begin. When that happens, they convince us the market will not move strongly and the wave count must be wrong, and they do that right before the trend moves clearly with increasing momentum and volume.
ALTERNATE DAILY ELLIOTT WAVE COUNT
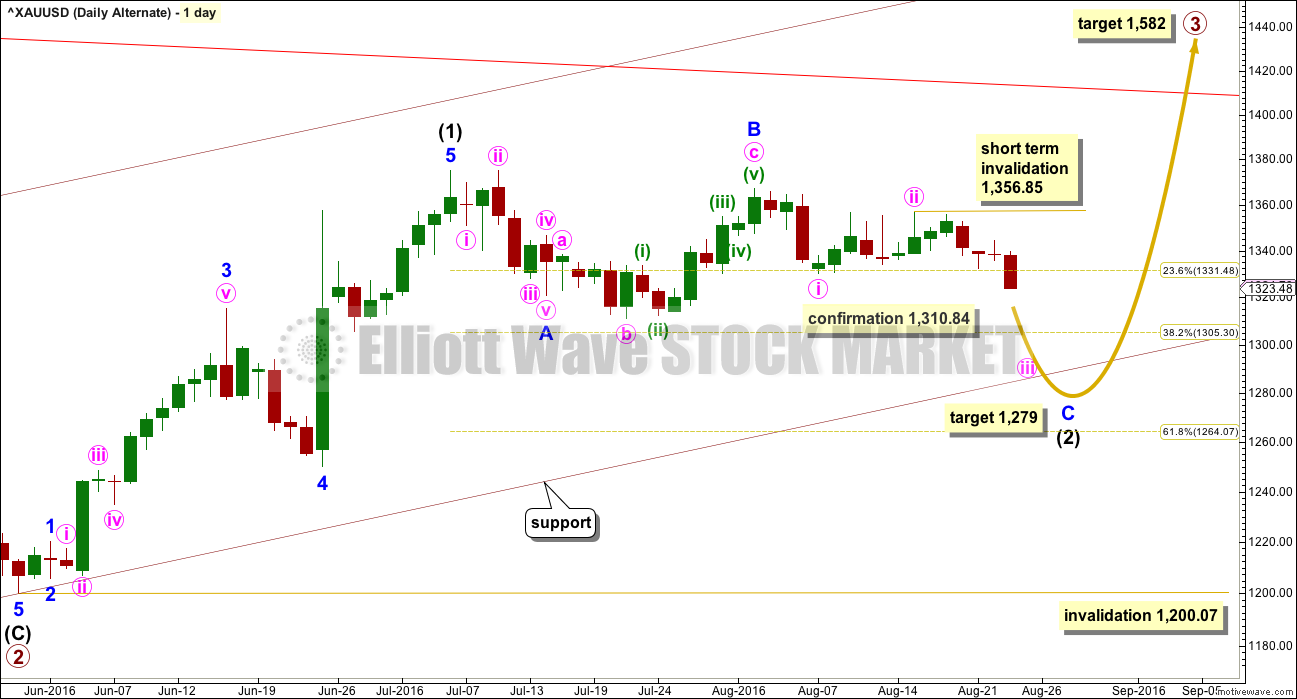
This wave count is identical to the main wave count up to the end of primary wave 2. Thereafter, what if only intermediate wave (1) ended at the last high?
This movement will fit as a five wave impulse, although it does not have a very good look on the daily chart. This reduces the probability of this wave count.
If intermediate wave (1) was over at the last high, then it may have lasted 27 days. So far intermediate wave (2) may have taken 35 days and would still be incomplete.
Within minute wave iii, no second wave correction may move beyond the start of its first wave above 1,356.85.
At 1,279 minor wave C would reach 1.618 the length of minor wave A. Price may end downwards movement when it finds support at the lower edge of the maroon base channel drawn about primary waves 1 and 2.
Intermediate wave (2) may not move beyond the start of intermediate wave (1) below 1,200.07.
ALTERNATE HOURLY ELLIOTT WAVE COUNT
In order to make a reasonable judgement of each Elliott wave count, it is important to see how each wave count sees recent structure at the hourly chart level.
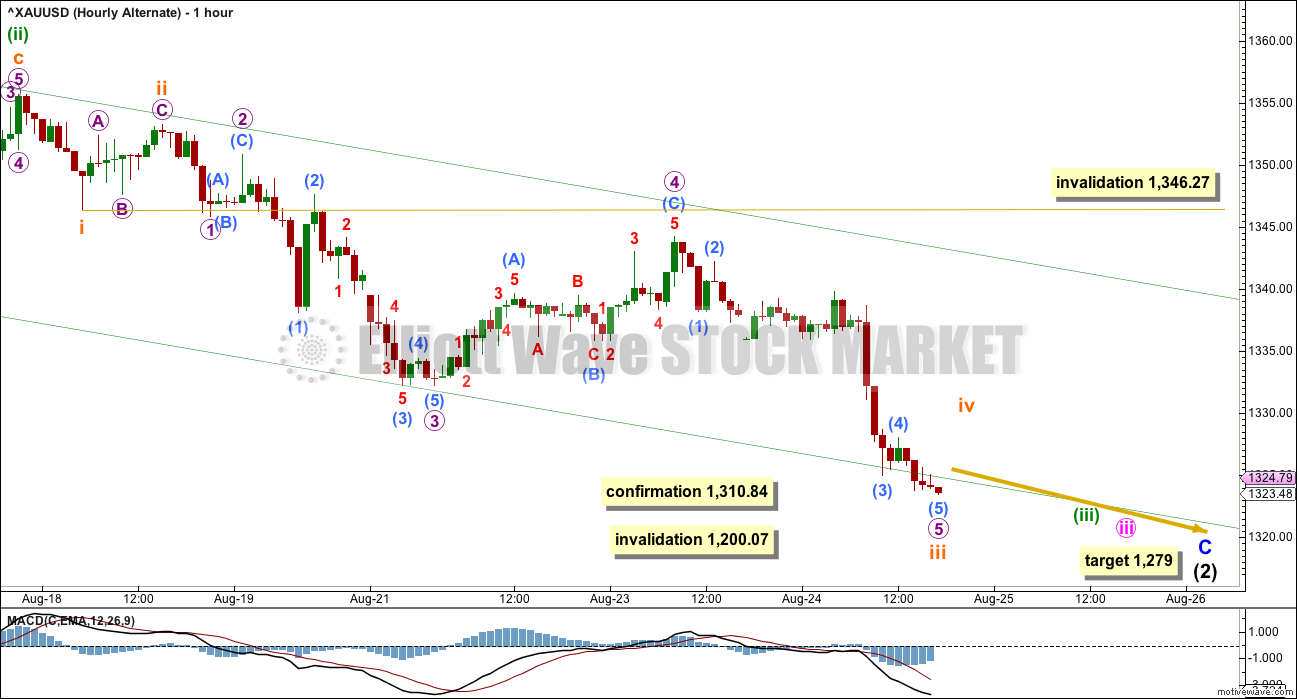
Within minuette wave (iii), the structure looks to be incomplete. This part of downwards movement is essentially seen in the same way for both wave counts, only the degree of labelling differs. Both see an impulse unfolding lower.
Minor wave C must subdivide as a five wave structure. This alternate wave count would be confirmed with a new low below 1,310.84.
Minor wave C still needs more downwards movement. Along the way down, three (or possibly only two) more fourth wave corrections should complete and be followed by fifth waves downwards towards the target.
If price moves below 1,310.84, then expect more downwards movement for a deeper pullback to end about 1,279. Look also for price to find support at the maroon channel on the daily chart. The target at 1,279 may be a little too low; the maroon trend line may stop price before it reaches the target.
TECHNICAL ANALYSIS
WEEKLY CHART
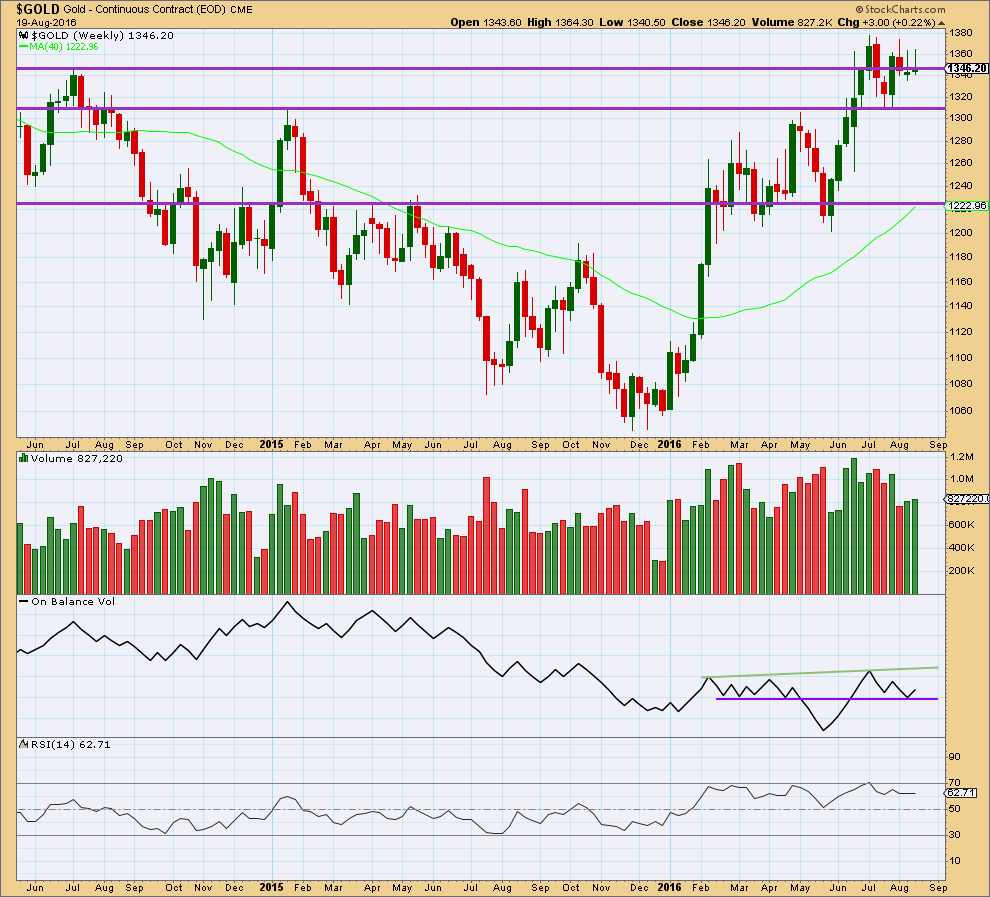
Two green weekly candlesticks in a row come now with a small rise in volume. Volume for both weeks is stronger than the prior downwards week. Short term, at the weekly chart level, the volume profile looks bullish.
Last week completes a weekly candlestick with a higher high and a higher low than the week before. Overall, price has moved upwards last week.
It is concerning for the main wave count that both of these last two weeks have long upper wicks on the candlesticks. These wicks are bearish and indicate caution. For this reason please manage risk carefully. The alternate wave count is possible and illustrates the risk currently to long positions.
On Balance Volume last week has moved up from the lower purple trend line. This is a reasonable bullish signal week.
RSI is still not extreme. There is room for price to rise.
DAILY CHART
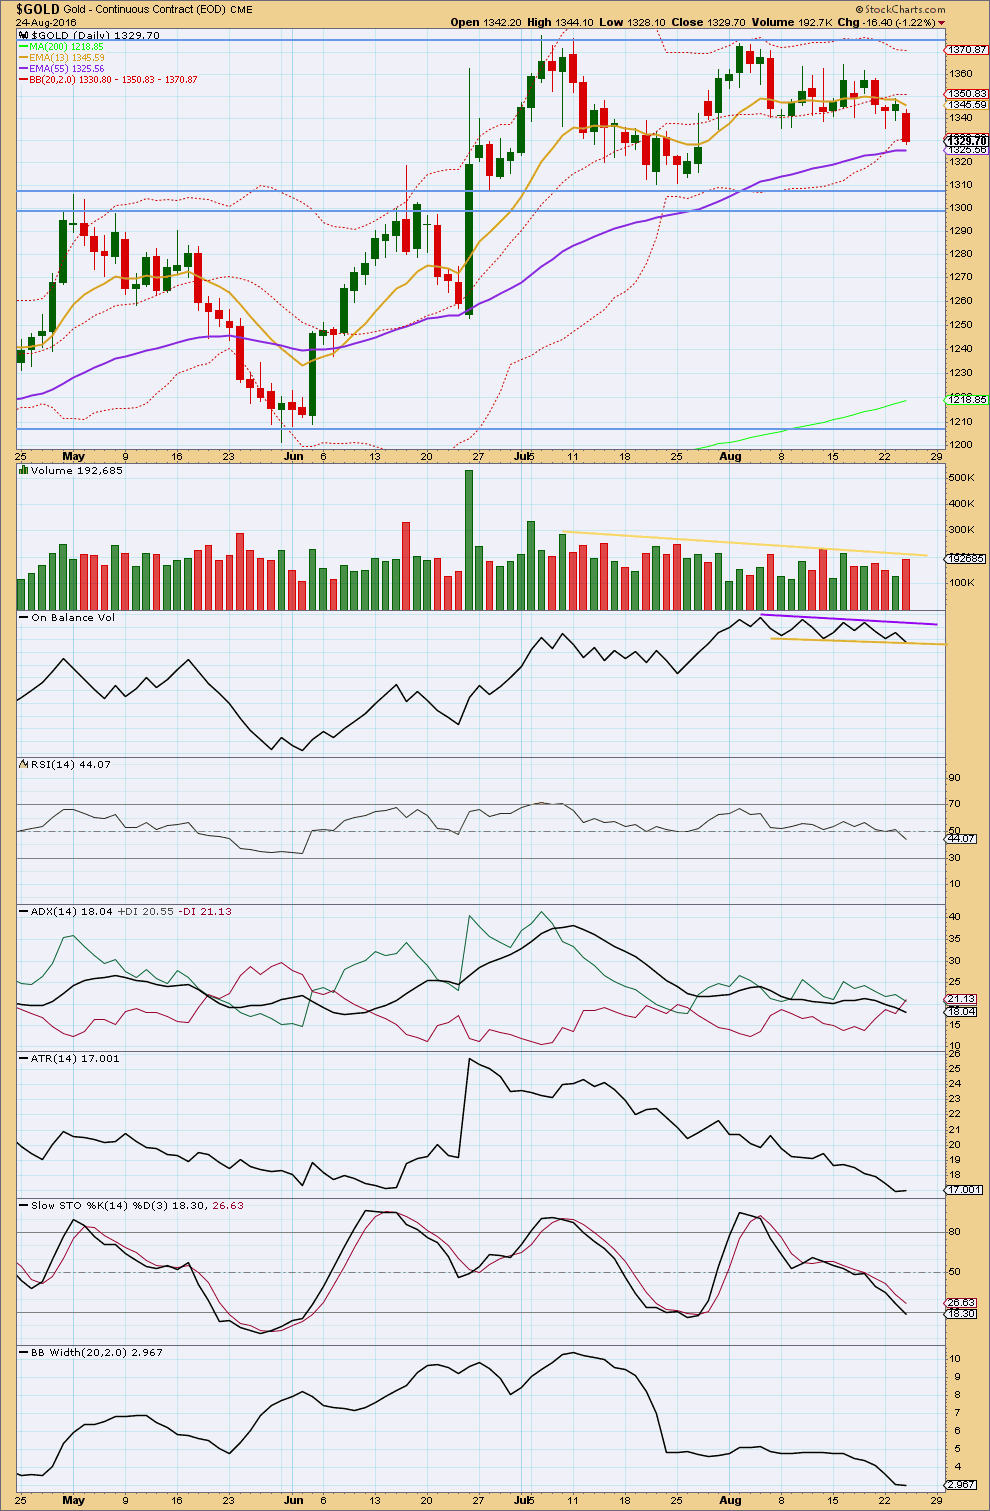
Downwards movement today may find some support about the 55 day moving average. An increase in volume for a downwards day with an increased range sees downwards movement supported by volume. This suggests that downwards movement is not complete yet.
Overall, price is still range bound with resistance about 1,375 and support about 1,310 – 1,305. Volume is still overall declining as price is still moving within this range. The strongest day within this period, which began back on 7th of July, is the upwards day of 8th of July. This suggests that eventually an upwards breakout may be more likely than a downwards breakout.
ADX is declining, indicating the market is not trending. Stochastics is now nearing oversold and price is nearing support. A little more downwards movement overall to about 1,310 – 1,305 may be expected until Stochastics reaches oversold.
ATR is still overall declining and Bollinger Bands are still tightly contracted. This market is not trending, yet.
This analysis is published @ 06:26 p.m. EST.

Thanks Lara for the timely GDX update. Now I know it’s also very bearish from the EW perspective.
Friday 10:00 am EST Janet Yellen FED Speech at Jackson Hole Economic Symposium
http://www.marketwatch.com/story/inside-the-feds-jackson-hole-retreat-2016-08-25
At 10 a.m. Eastern, the conference will begin with the eagerly anticipated speech from Fed Chairwoman Janet Yellen. Kansas City Fed’s George said this morning that even other Fed official’s don’t know in advance what she will say.
Some 100 economists and Fed officials — each one able to fill a room if they gave a speech in New York or Washington — attend the two-day event.
The topic of the meeting this year is “designing resilient monetary policy frameworks for the future.” “Going back to the pre-crisis framework may not be possible”.
NUGT dropped from $106 last night down to $20 this morning.
Freaked me out than figured it was 1 for 5 share swap.
Update on main hourly.
The structure of subminuette c may now be complete. There is almost no room for movement.
This is how we can manage our trades at this time with these two wave counts.
If price moves below 1,310.84 then we should be short. If price moves above 1,341.45 then we should be long. A hedge or straddle right now would cover both bases.
At the weekly chart level we don’t yet have a new swing low below 1,310.84. If we get that then at the weekly level there would be a lower high and a lower low, a trend change from up to down would increase in probability. So we’d want to be short in that case.
Alternate updated.
Here the structure of minor C is incomplete. Minuette (iv) may not move into minuette (i) price territory above 1,341.45.
That is why a new high above 1,341.45 now would add confidence to the main wave count.
A new low below 1,310.84 would invalidate the main and confirm the alternate.
Some EW theoreticians go to a lot of trouble to explain why EWT is completely divorced from the news cycle. Prechter in particular can be almost combative about this point.
I have always been somewhat bemused by the arguments for and against as it has always seemed to me to be distinction as it were, without a real difference. The whole idea of EWT is that it is a principle of human behaviour. To argue that the waves are in no way influenced by news, is the same as saying that human behaviour is not affected by news, and this most would agree is a false assertion. I bring this up because of the current decline in the gold and gold miner price. I doubt that there is anyone who believes the empty threats of the FED mouthpieces had nothing to do with the slide. I think the trick for us as traders is trying to discern if human behaviour is affecting price in a way that is sustainable or not; in EW parlance, whether it is producing a corrective or a motive wave. That seems to me to be the real question, and not whether the news cycle plays a part. Any thoughts?! 🙂
I don’t think that news causes markets to move in one direction or another, and most news is factored into price before it’s release.
I think that volatility spikes during and just after important news releases, but that price will move in the direction it was going to move in according to the wave count. Invalidation points would be respected, if the wave count is correct.
September 11, 2001 a good example. The market had already peaked in March 2000 and been trending overall down ever since. After Sept 11 price moved strongly lower, and moved a fifth wave of a leading diagonal below the end of the third wave, meeting the EW rule. So if one had the correct wave count up to that point the movement would have been exactly as expected.
There’s also the Twitter study which showed market movements follow social mood for short term moves by about three days. Overall positive mood = price goes up about three days later, overall negative mood = price goes down about three days later.
I think the distinction can be important. It means you don’t have to read or watch what the media present to us as news. It can be ignored and traders can focus on charts and technicals, and make money.
My 2 cents worth anyway.
But then, you’d expect me to have this view wouldn’t you. As I’m an Elliotician and all 🙂
Indeed! 🙂
I watch a few of the very big US news events as they may clarify an EW move that was probability wise going to happen anyways just not sure when. The market may think the movement is due to the news however it is due to the sentiment and EW count position at the time of the news.
I could also ignore the news and then may miss out on the trading opportunity at that time as I day trade instead of holding for a long time.
Of course if I was holding for a long term target I could just ignore all the news.
As Lara mentions, I also have the EW charts with the pertinent important price points in front of me to help in the trade.
At 11:13 am gold 1, 5, 15, and 1 hour gold price hit the upper resistance trend lines on http://www.pmbull.com
Triple-Digit Upside for Direxion Shares Exchange Traded Fund Trust? JNUG
By Robert Appel, B.A., B.C.L., L.L.B
Published: August 23, 2016
http://www.profitconfidential.com/stock/triple-digit-upside-for-direxion-shares-exchange-traded-fund-trust/
Interesting article. The price supression by the central banks is very well documented. The size of some of the naked shorts is indeed astounding and makes it clear these are some very heavy hitters. I am not sure how this ultimately affects the wave development but I think the buying will continue. I continue to add to my positions as I personally find the supposed basis for the decline – imminent rate hikes thoroughly laughable. There are some miners I want to hold for the intermediate term so I imagine I should thank the banksters for the cheaper entry. There is not an informed trader alive who thinks we have seen a top in Gold. This is not the way they end- not by a long shot! The banksters must be getting very nervous about that 1350.00 pivot. 🙂
Hi..
Todays low is very near to the main count target,was that the micro5. I found difficulty in seeing micro4.
Any help by alan or dreamer
I see micro 3 completed at 1323.40 at 8:00 pm ET last night. Micro 4 completed at 1326.80 at 3:00 am.
I have two versions of the price movement from there:
(1) Submicro 3 of micro 5 completed at 1318.20 at 7:30 am. Submicro 4 is a deep retrace and may not be over yet. This count requires one drop to complete Minute 2. Confirmation of this count is a subsequent drop below 1318.20.
(2) The other possibility is that Minute 2 was over at 1318.20. In this case, submicro 5 was an extended wave as it is longer in duration than submicro 3. I will have confidence in this count when price moves above micro 4, 1326.80. But then, there is still the possibility that micro 4 is an expanded flat.
On balance, I favour the second count due to circumstantial evidence from NUGT. It rises much faster in proportion than gold price, a reversal in the tendency of the past few days.
Note: I am now using data from BarChart to mesh with Lara’s wave count.
Thank u
What is expected bottom of GDX move on this downturn before next leg up?
I will be analysing GDX later today.
I have some weird feeling about this rally as well as Fed. decision. I have growing feeling we are not going to have any rally in September. It will be side trading and barely up moves like 1340 -50 max. Wave 3 as we were waiting is not going to happened for a while ,plus mid of September I think we will whitness more down turn to 1200. Economic Data well comuflaged before elections and max limited for negative way. Democrats has to show good picture because they need to stay in a White House.
This is a technical analysis website. Analysis based on a “weird feeling” is not technical analysis.
I do not see any technical analysis in this comment.
His personal gut ‘sentiment indicator’ is that the overall gold sentiment of the market is turning more bearish and may do so even more in September?
I guess the comment could be read that way.
A contrarian would read it as bullish.
Gold Price Forecast: Watch for a September Rally
http://news.gold-eagle.com/article/gold-price-forecast-watch-september-rally/360
Fullgoldcrown shows a possible halfway consolidation in miners which would match up well with my second suggested count below
https://goldtadise.com/?p=379478
This idea likely does not match up well with either of Lara’s gold counts though as they are much more bullish. The miners and gold are giving different signals at this point. Hopefully we can get this figured out soon.
It might be less relevant, but there’s something change. Here is from the original post—>”Because of the differing vols, $GDXGLD is positively correlated to the price of gold. The trend has now broken.”
Dreamer, thanks so much for the GDX update!! Now, I’m waiting to hear Lara’s insight on the EW count. Thanks again!
Lara, this is the next one that I’m considering. With the strong breach of the main channel, this one seems like it might be more probable at this point, but it does not align very well with your more bullish count for gold. This one obviously suggests that we are in a larger correction that may be ” the halfway point” of the bull move up.
Your thoughts are appreciated or if you could do a GDX update that would be great also. Thanks in advance!
Yes, that looks good.
Yes, I will update GDX tomorrow.
Great. Thank you! ?
Lara, I would appreciate your input on GDX. There appears to be several options at this point. I’ve identified 2 that I think are possible. There are likely others.
This is the first one and still the most bullish. I’m not confident with it though as the size of Minor 2 seems out of proportion for the right look.
I don’t like the proportions in this one, minor 2 looks too big.
But then it’s possible. GDX doesn’t have sufficient volume for always normal looking EW counts.
Try seeing primary 3 over at the last high. Will that fit?
Sure it’s a possibility, but it will invalidate at 26.17, so the drop needs to stop quickly. That would of course limit the length of Primary 5, since P3 would be shorter than P1, and that would work out better with your gold count. GDX Cycle wave a would then end likely during one of gold’s large 4th wave corrections which would be much closer to golds cycle wave a endpoint. Definitely worth considering. Thanks
It looks like it may have stopped at 26.75. What would that new count give us for a Primary 5 target?
Matthew, P5 would need to be less than P3 in length, which is 9.85. I think it’s too early to call a bottom, but if the low today was the bottom, then with this count, P5 would need to end at 36.5 or below. Hope this helps.
Well, GDX had an ugly day today. One of the biggest drops of the year on high volume. It gapped down below the 50 MA and neckline extension rail support.
This proves that the channel break from a few days ago was very significant.
OBV continued lower today, but may be at a place to find some support
Stochastics is oversold, but may stay that way. Need to see it move back above 20
RSI is close to oversold
Previous high volume down days show that GDX may get a small bounce, but will likely move lower before a more sustainable move up develops that should at minimum test the neckline extension rail which has now turned into resistance.