Both Elliott wave counts from last analysis remain valid.
Summary: Some more downwards movement next week looks most likely, to about 1,279. If this target is wrong, it may be a little too high.
New updates to this analysis are in bold.
Last weekly charts, and a more bearish weekly alternate, are here.
Grand SuperCycle analysis is here.
WEEKLY ELLIOTT WAVE COUNT
This will be the new main wave count.
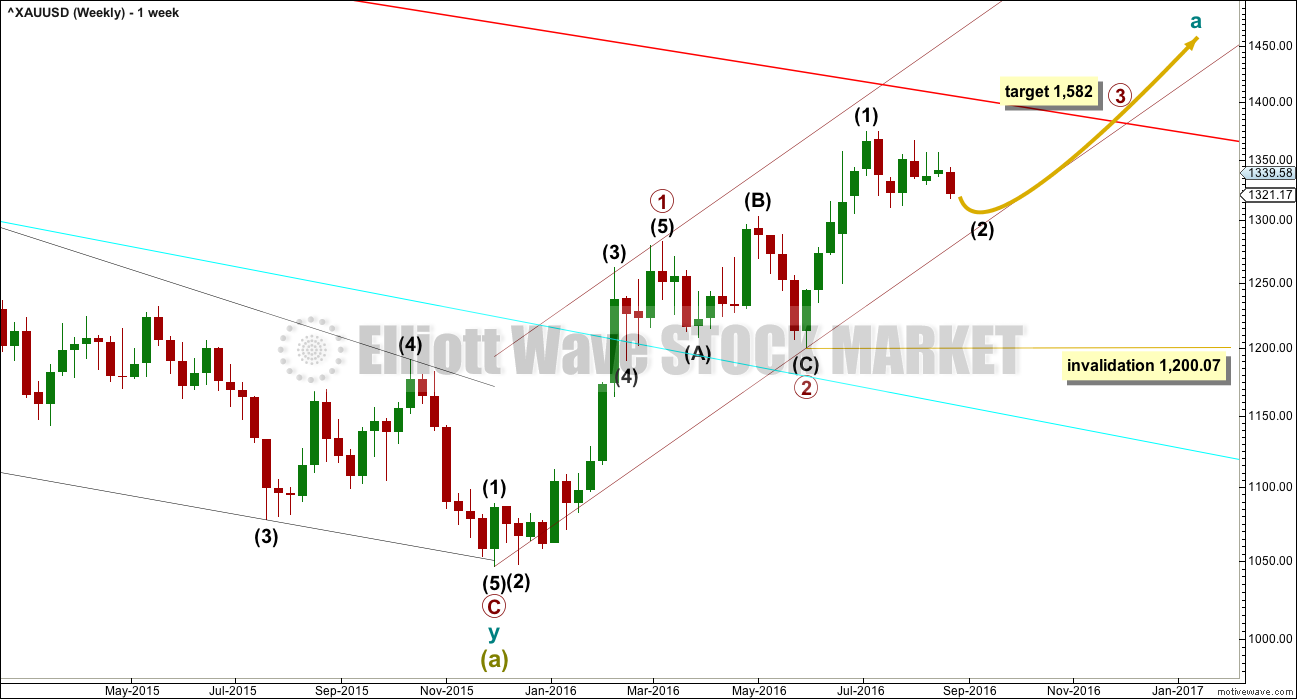
Within the new upward trend for Super Cycle wave (b), cycle wave a is most likely unfolding as a five wave impulse.
Within cycle wave a, so far primary waves 1 and 2 are complete. Thereafter, this wave count differs from the two alternates.
This main wave count will expect primary wave 3 to be longer than primary wave 1. Because this is very common, this is the main wave count and it expects the most common scenario is most likely. At 1,582 primary wave 3 would reach 1.618 the length of primary wave 1.
Only intermediate wave (1) so far is complete within primary wave 3. Intermediate wave (2) may be close to completion. It may find support at the lower edge of the base channel drawn about primary waves 1 and 2. Intermediate wave (2) may not move beyond the start of intermediate wave (1) below 1,200.07.
DAILY ELLIOTT WAVE COUNT
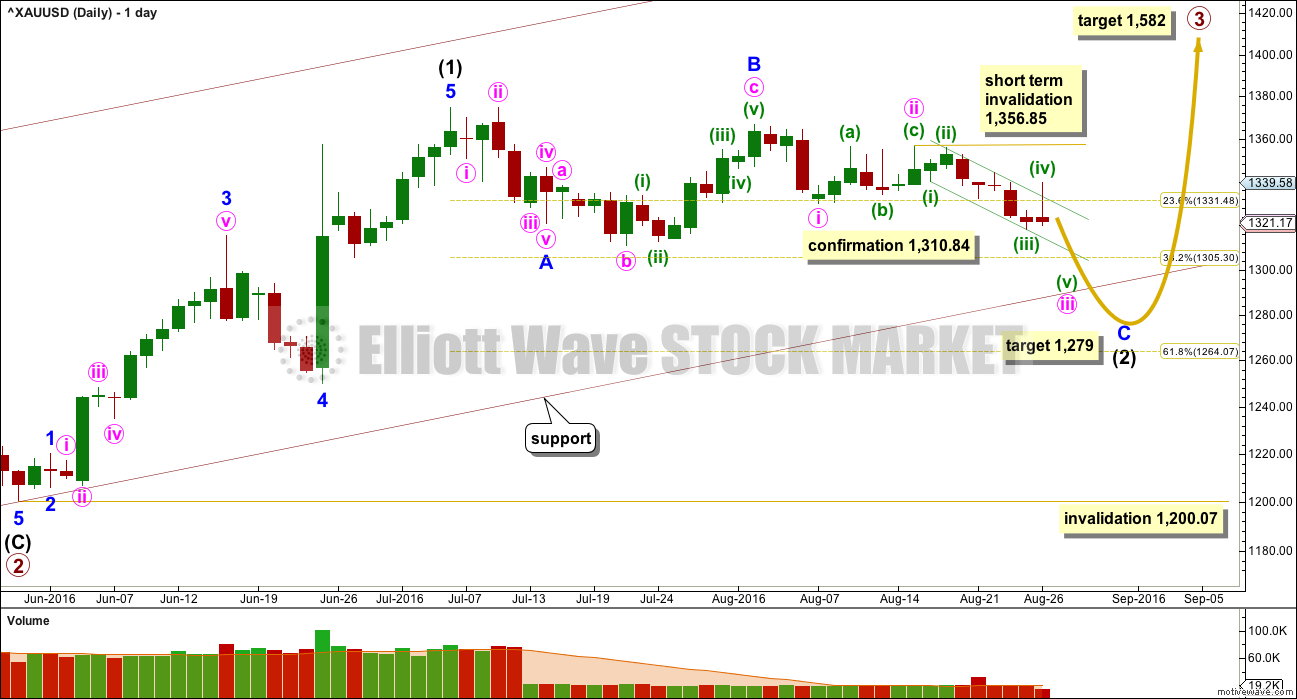
Primary wave 3 may only subdivide as an impulse.
If intermediate wave (1) was over at the last high, then it may have lasted 27 days. So far intermediate wave (2) may have taken 37 days and would still be incomplete.
Within minute wave iii, no second wave correction may move beyond the start of its first wave above 1,356.85.
At 1,279 minor wave C would reach 1.618 the length of minor wave A. Price may end downwards movement when it finds support at the lower edge of the maroon base channel drawn about primary waves 1 and 2.
Intermediate wave (2) may not move beyond the start of intermediate wave (1) below 1,200.07.
Primary wave 2 lasted 56 days (one more than a Fibonacci 55). So far intermediate wave (2) is more brief in duration. It has lasted 37 days and may be just a few days away from completion.
Draw a small channel about minute wave iii, using Elliott’s technique, and copy it over to the hourly chart.
HOURLY ELLIOTT WAVE COUNT
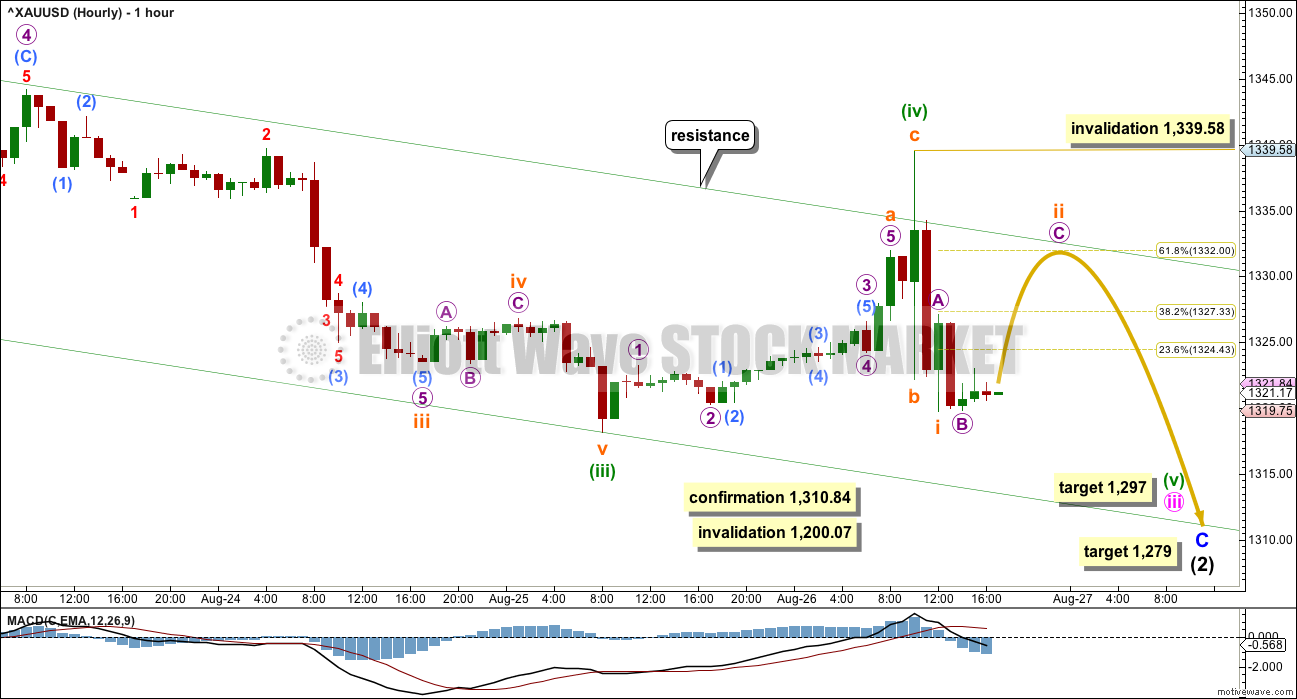
Within minuette wave (iii), the structure looks to be incomplete. This part of downwards movement is essentially seen in the same way for both wave counts, only the degree of labelling differs. Both see an impulse unfolding lower.
Minor wave C must subdivide as a five wave structure. This wave count would be confirmed with a new low below 1,310.84.
Minor wave C still needs more downwards movement. Along the way down two more fourth wave corrections should complete and be followed by fifth waves downwards towards the target.
Minuette wave (iv) was a deep zigzag exhibiting alternation with minuette wave (ii) in structure but not depth.
Minuette wave (iii) was 2.83 short of 2.618 the length of minuette wave (i). Minuette wave (v) may not exhibit a Fibonacci ratio to either of minuette waves (i) or (iii).
At 1,297 minute wave iii would reach 1.618 the length of minute wave i.
Minuette wave (iv) overshoots the upper edge of the Elliott channel, and then price quickly returns to within the channel. Along the way down, corrections should find resistance at the upper edge of the channel and downwards movement may find support at the lower edge. If price breaks below the lower edge, then look out for a strong fifth wave downwards.
If price moves below 1,310.84, then expect more downwards movement for a deeper pullback to end about 1,279. Look also for price to find support at the maroon channel on the daily chart. The target at 1,279 may be a little too low; the maroon trend line may stop price before it reaches the target.
ALTERNATE DAILY ELLIOTT WAVE COUNT
This was previously the main wave count.
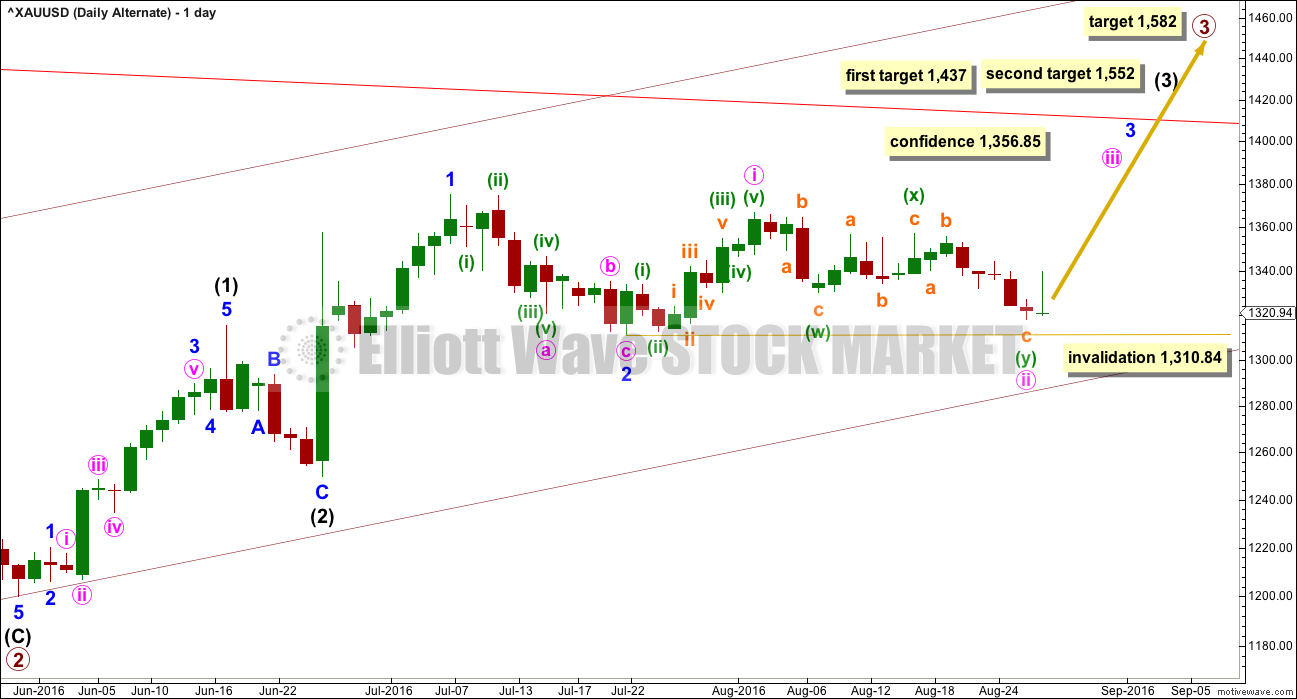
The duration of minute wave ii now gives this wave count the wrong look. Lower degree second waves should be more brief in duration than second waves of a higher degree. Here, minute wave ii has lasted 17 days, minor wave 2 lasted 11 days, and intermediate wave (2) lasted 6 days.
At 1,437 intermediate wave (3) would reach equality in length with intermediate wave (1). At 1,552 intermediate wave (3) would reach 1.618 the length of intermediate wave (1).
Minute wave ii may not move beyond the start of minute wave i below 1,310.84.
ALTERNATE HOURLY ELLIOTT WAVE COUNT
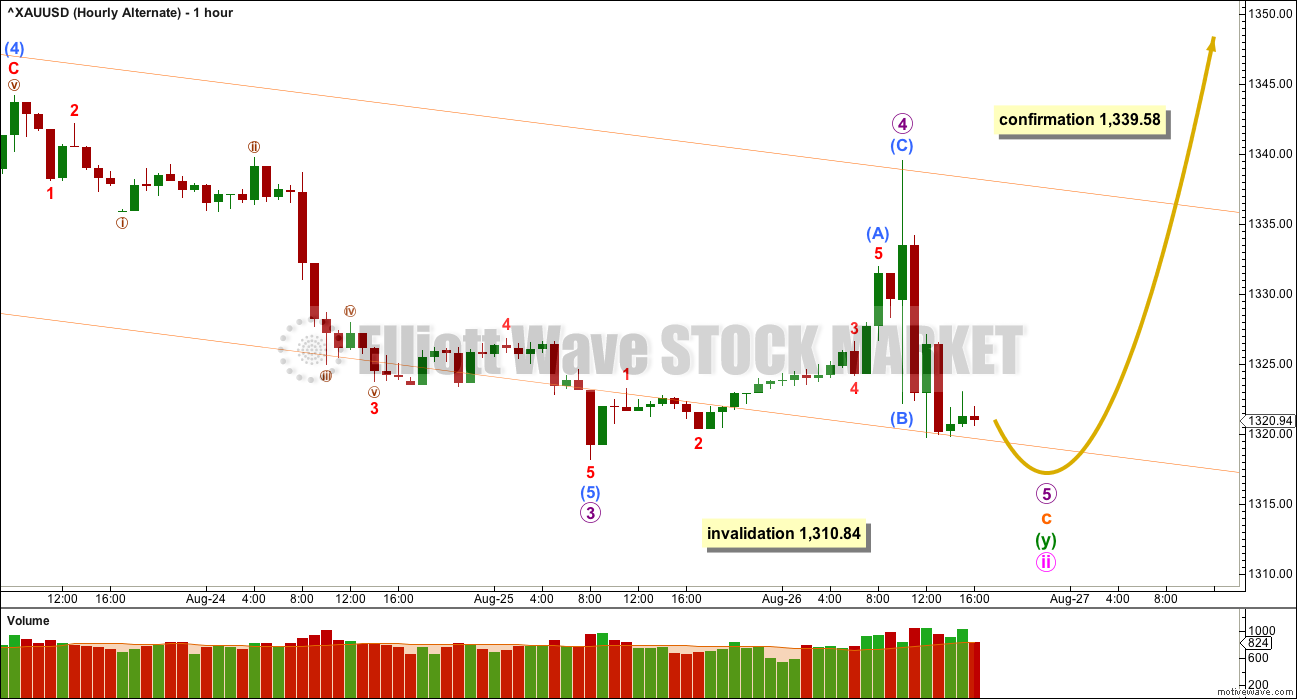
A final fifth wave down would still be required for this alternate wave count. Upwards movement for Friday’s session will not subdivide as a five; it fits only as a three because of the deep spike labelled sub micro wave (B).
Friday’s session would have to be another fourth wave correction for this alternate.
After a slight new low, then this alternate wave count would expect upwards movement.
A new high above 1,339.48 is required for confidence in this wave count. At that stage, a third wave up at four degrees should be expected to be in the very early stages.
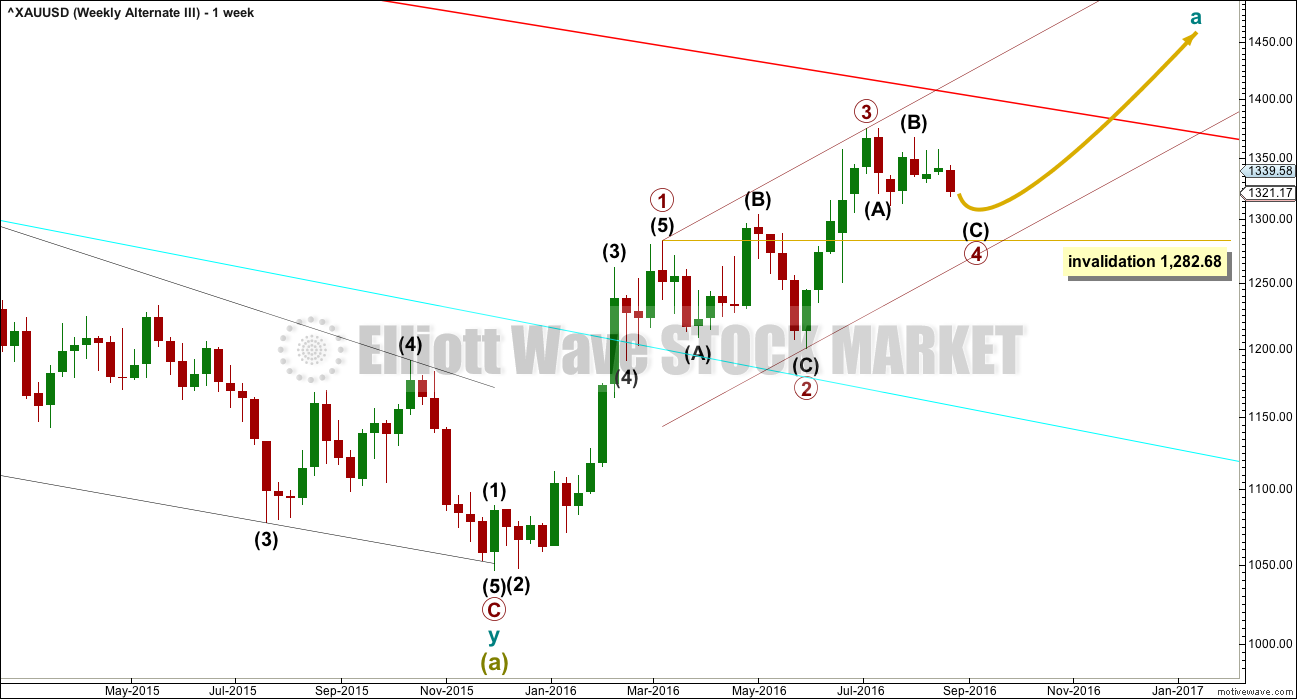
ALTERNATE III WEEKLY ELLIOTT WAVE COUNT
It is possible that primary wave 3 is over and shorter than primary wave 1. Primary wave 3 shows stronger momentum and volume than primary wave 1 (see technical analysis weekly chart).
If primary wave 3 is over, then the current consolidation for Gold would be primary wave 4.
Primary wave 2 was a relatively shallow 0.35 expanded flat correction. Primary wave 4 may be unfolding as a deeper zigzag which would exhibit perfect alternation.
Primary wave 4 may not move into primary wave 1 price territory below 1,282.68.
Primary wave 5 would be limited to no longer than equality in length with primary wave 3, so that the core Elliott wave rule stating a third wave may not be the shortest is met. Primary wave 5 would have a limit of 174.84.
ALTERNATE III DAILY ELLIOTT WAVE COUNT
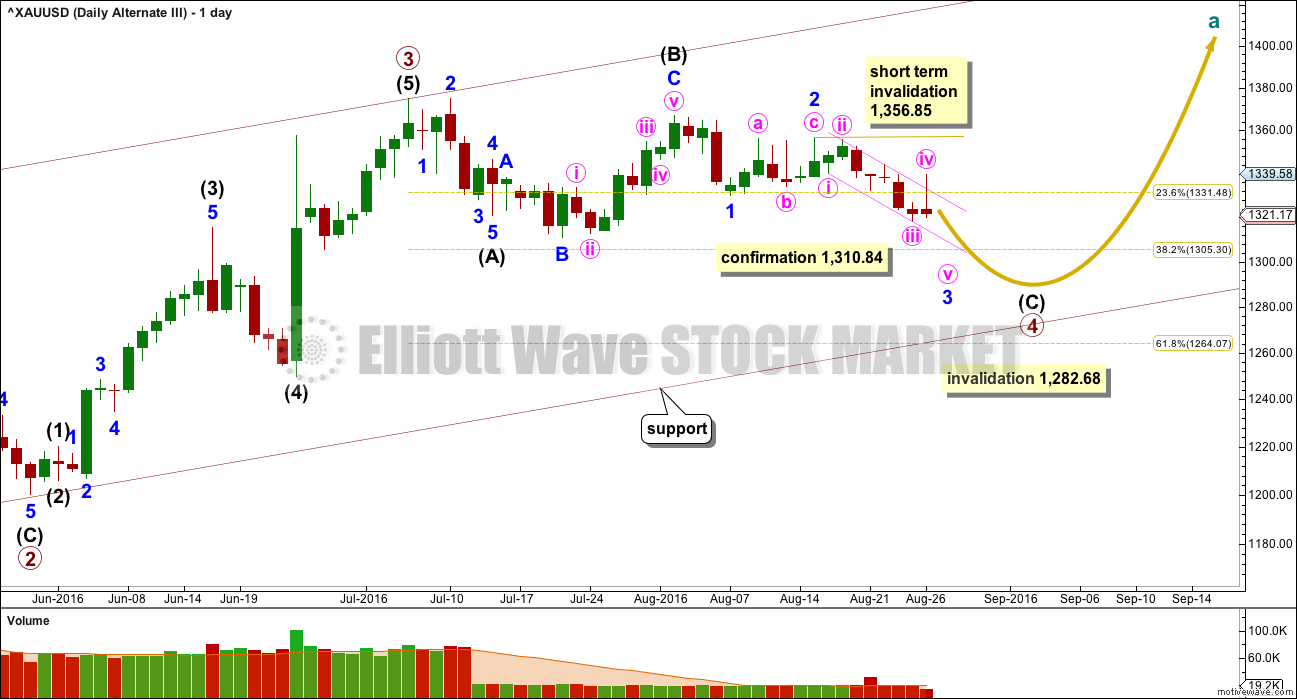
The target at 1,279 is invalid for this wave count. This wave count expects more downwards movement to complete a five wave impulse for intermediate wave (C) in the same way as the main wave count expects a five wave impulse down to complete minor wave C. Only the degree of labelling differs; this wave count is one degree higher.
The hourly chart would be exactly the same except for the degree of labelling.
It is also possible that primary wave 4 may be a regular contracting triangle. If sideways movement continues in an ever decreasing range, then that idea would be published. At this stage, a zigzag looks more likely because the subdivisions have a slightly better fit.
TECHNICAL ANALYSIS
WEEKLY CHART
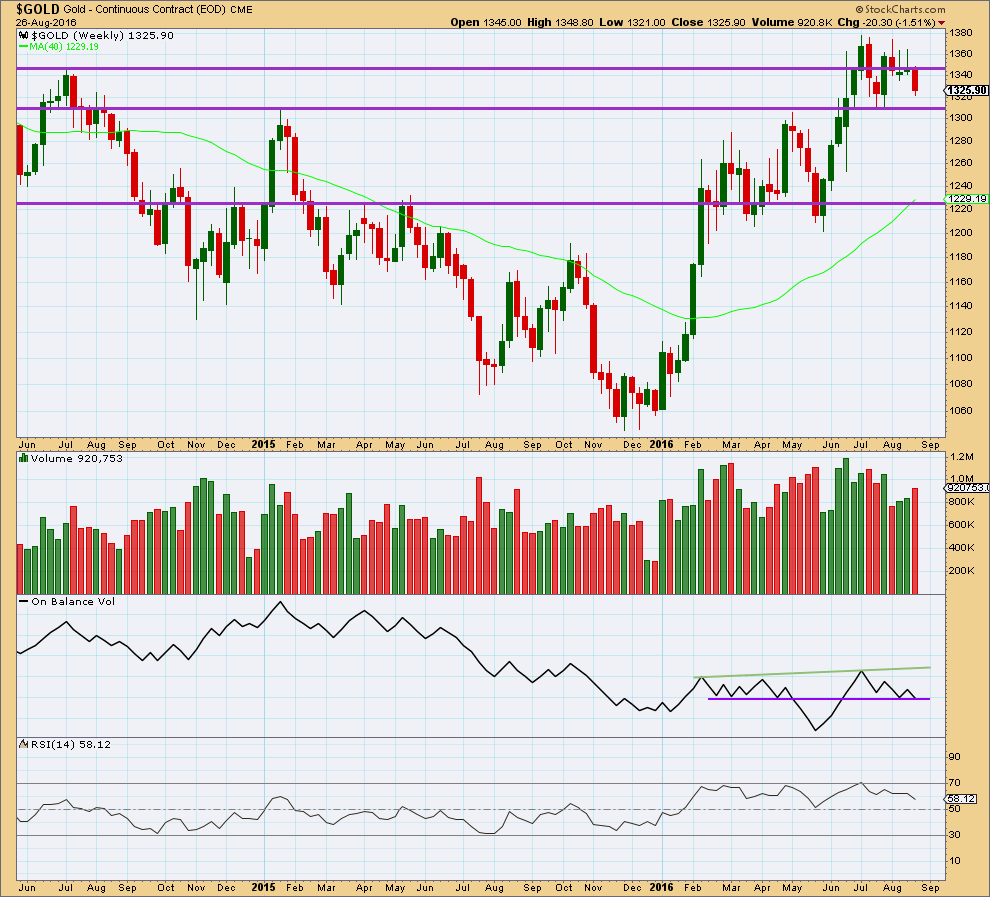
A strong downwards week with an increase in volume supports the main and alternate III wave counts. Overall, volume is still declining and price remains range bound.
The prior two green weekly candlesticks had long upper shadows which was bearish.
Price may find some support about 1,310.
On Balance Volume at the end of this week has come down to find support at the purple trend line. This may help to stop price falling much further.
RSI is not extreme. There is some hidden bullish divergence with price and RSI: RSI has made a lower low below the low of 25th of July but price has made a higher low. This indicates some weakness to this downwards movement. It is more likely to be a smaller correction than a sustainable trend.
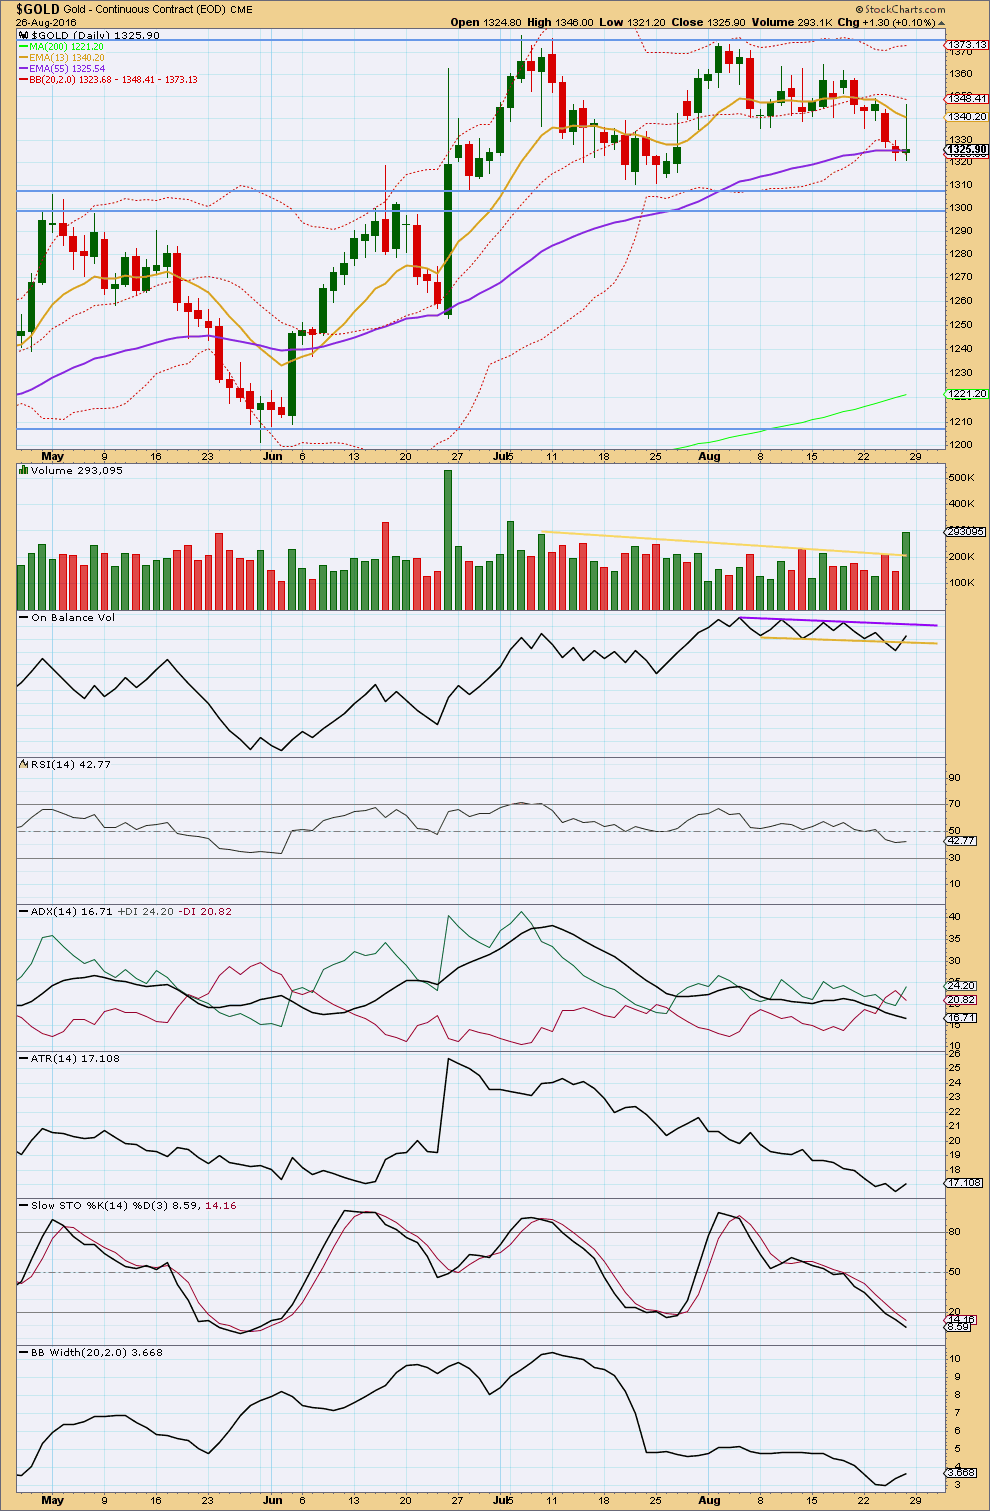
DAILY CHART
The regular technical analysis yesterday was very bearish. It is more bullish today.
Friday’s session saw overall upwards movement and a strong volume spike. Volume during the consolidation, which began back on about 7th of July, is now strongest for two upwards days of 8th of July and 26th of August. This suggests an upwards breakout is more likely than downwards.
Price may be finding some support about the 55 day moving average. The next support line would be about 1,310 – 1,305.
The bearish signal given from On Balance Volume in last analysis with a break below the yellow support line is now negated by OBV returning back above the line. OBV may find some resistance at the purple line. A break above the purple line would be a bullish signal.
RSI is not extreme and exhibits no divergence with price.
ADX is declining, indicating no clear trend. The +DX and -DX lines are fluctuating about each other, which is common for a consolidation.
ATR shows a small increase for Friday’s session, but one day of increase is not enough to indicate a trend beginning. Overall, in agreement with ADX, ATR is still declining.
Stochastics is more firmly entering oversold now. Now that Stochastics is oversold, it should be expected that price end its downwards swing when it finds support about 1,310 – 1,305. This fits the main and alternate III Elliott wave counts.
As the Bollinger Bands are now beginning to widen, a trend may be about to begin.
This analysis is published @ 02:04 a.m. EST on 28th August, 2016.

IMO Gold price looking to rally; will look to short the rally 1333-37 range.
Weiquan…. et al,
I see that ‘possible’ flag forming = largest hi/lo looks to be 1.61pts. From 27.24 cls. (on my platform), would take us to 25.63. 25.67 would fill Brexit gap 6/23-6/24 on GDX.
Here’s The Daily Gold’s take: http://thedailygold.com/a-bit-more-downside-potential-in-gold-stocks/
Melanie thanks for sharing this good article and charts.
The target for minute iii may have been too low. It may have ended at the low for today, this upwards movement may be minute wave iv
Minute iv may not move into minute i price territory above 1,330.01. Minute ii was a deep zigzag. Minute iv may be a flat, combination or triangle most likely. It may be shallow and sideways taking a few days even.
This is all new as gold may have bottomed today and miners Thursday that is my guess however as per Elliott Wave there is no confidence or confirmation points reached, which is a very slow process.
Yes miners do catch up however if gold had a 1st wave up today maybe then a 2nd wave down, which would effect miners.
Slow process, and with EW its 3 steps forward 2 steps back and maybe delay to start things up, depending if it is confirmed if a strong 3rd wave up has started.
Many unknowns many guesses, many opinions.
The thrills and chills of investing in miners.
It looks like GDX is forming a bear flag. It’s hard for me to buy it unless gold goes above 1357 according to Lara’s analysis. It’s good to practice patience. 🙂
Yes, I agree. The most successful traders will tell you to always wait for price confirmation. Theory is fine, but you don’t know for sure its going to happen until it happens.
Yup, price confirmation could save lots of headaches maybe $$. 🙂
1356.85 is the daily bull confirmation.
1339.58 is the hourly bull confirmation.
Lara’s chart offer different levels such as
confidence,
price confirmation
trend channel confirmation
etc.
Choose your own comfort level for trading.
You could also add some trending indicators at different time frames to assist you.
Although quiet a lot may be happening.
Miners may have bottomed Thursday and Gold may have bottomed last night.
Gold hit a new low last night at 1315.
GDX bottomed Thursday then hit a top of a 1st wave up Friday then dropped and hit a bottom of a 2nd wave today at 9:33 am and moved up.
Gold and GDX are both trending up again today on multiple time frames.
http://www.pmbull.com shows gold in an upwards channel for 1,5,15 minutes since last night low at 1,315, which was Lara’s original bullish low target. She may be right.
NUGT the Low since June 23rd was last Thursday 9:35 am 20.57, then top 1st wave 10:17 am 24.87 then bottom 2nd wave down ended Monday 9:33 am 20.75
Avi Gilburt – August 28 – Article on GDX
Sentiment Speaks: An Investor’s Journey Through Fundamentals, Technicals, And Market Sentiment To Significantly Increase Profits
http://seekingalpha.com/article/4002550-sentiment-speaks-investors-journey-fundamentals-technicals-market-sentiment-significantly
Thanks for the article Richard. I agree with AVI’s take on the PM situation.
Hmmm…. Avi might be a good guy, but take his advise with a grain of salt. He wrote an article on Aug 12 regarding gold is about to take off. The fact was GDX really started falling. He also wrote other articles regarding GDX is about to start the heart of wave 3….. It’s pretty amazing that a chart guy would write long long fundamental articles. That’s why I only follow charts. 🙂
Sentiment Speaks: Time To Buy Gold To Prepare For A Stock Market Crash?
http://seekingalpha.com/article/3999138-sentiment-speaks-time-buy-gold-prepare-stock-market-crash
Sentiment Speaks: Gold Is Heading To $25,000
http://seekingalpha.com/article/4001490-sentiment-speaks-gold-heading-25000
25,000 seriously. The high of gold this year is still around 1378 lol
weiquan
You are right take Avi Gilburt’s advice with a grain of salt.
The same applies to other analysts.
I read his articles for the nuggets of gold and there are some.
He also provides additional valuable information about GDX often,
whether it is precise or not is sometimes yes sometimes no.
As for the $25,000 Gold forecast it is a 50 FIFTY year forecast.
I have made thousands from his forecasts and he is one of the few analysts that I read and yes Lara is the best of the best gold forecaster, yet I get value from a few of the rest. It gives me a second opinion to accept or reject.
I think so too, it’s good to know other good analyst’s thinking. I still like to use price to confirm it.
Gold dropped to a low of 1,315.09 at 9:05 pm.
That appears to be following the Hourly Alternate Bull which shows first the 1,315 area then moving higher above 1,339.58. The Hourly Main Bear had first a move higher towards 1,332 then a new low. We may have clarity by the open.
What a tape. Lara did a great job!
Since last june we have tested these levels three times and havent made a low below 1310. I think we should hold for now. Nxt crucial data is ADP on wed which will give us the miror of what can friday NFP data be. But looking at the last two NFPs, in a worse case also it can atleast be in line with the expectations. Silver on the other hand had been hit badly so waiting for silver to takeoff first.
Lara: Great analysis. Looking forward to up turn soon.
On Pmbull site gold hourly chart shows gold made it to 1341.97. But hourly chart in the report shows 1339.58. Stockchart gold chart has Friday high as $1346.
Same age old data feed problem.
Thursday’s report had this in the summary: “A new high above 1,341.45 would indicate the main wave count is correct, so expect upwards movement to continue with strengthening momentum and volume to a target at 1,582.”
In few days gold should be moving higher. Thanks!!!
It seems to be that much of the prevailing bearish price action in Gold was precipitated by Yellen’s mis-direction regarding rates. So far as I can determine, there is absolutely no credible reason to believe that Gold is starting a new bear market, and that means the current correction would have to be viewed as being corrective. If that is true for Gold, I believe it is also true for the miners. If I am correct, the banksters are giving long term PM investors a golden ( pun intended) opportunity! 🙂
Hello & Good day ROBERT! I am pretty much on board enjoying Lara’s day to day analysis. Fascinating how she does it. Quite brilliant. It is a tricky trade these days; one just has to be cautious. All the very best and may you have a profitable trade. GL
Hey lara great analysis…variety of wave counts..but smetimes its hard to choose them in a market.
Just one word from me. Dont you think that the Daily TA is actually supporting the daily alternate ? Is thers a solid bottom already formed ?
Possibly. It is fairly bullish.
But, the problem is despite the bullish volume spike, price at the lower Bollinger Band, and On Balance Volume negating the prior bearish break of support, none of these things are firm on a low being formed.
All three of those bullish signals may be followed by a little more downwards movement. None of them in my experience pinpoint the low.
For confidence that a low is in place I would want to see price at support, and RSI showing divergence.
RSI and price divergence at lows is often fairly reliable.
But again, price could still move lower for a day or two after the first divergence at a low…. not often, but sometimes.
So another very few days of downwards movement for price to find support is IMO just as likely as price having a low last week.
Thanks a lot Lara. It looks like a tremendous amount of your very advanced work in many regards went into creating this very detailed analysis. I think a lot of gold investors who don’t get your updates may likely end up with some bearish surprises. It’s a bonus that we have your alternates so we can follow gold’s path closely this week.
Thank you Richard for the kind words, and you’re very welcome.
I’m looking forward to finding a nice entry for the next wave up.