A correction was expected to unfold, which is what has happened, but it was expected to be over more quickly though.
Summary: The trend is up. The target remains at 1,582. Corrections are an opportunity to join the trend. Invest no more than 3-5% of equity on any one trade and always use a stop loss on all trades. In the short term, a correction should end soon at 1,347 – 1,346.
New updates to this analysis are in bold.
Grand SuperCycle analysis is here.
Last weekly chart is here.
DAILY ELLIOTT WAVE COUNT
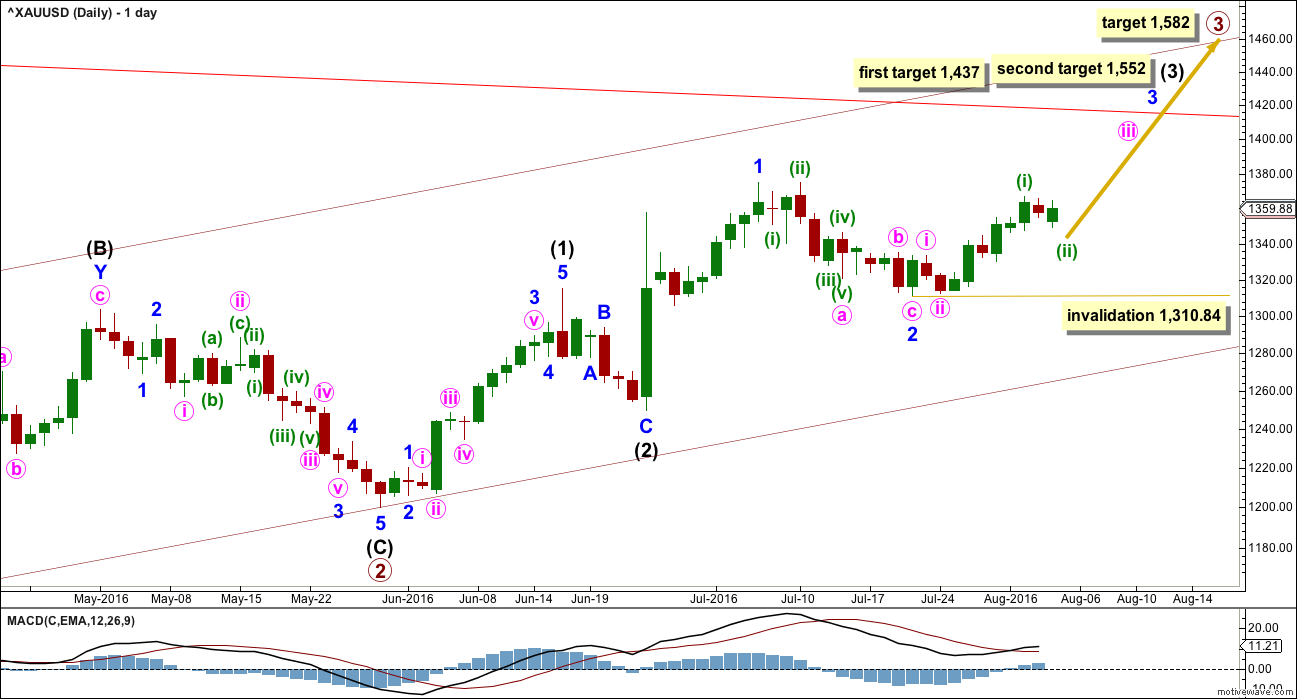
Primary wave 2 is a complete expanded flat correction. Price from the low labelled primary wave 2 has now moved too far upwards to be reasonably considered a continuation of primary wave 2. Primary wave 3 is very likely to have begun and would reach 1.618 the length of primary wave 1 at 1,582.
Primary wave 3 may only subdivide as an impulse.
So far intermediate waves (1) and (2) may be complete within primary wave 3. The middle of primary wave 3 may have begun and may also only subdivide as an impulse.
Within intermediate wave (3), the end of minor wave 1 is moved up to the last high. This fits on the hourly chart although it looks odd here on the daily chart. There was a small fourth wave correction up at the end of minor wave 1 and it subdivides on the hourly chart as an impulse. Minor wave 2 may be a complete zigzag, also subdividing as a zigzag on the hourly chart. If minor wave 2 is over, it would be 0.50 the depth of minute wave i.
No second wave correction may move beyond the start of its first wave below 1,310.84 within minor wave 3.
At 1,437 intermediate wave (3) would reach 1.618 the length of intermediate wave (1). If price keeps going upwards through this first target, or if it gets there and the structure is incomplete, then the next target would be at 1,552 where intermediate wave (3) would reach 2.618 the length of intermediate wave (1).
HOURLY ELLIOTT WAVE COUNT
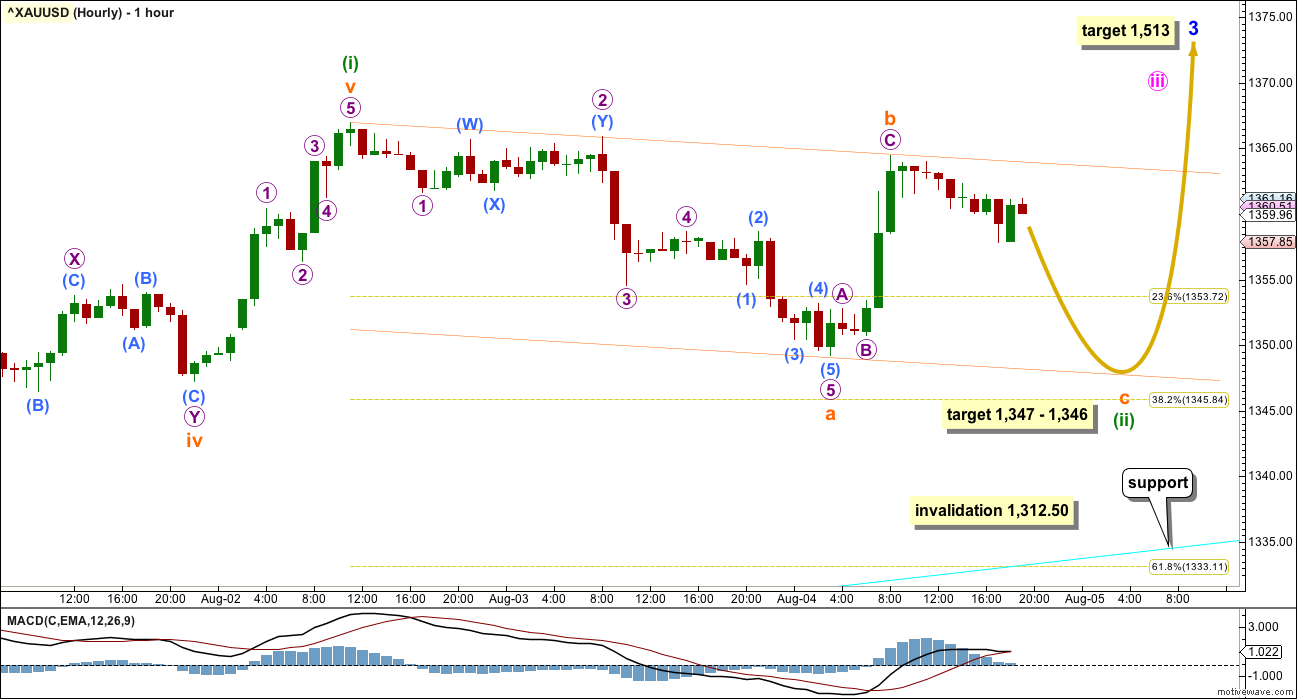
Three first and second waves are complete: intermediate waves (1) and (2), minor waves 1 and 2, and minute waves i and ii. All are shown on the daily chart.
Minuette wave (i) is complete within minute wave iii. Minuette wave (ii) is most likely still incomplete.
Within minuette wave (ii), subminuette wave a fits best as an impulse and looks like a five wave structure. If this is correct and subminuette wave a is a five, then the correction for minuette wave (ii) cannot be over there. Minuette wave (ii) would be subdividing as a zigzag. Within the zigzag, subminuette wave b may not make a new high above the start of subminuette wave a at 1,366.95. A new high short term prior to a low below 1,349.25 would mean the analysis of minuette wave (ii) is wrong, and it would then most likely be over already.
At 1,347 subminuette wave c would reach equality in length with subminuette wave a. This is very close to the 0.382 Fibonacci ratio of minuette wave (i) at 1,346, giving a $1 target zone with a reasonable probability.
If price keeps falling through this target zone, then the next possible point for downwards movement to end would be the 0.618 Fibonacci ratio at 1,333.
Minute wave ii one degree higher lasted 41 hours. So far minuette wave (ii) is longer in duration, but not so much so that the wave count looks wrong. It should be expected to be over quite soon, very likely now within the next few hours. It may come to a swift end.
When minuette wave (ii) is complete, the reversal should be clear: Minuette wave (iii) upwards should begin with clearly upwards movement, not sideways.
Minuette wave (ii) may not move beyond the start of minuette wave (i) at 1,312.50.
The lower cyan trend line may offer support. If this line is touched, expect price to bounce up from there. If that happens, it would offer a very good entry point for long positions.
TECHNICAL ANALYSIS
WEEKLY CHART
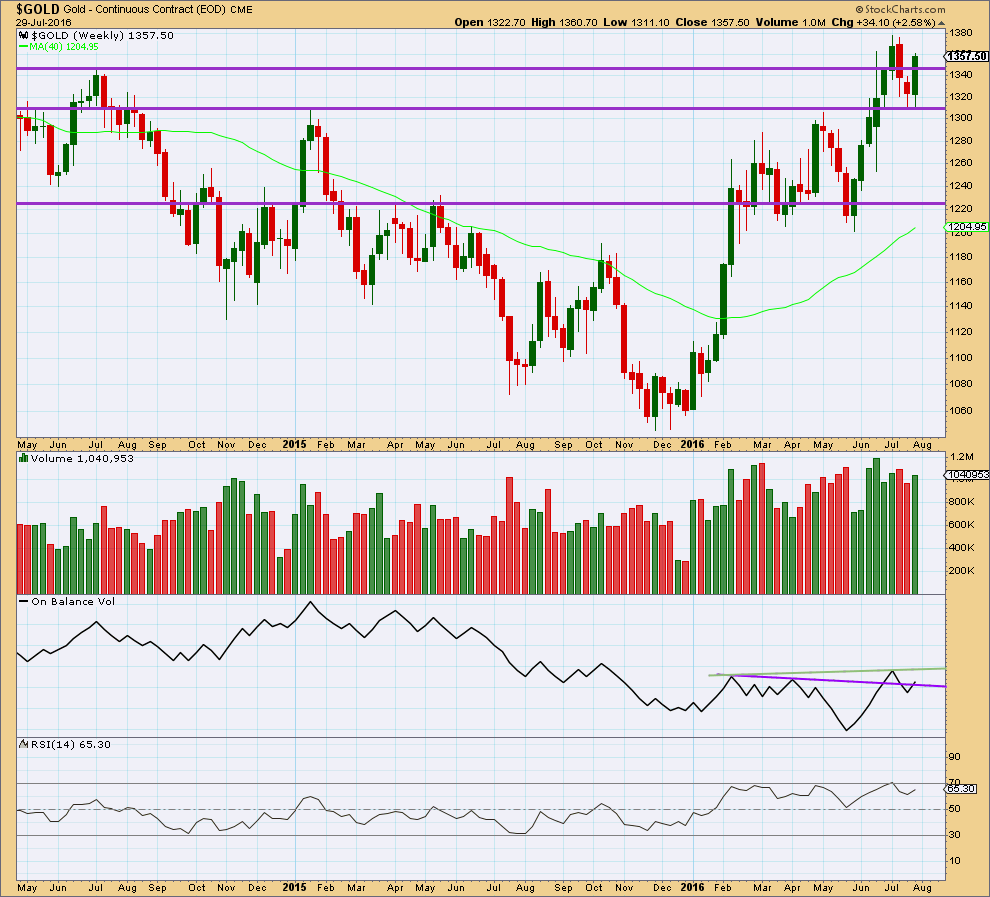
Last week completes a bullish engulfing weekly candlestick that has stronger volume than the week before. After a short downwards movement, this is a reversal pattern from down to up or down to sideways.
Price broke above resistance last week about 1,345 and closed above this line. Next resistance would be about the last high about 1,380.
On Balance Volume is giving a bullish signal at the end of last week with a break above the purple trend line. The next line to offer resistance for OBV is the new green line.
RSI is not extreme yet. There is room for price to rise further.
Overall, the weekly volume profile is bullish. Volume increases as price rises and volume declines as price falls. There is no indication yet of an end to this upwards trend at the weekly chart level.
DAILY CHART
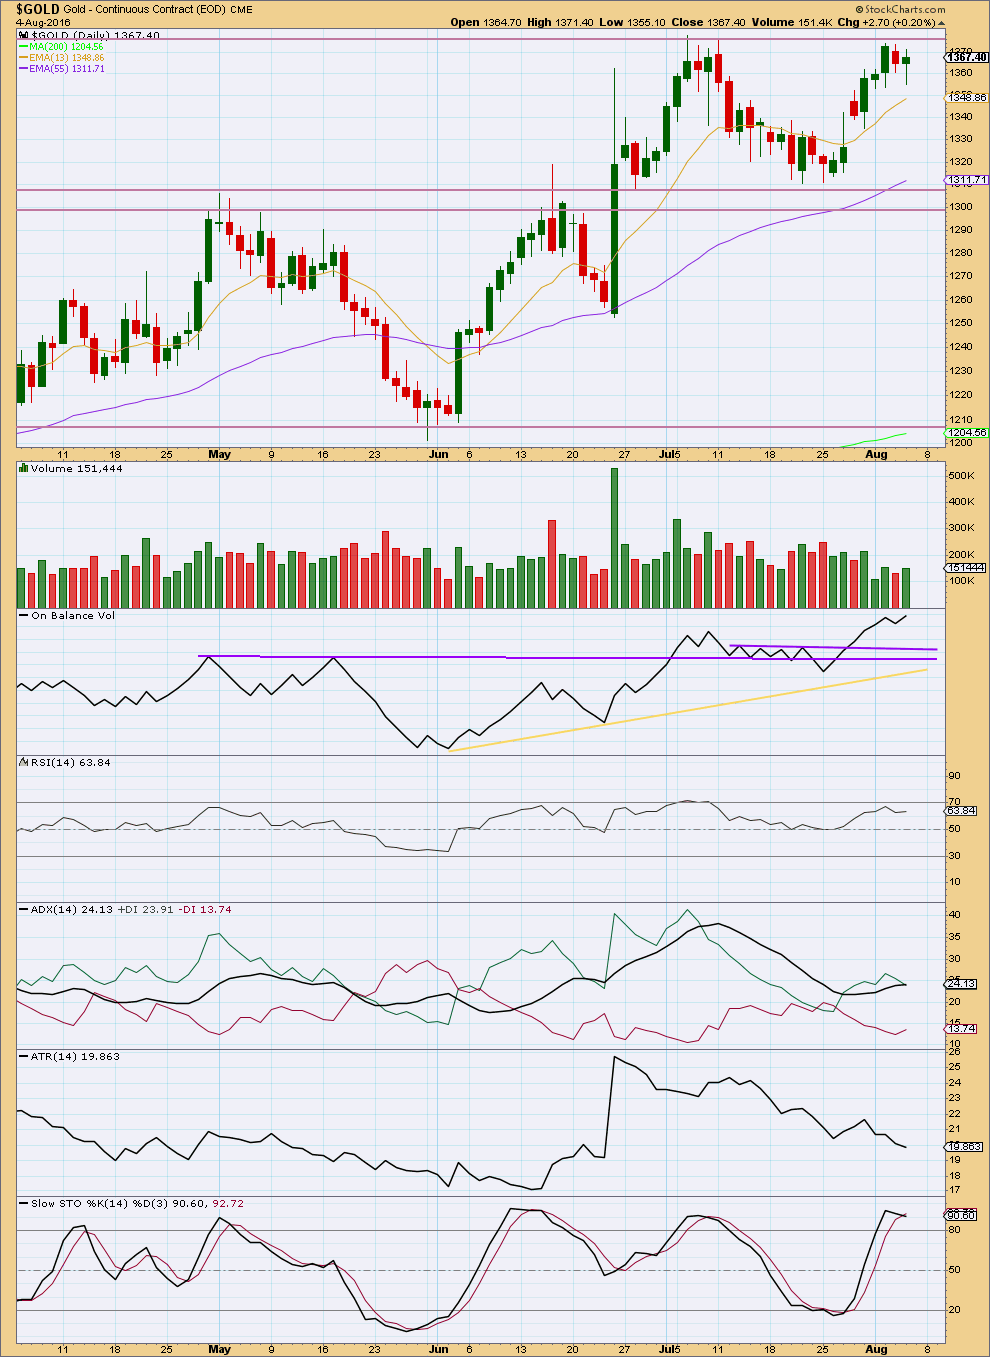
With price in a small correction, lighter volume should be expected. Volume for Thursday is light but stronger than the prior downwards day. This offers some support to the Elliott wave count and indicates that the trend is still most likely upwards.
There is still some concern that since the low on 25th of July volume is overall declining as price is moving higher. Sometimes Gold’s waves begin like this, and recent examples can be found since the low on 3rd December 2015, but it is still some cause for concern. The decline in volume makes this upwards movement so far look corrective and does not support the Elliott wave count.
Caution is advised if entering long positions here based upon this wave count. It is absolutely essential that risk is managed; stops must be used so that your account is not fully exposed in the event that the correction continues lower.
On Balance Volume is bullish with a break above the purple trend lines. OBV still exhibits some hidden bearish divergence with price though: as OBV made a new high price did not. This indicates some weakness in price. However, trend lines are a more reliable signal than divergence from OBV. On balance OBV is more bullish than bearish.
ADX is still slightly increasing today, indicating there is still an upwards trend in place. ATR still disagrees though as it is declining. There is some concern that this upwards wave from the low on 25th of July is showing weakness.
RSI is not extreme. There is room for price to rise or fall.
Stochastics is returning from overbought, and price may be returning from resistance. If this upwards wave is part of a larger correction as ATR and volume suggest it may be, then a downwards swing would be expected to continue from here until price finds support about 1,310 and Stochastics is oversold at the same time.
This analysis is published @ 09:14 p.m. EST.


Gold 1334.79 at 3:33 just came $1.50 from the target.
“the target becomes aligned with 1333.31 which is the 0.618 retrace of Minute 2.”
Miners dropped hard today on worst gold day in 10 weeks.
Lara mentions “Buy on Corrections”.
Curious about Lara’s assessment about today.
Curious how miners will perform next week as they tend to move up from big dips.
NUGT day Range 151.81 – 158.48
August 2nd high 177.50
July 25th day low 117.10
GDX day Range 30.07 – 30.47
August 2nd high 31.64
July 25th day low 27.45
Gold logs worst daily loss in 10 weeks after stellar jobs report
Aug 5, 2016 1:52 p.m. ET
Its worst one-day drop since May 24
http://www.marketwatch.com/story/gold-logs-worst-daily-loss-in-10-weeks-after-stellar-jobs-report-2016-08-05
Lessons to be learned: Divergence identified in technicals prior to today’s correction, Volume reduction, Double top, large put options purchased, and overall…. emotion running high to catch the wave before it’s missed.
Now, we play the game all over again: Fed speakers, Fed minutes will pump up the probabilities of a September rate hikes. Another GDP report and another jobs report to come followed by the Fed decision in September.
I believe the 30 day return for both NUGT and GDX is around 0%.
Looking forward to seeing the arrival of Minuette 3 with clear upwards movement.
Stephen K
Your post revealed the reality of gold and miners trading, which contains an extreme range of emotions, sad, true, estatic, wishful thinking, heartbreak, hold long term for pot of gold or day trade the small runs and miss some big ones, or swing trade likely lows to likely highs and exit the unlikely and miss some victories and losses. Then play the game all over again.
Dance to the tunes played by EW, 3rd and 5th wave Blowoffs, B wave mysteries, FED FOMC, big US news, overnight thrills and chills and much, much more.
I’m exhausted just reading that post! Too funny! Looking forward to sleeping tonight knowing that I don’t have to keep one eye on gold pricing!!!
It now looks like submicro 5 is extending.
I will need to push down all the movement since Submicro 4 at 1340.28 down one degree.
I’ll now consider the recent low of 1336.96 as the first wave of Submicro 5, that is, miniscule 1.
In this way, the target becomes aligned with 1333.31 which is the 0.618 retrace of Minute 2.
The correction should then end by Monday, and not today.
Have a nice weekend guys.
Thanks, Alan. Have a great weekend!
Thank you. You too.
Thanks you too!
Thanks Geoffrey. Enjoy your weekend.
Hello Alan,
All the best!
Thank you very so much for your timely detailed trading numbers.
I value your diligent analysis.
Thanks pete. Glad to share.
Alan, thank you for providing us with your analysis of this movement. It is helpful.
Wishing you have a nice weekend too. See you Monday.
Thank you, dsprospering.
Enjoy the respite of the weekend.
Just to get some bearings on the wave count so far.
The price of 1341.6, which was the spike down after the jobs report was released at 8:30 am, was micro 3 of Subminuette C of Minuette 2.
The immediate retrace to 1351.84 at 8:45 am was micro 4.
We are now in micro 5 down. Submicro 4 was 1340.28 at 1:12 pm. Currently, we are have most likely completed miniscule 3 of Submicro 5 at 1337.35 at 2:23 pm.
It just needs a small wave up (miniscule 4) and one last drop (miniscule 5) to complete the correction.
At this point, unless submicro 5 extends, my targets are:
1336.85 or 1336.01 calculated from micro 5;
1337.66 calculated from Subminuette C;
1335.68 calculated from Minuette 2; and
1333.31 based on 0.618 retrace of Minute 2.
Sorry, it looks like miniscule 3 had only completed at 1336.96 at 2:30 pm.
Thanks for your detailed analysis
“Stochastics is returning from overbought, and price may be returning from resistance. If this upwards wave is part of a larger correction as ATR and volume suggest it may be, then a downwards swing would be expected to continue from here until price finds support about 1,310 and Stochastics is oversold at the same time.”
Apart from all this the much concerning factor today will be the volume profile..this downward day should come with decreasing volume else nxt week start will be negative..
Lara mentioned she may not be reachable today, to post before closing.
Does this downward movement fit to conclude minuette ii? Wave count anyone?
No wave count however today’s low of 1336.92 at 10:43 am is between the two lower targets of 1347-1346 and then 1333 or cyan area which is 1334 as per Lara’s hourly chart.
If 1337 is the bottom, then minuette (II) ended in 13 hours, that is more than a few hours.
First a swift $20 drop in 2 minutes at 8:30 am then a sideways decent for 2 hours down another $4.
Movement has not been clearly up it has been sideways for 3 hours in a 3 dollar range.
“It should be expected to be over quite soon, very likely now within the next few hours. It may come to a swift end.
When minuette wave (ii) is complete, the reversal should be clear: Minuette wave (iii) upwards should begin with clearly upwards movement, not sideways.”
When looking at hourly chart to me, it looks like we may be finishing the third wave down of C wave with fourth and fifth waves to follow which would suggest the lower target between 1330-1335. May not end until Monday.
Could we be looking at a classic cup with handle candlestick formation on the daily chart? This thrust downward would be part of the handle.
“Handle: After the high forms on the right side of the cup, there is a pullback that forms the handle. Sometimes this handle resembles a flag or pennant that slopes downward, other times it is just a short pullback. The handle represents the final consolidation/pullback before the big breakout…”
http://stockcharts.com/school/doku.php?id=chart_school:chart_analysis:chart_patterns:cup_with_handle_continuation
If gold breaks $1335ish, the pattern of higher lows and higher highs will be broken. There will be an entirely different wave count at that point.
Per Lara: “When minuette wave (ii) is complete, the reversal should be clear: Minuette wave (iii) upwards should begin with clearly upwards movement, not sideways.”
I wonder what the catalyst will be to trigger Minuette (iii)? The jobs number today was very strong, the $US dollar jumped, bonds sold off, and the probability of a rate increase for September increased.
Based on Lara’s additional comments, I’m hoping that gold comes up short of falling to the second fib ratio; $1,333. It’s fallen beneath the first fib ratio to $1,340 so let’s hold the line.
“At 1,347 subminuette wave c would reach equality in length with subminuette wave a. This is very close to the 0.382 Fibonacci ratio of minuette wave (i) at 1,346, giving a $1 target zone with a reasonable probability.
If price keeps falling through this target zone, then the next possible point for downwards movement to end would be the 0.618 Fibonacci ratio at 1,333.
Minute wave ii one degree higher lasted 41 hours. So far minuette wave (ii) is longer in duration, but not so much so that the wave count looks wrong. It should be expected to be over quite soon, very likely now within the next few hours. It may come to a swift end.”
Unfortunately it seems more likely that 1333 is reached today than does a reversal up. Like you said, I don’t see any catalyst for a reversal on a Friday after a major news release. To me it seems that next week would be the likely time for a reversal and third wave up. I don’t know how this squares with the time length of minuette wave (ii), though, given that Lara has stated it should be over by now.
Gold dropped from 1,361.11 at 8:29 am down $20 to 1,341.86 with US non-farm payroll news at 8:30 am EST back up to 1355 and now down to 1344.81 at 8:38 am.
8:30 am U.S. creates 255,000 jobs in July; unemployment 4.9%
8:30 am Dollar strengthens after July jobs report
8:32 am December gold falls $11.30, or 0.9%, to $1,354.20/oz
8:52 am U.S. stock futures jump after stellar jobs report
WASHINGTON (MarketWatch) – The U.S. added 255,000 jobs in July, a second straight strong gain that shows the economy is still quite healthy despite somewhat slower growth. Economists polled by MarketWatch had predicted 185,000 new nonfarm jobs. The unemployment rate was unchanged at 4.9%. The labor-force participation rate edged up to 62.8%, as more than 400,000 people joined the labor force, the government said Friday. Average hourly wages rose 0.3% to $25.69. Hourly pay increased 2.6% from July 2015 to July 2016. Employment gains for June and May, meanwhile, were revised up by a combined 18,000. The government said 292,000 new jobs were created in June instead of 287,000. May’s gain was raised to 24,000 from 11,000.
Rambus “What this six point bullish expanding flat bottom triangle is telling us that the correction has been taking place for six months already and the consolidation pattern is finished building out and the next impulse move higher is just beginning. ”
https://rambus1.com/2016/08/04/gld-update-234/
Thanks for posting this, Dreamer. I noticed that today’s candlestick constitutes a good backtest of the upper trendline on this chart from Rambus.
Yes, seems like we are slowly building energy for the next strong move up. Patience required….
FRIDAY, AUG. 5 8:30 am EST – US Non-farm payrolls
July median forecast 185,000 previous 287,000
Dollar sits tight ahead of U.S. jobs data
Aug 5, 2016 1:30 a.m. ET
http://www.marketwatch.com/story/dollar-sits-tight-ahead-of-us-jobs-data-2016-08-05
I am having internet connection issues 🙁
I may not be able to provide a comment or updated chart before market close tomorrow.
If I can, I will. Just so you all know.
GDX volume was low on a small up day. The hourly GDX count has been updated to reflect the new daily count posted yesterday. I think we are very close to a strong Minute 5 of Minor 3 wave up. Minute 4 may be complete now or may go down slightly lower before moving up.
Lara, on Investing.com and PM Bull, XAUUSD shows that the high you show as SubMicro 2 is higher than the high you show as Micro 4.
I know we always have these price discrepancies with different data, but just showing this as an alternative if gold goes higher from here.
Okay, thanks Dreamer.