
A downwards spike below 19.549 invalidated the daily Elliott wave count.
Upwards movement was expected for the last week but did not happen.
Summary: A new Elliott wave count expects to see some more sideways movement before an upwards breakout. The market is range bound and an upwards swing is expected about here.
New updates to this analysis are in bold.
WEEKLY WAVE COUNT
Click chart to enlarge.
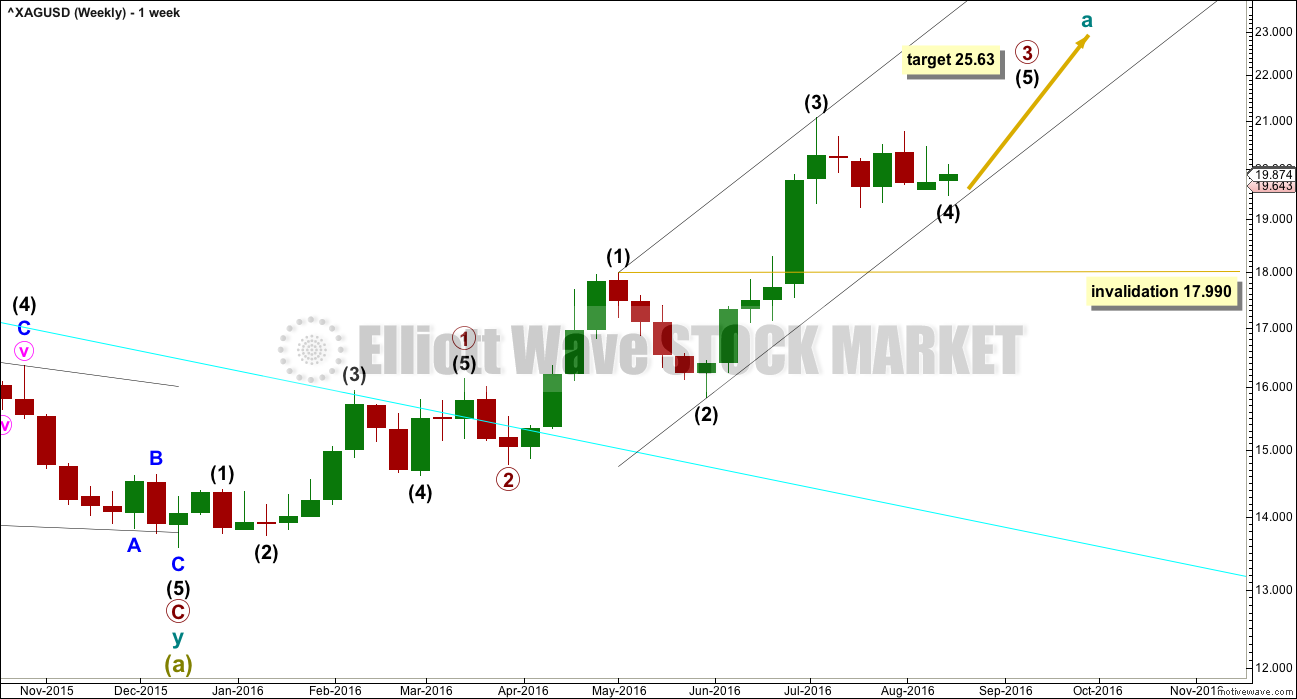
Within primary wave 3, intermediate waves (1), (2) and (3) may be complete. Intermediate wave (4) may be unfolding sideways.
Intermediate wave (4) may not move into intermediate wave (1) price territory below 17.990.
At 25.63 primary wave 3 would reach 4.236 the length of primary wave 1.
When intermediate wave (4) is complete, then the target for primary wave 3 may be calculated at two wave degrees. At that stage, the target may widen to a zone or it may change.
Intermediate wave (5) may be a swift sharp extension. It may end with a blowoff top.
DAILY WAVE COUNT
Click chart to enlarge.
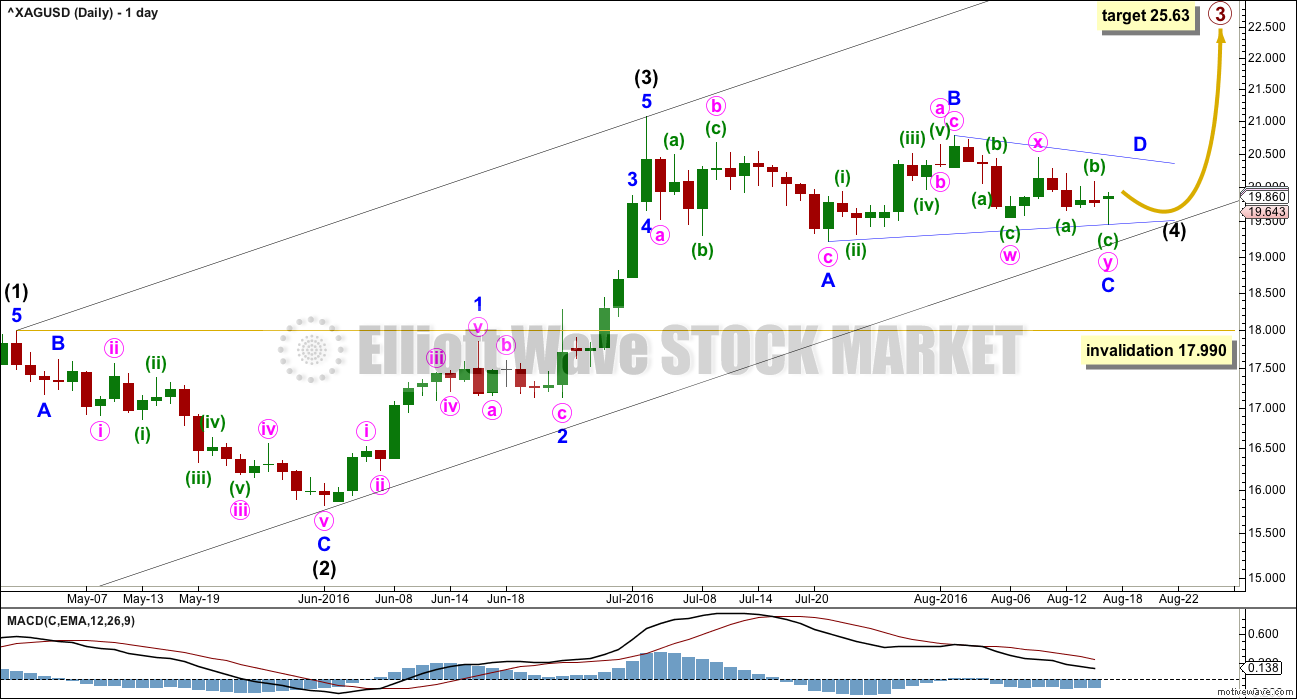
Intermediate wave (4) may be an incomplete regular contracting triangle. So far minor waves A, B and C may be complete. Minor wave D may not move beyond the end of minor wave B above 20.768. A new high reasonably above this point would invalidate the triangle. Minor wave C, if it continues lower, may not move below the end of minor wave A at 19.214. A new low below this point by any amount would invalidate the triangle.
If the triangle is invalidated, then intermediate wave (4) may morph into a double combination.
Both triangles and combinations are sideways structures. A substantial pullback for intermediate wave (4) is not expected.
Intermediate wave (1) lasted a Fibonacci 21 days, intermediate wave (2) lasted 22 days (one more than a Fibonacci 21), and intermediate wave (3) lasted 23 days. So far intermediate wave (4) has lasted 33 days, but it cannot complete in just one more day to total a Fibonacci 34; it may not exhibit a Fibonacci duration.
Intermediate wave (4) may end another one to two weeks time. It still needs several days of sideways movement to complete the structure.
When intermediate wave (4) is complete, then an upwards breakout from this consolidation would be expected by this wave count.
Intermediate wave (3) looks like a three wave structure. It may have had a quick shallow fourth wave, so the disproportion between minor waves 2 and 4 give intermediate wave (3) a three wave look.
The black channel is drawn using Elliott’s first technique. Intermediate wave (4) may find support about the lower edge.
ALTERNATE DAILY WAVE COUNT
Click chart to enlarge.
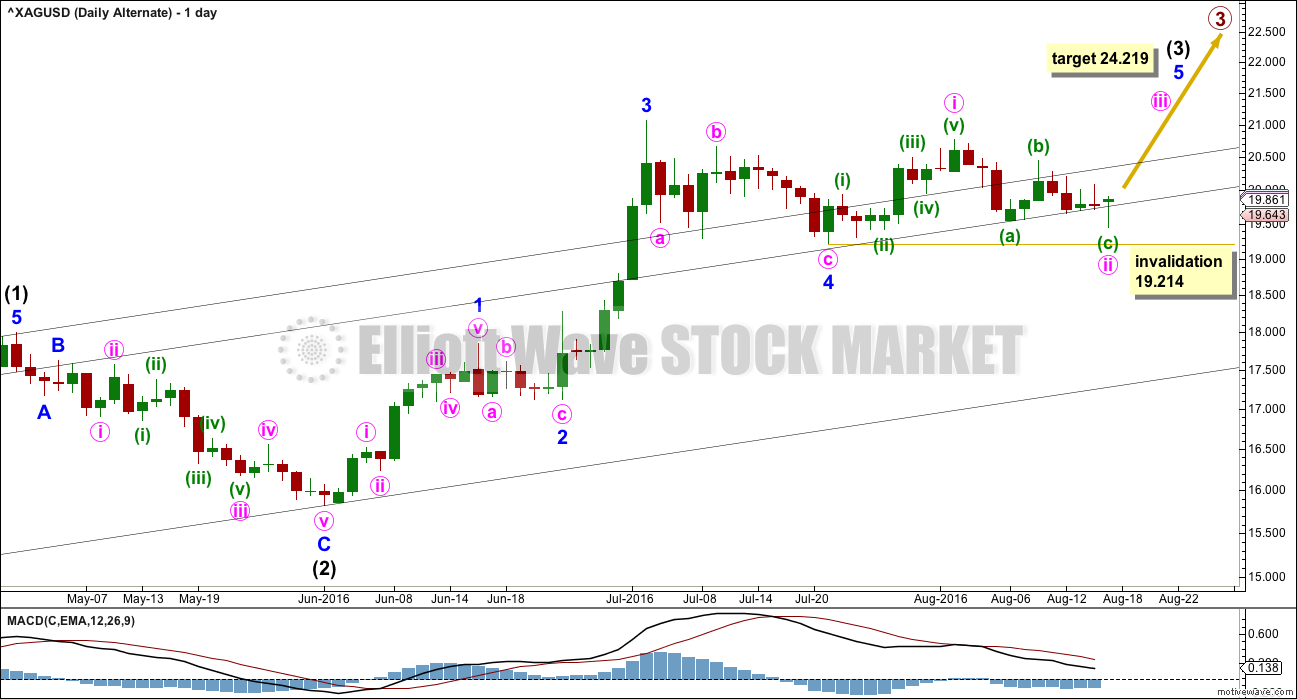
This was the main wave count until last analysis.
Intermediate wave (3) is seen as incomplete. At 24.219 intermediate wave (3) would reach 2.618 the length of intermediate wave (1). This wave count avoids the three wave look for intermediate wave (3) that the first wave count has.
The black channel here is a base channel about intermediate waves (1) and (2). A parallel copy of the upper edge is pulled down to show where price recently found some support.
Within intermediate wave (3), minor waves 1, 2, 3 and 4 may be complete. Minor wave 5 may be unfolding as an extension.
Within minor wave 5, minute waves i and now ii may be complete.
Minute wave ii may have moved lower this week as a double zigzag. It may not move below the start of minute wave i below 19.214.
This wave count expects upwards movement from this point that should show an increase in upwards momentum.
TECHNICAL ANALYSIS
WEEKLY CHART
Click chart to enlarge. Chart courtesy of StockCharts.com.
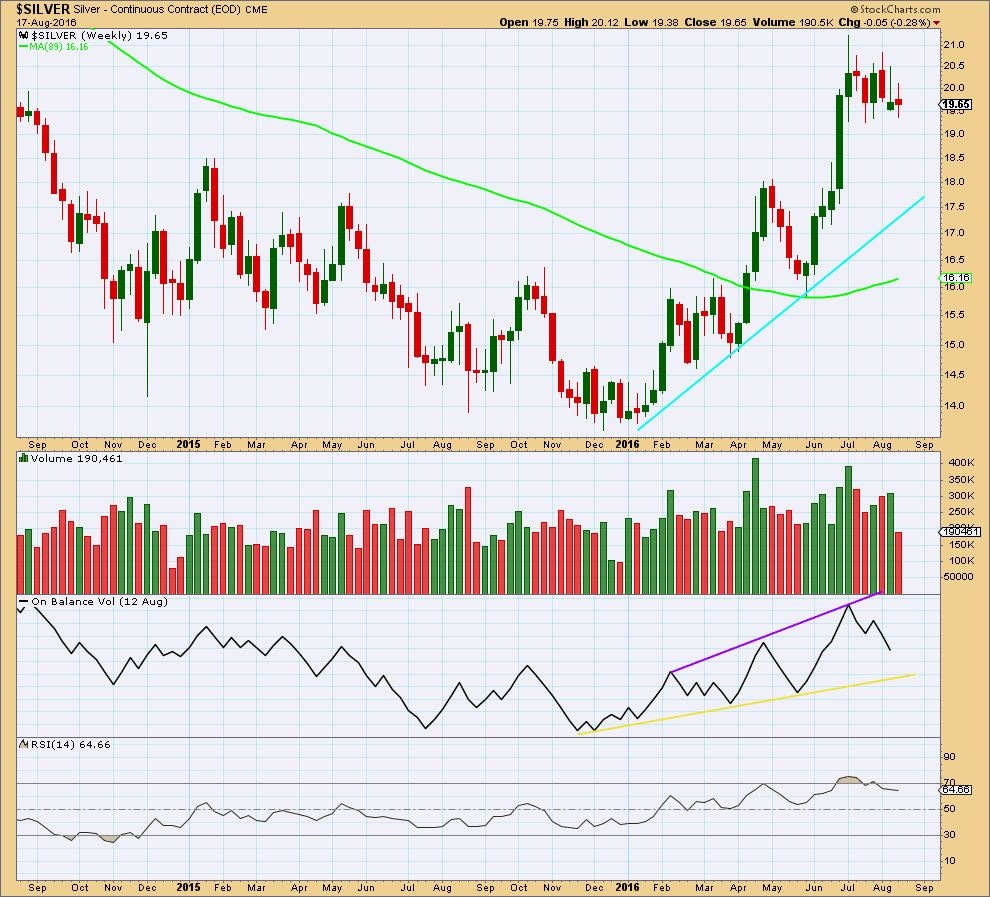
From the low in January, as price rises volume also rises and as price falls volume declines. The volume profile is bullish which supports the wave count.
A support line is added in cyan. If price again comes down to touch it, price should find strong support there.
A break above the purple line on On Balance Volume would be a bullish signal.
RSI is no longer overbought but does not exhibit divergence with price. There is no indication of weakness at the weekly chart level at this stage.
Last weekly candlestick shows again an increase in volume for a green weekly candlestick. However, the long upper wick indicates caution. This wick is bearish.
DAILY CHART
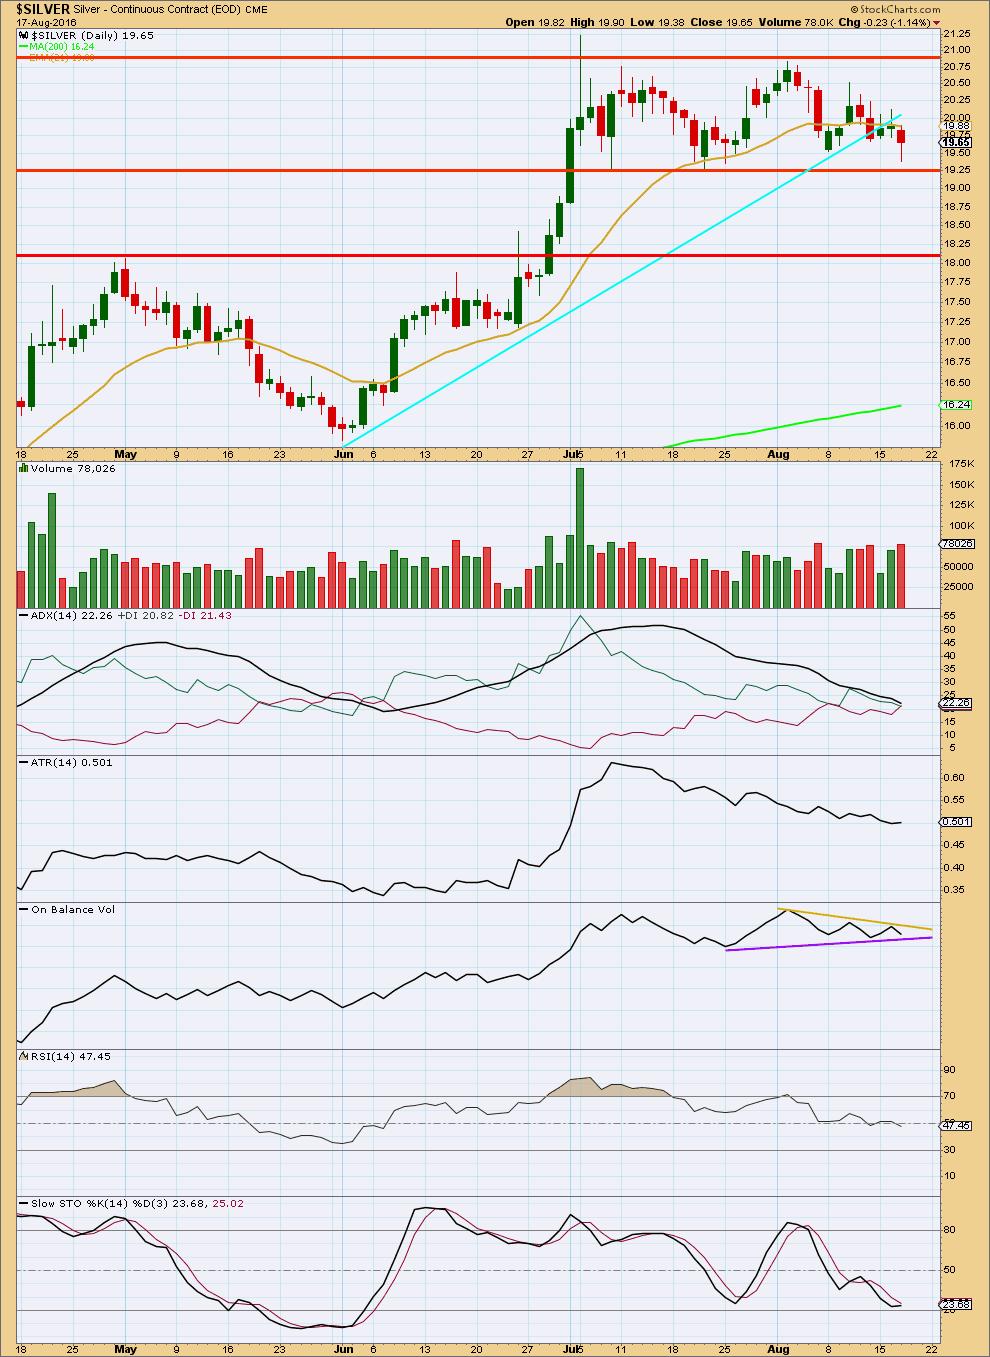
Click chart to enlarge. Chart courtesy of StockCharts.com.
Silver is range bound with resistance about 20.85 and support about 19.25. During this sideways movement, it is five downwards days which have strongest volume sending a strong signal that a downwards breakout from this range is more likely than upwards. However, this trick is not very reliable for Silver. It is noted but not given too much weight in this analysis.
ADX is still declining, indicating the market is not trending. The +DX and -DX lines are fluctuating about each other. This consolidation has brought ADX well down from extreme levels. When a trend returns, there will be room for it to move again.
ATR declines as price moves sideways, typical of a consolidation. This supports the new main Elliott wave count.
Trend lines on On Balance Volume are redrawn today. OBV remains constrained between these two lines which are quickly converging. A breakout from OBV may indicate a direction for price.
RSI is neutral. There is plenty of room for price to rise or fall.
Stochastics is almost oversold. An end to this small downwards swing may happen either here today, or very soon. If price does move a little lower, it should find support about the horizontal line at 19.25. If Stochastics moves more clearly into oversold, then an end to the downwards swing should be expected and a new upwards swing should begin.
This analysis is published @ 11:29 p.m. EST.
Thanks Lara for the early analysis. Much needed insight into what could be brewing for the poor man’s gold 🙂
You’re most welcome. It should be done my Thursday. The last couple of weeks I’ve been late…