
The main Elliott wave count expected upwards movement and the alternate expected sideways movement.
Price has moved lower.
Summary: Upwards movement is expected to 25.63 – 26.98. Declining volume and divergence with price and RSI at the last two swing lows indicates this downwards movement may be exhausted.
New updates to this analysis are in bold.
WEEKLY WAVE COUNT
Click chart to enlarge.
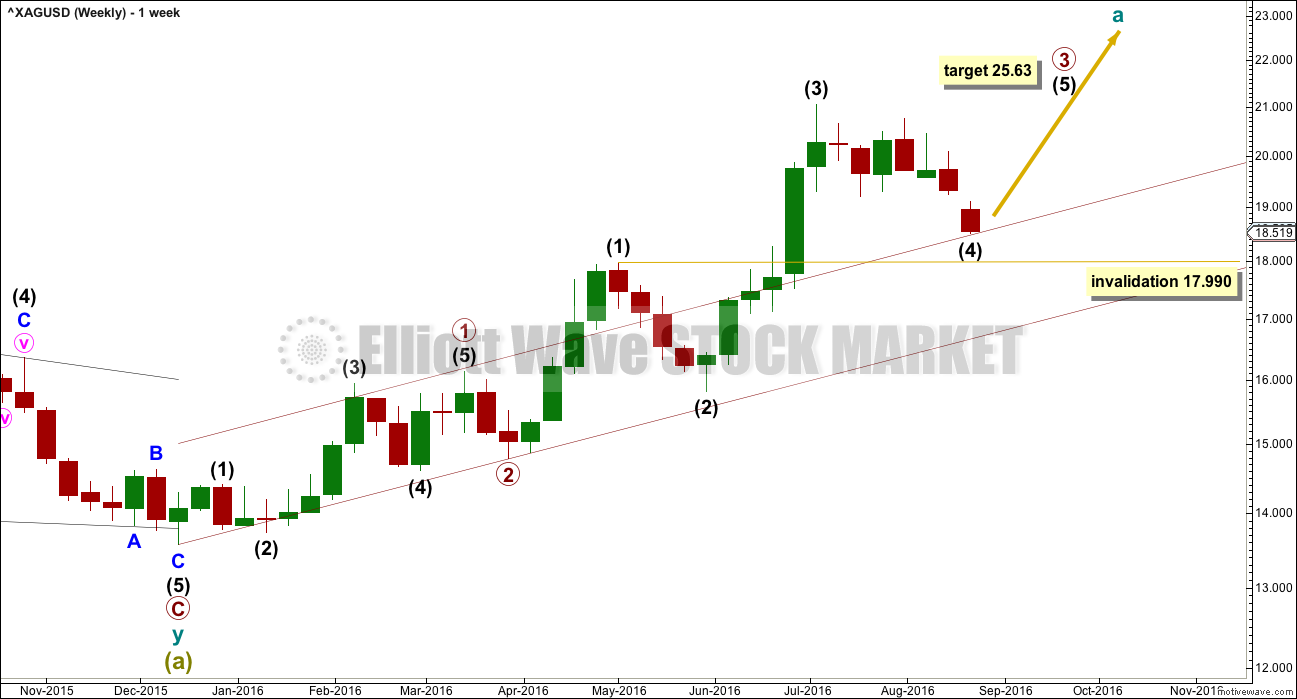
Within primary wave 3, intermediate waves (1), (2) and (3) may be complete. Intermediate wave (4) may be unfolding.
Intermediate wave (4) may not move into intermediate wave (1) price territory below 17.990.
At 25.63 primary wave 3 would reach 4.236 the length of primary wave 1.
When intermediate wave (4) is complete, then the target for primary wave 3 may be calculated at two wave degrees. At that stage, the target may widen to a zone or it may change.
Intermediate wave (5) may be a swift sharp extension. It may end with a blowoff top.
A base channel about primary waves 1 and 2 is added this week. Intermediate wave (4) may find support about the upper edge.
DAILY WAVE COUNT
Click chart to enlarge.
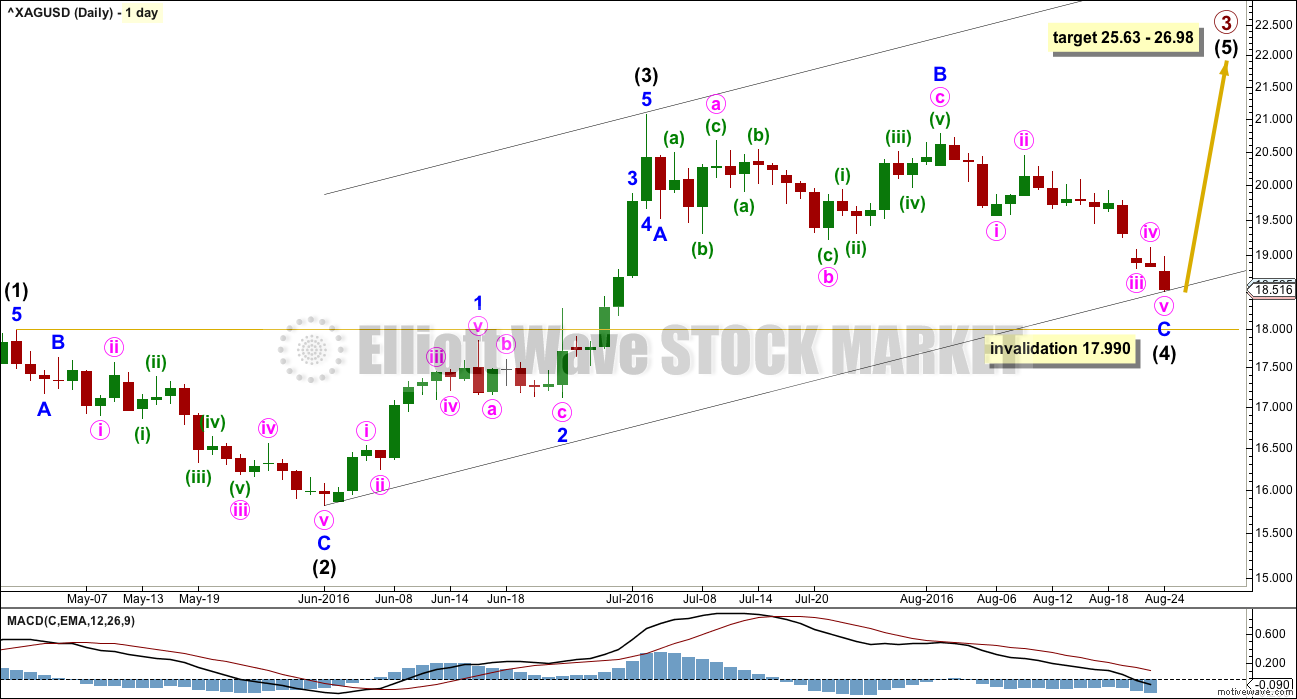
Intermediate wave (4) breached the channel drawn in last week’s analysis using Elliott’s first technique. The channel is redrawn using Elliott’s second technique. If intermediate wave (4) moves any lower, then redraw the channel.
At 26.98 intermediate wave (5) would reach 1.618 the length of intermediate wave (3). This gives a 1.35 target zone calculated at two wave degrees.
There is inadequate alternation between intermediate waves (2) and (4) because they are both subdividing as zigzags. There is some alternation so far within the structure: within intermediate wave (2) minor wave B was very brief and within intermediate wave (4) minor wave B is very time consuming. Intermediate wave (2) was a 0.68 correction of intermediate wave (1) and so far intermediate wave (4) is a 0.49 correction of intermediate wave (3), so there is a little alternation in depth.
Intermediate wave (4) may not move into intermediate wave (1) price territory below 17.990.
ALTERNATE DAILY WAVE COUNT
Click chart to enlarge.
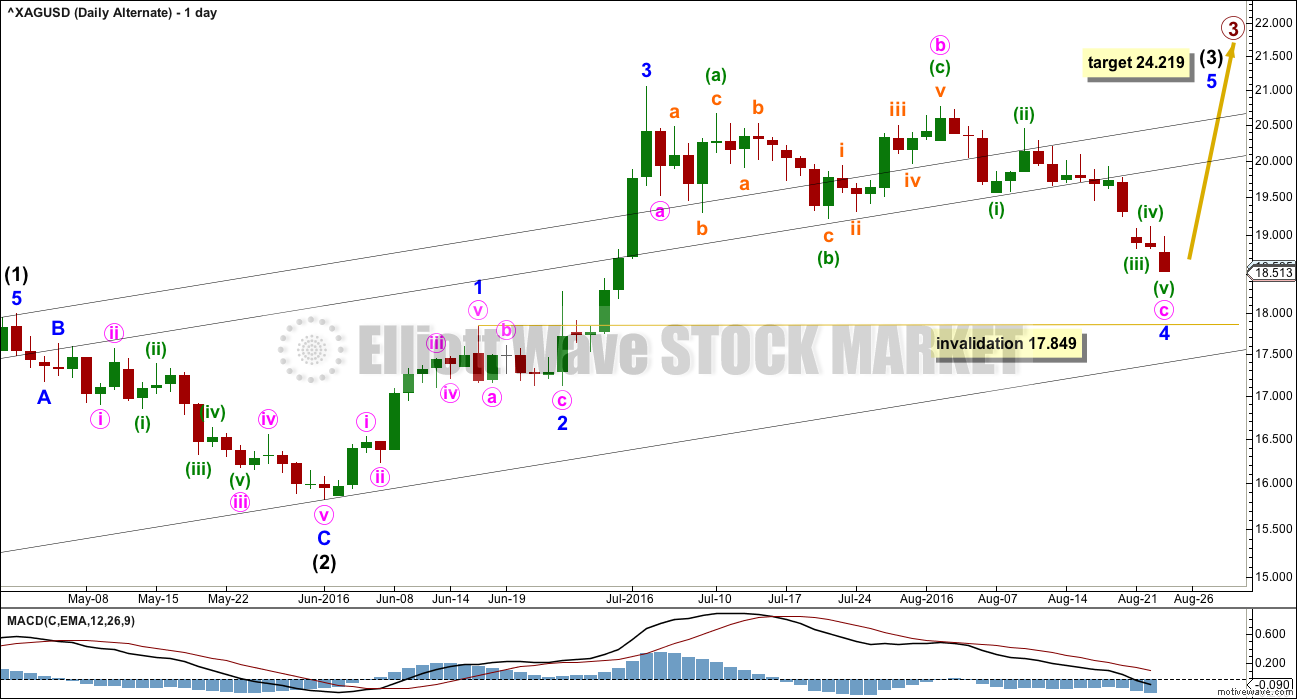
Intermediate wave (3) may be incomplete. At 24.219 intermediate wave (3) would reach 2.618 the length of intermediate wave (1). This wave count avoids the three wave look for intermediate wave (3) that the first wave count has.
Within intermediate wave (3), minor waves 2 and 4 are now grossly disproportionate giving this alternate wave count now an odd look. The probability has reduced this week.
TECHNICAL ANALYSIS
WEEKLY CHART
Click chart to enlarge. Chart courtesy of StockCharts.com.
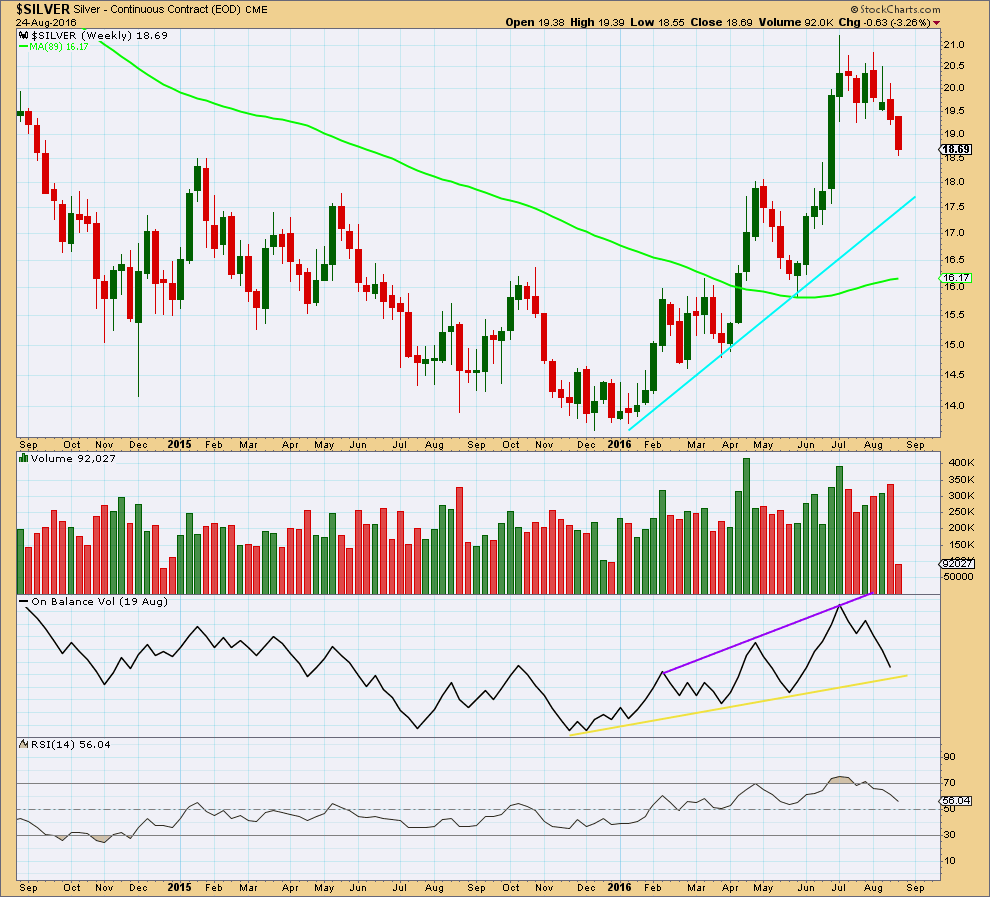
From the low in January, as price rises volume also rises and as price falls volume declines. The volume profile is bullish which supports the wave count.
A support line is added in cyan. If price again comes down to touch it, price should find strong support there.
On Balance Volume found resistance at the purple line and moved downwards from there, a bearish signal. OBV is very close now to the yellow line and should be expected to find support there. If it does, that would be a bullish signal. A break below the yellow line would be a bearish signal.
RSI is no longer overbought but does not exhibit divergence with price. There is no indication of weakness at the weekly chart level at this stage.
Last weekly candlestick again has a long upper wick, as does the week before. Both these candlesticks are bearish. The fall in price is supported by volume.
DAILY CHART
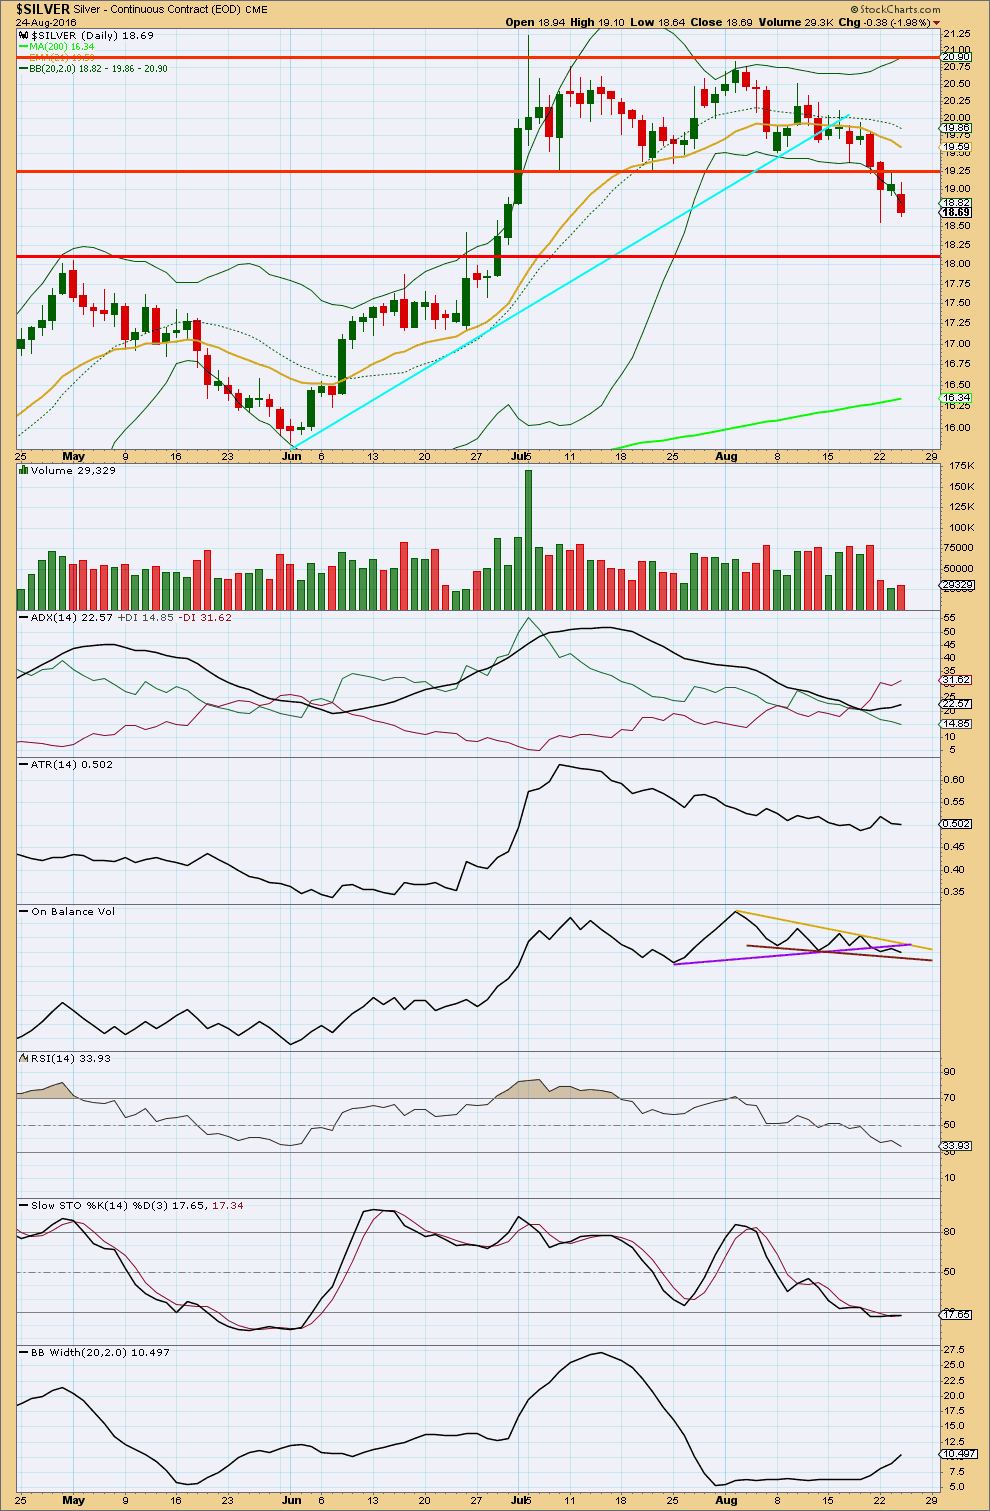
Click chart to enlarge. Chart courtesy of StockCharts.com.
Silver broke out downwards from its range on a day with increased volume. The downwards breakout was indicated by volume as most likely but was not given much weight in last analysis because it is not always a reliable method for Silver.
At the last low on 22nd of August the long lower wick is bullish. The last three days have light and overall declining volume, the downwards move may be exhausted already. If price continues lower, the next area for support would be about 18.10.
ADX is increasing, indicating there is now a downwards trend in place. ATR still overall disagrees as it is declining.
On Balance Volume gave a bearish signal for Silver with a break below the purple trend line, then a throwback to test that line. A new support line is added this week in brown. If OBV bounces up from this line, it would be a bullish signal. If it breaks through this line, that would be a bearish signal.
A break above the yellow line for OBV would be a strong bullish signal.
RSI is close to oversold, but it is not yet extreme. There is still room for price to fall. RSI today exhibits divergence with price: RSI has made a new low below the prior low of 22nd of August, but price has made a higher low. This divergence is bullish and indicates weakness in price. Divergence with price and RSI is often a fairly reliable indicator, and it is given weight in this analysis. This divergence supports the Elliott wave counts.
Stochastics is oversold, but this oscillator may remain extreme for reasonable periods of time during a trending market.
This analysis is published @ 11:11 p.m. EST.
Lara,
Following on your last Main Daily count, I offer what I believe to be a valid count for where we are with Silver. It suggests we still have to finish 2 more waves, minute iv and v before the bottom and finish for Minor C.
Good call Lara, downward movement was exhausted it did bounce up today.
Thank you Lara. I really appreciate you keeping up with regular silver counts. Curious to see when wave 3 will finally turn up.