
Last week’s analysis expected more downwards movement.
The Elliott wave count was invalidated with a new high above 44.43.
Summary: The Elliott wave count at this stage is unclear. With price now within a B wave within a fourth wave correction, the multiple structural possibilities mean it is impossible to tell with any level of confidence what price may do next from an Elliott wave point of view. Classic technical analysis shows weakness to this upwards movement. There is strong resistance about 46.50. Some downwards reaction may be expected about now.
New updates to this analysis are in bold
MONTHLY ELLIOTT WAVE COUNT
Click chart to enlarge.
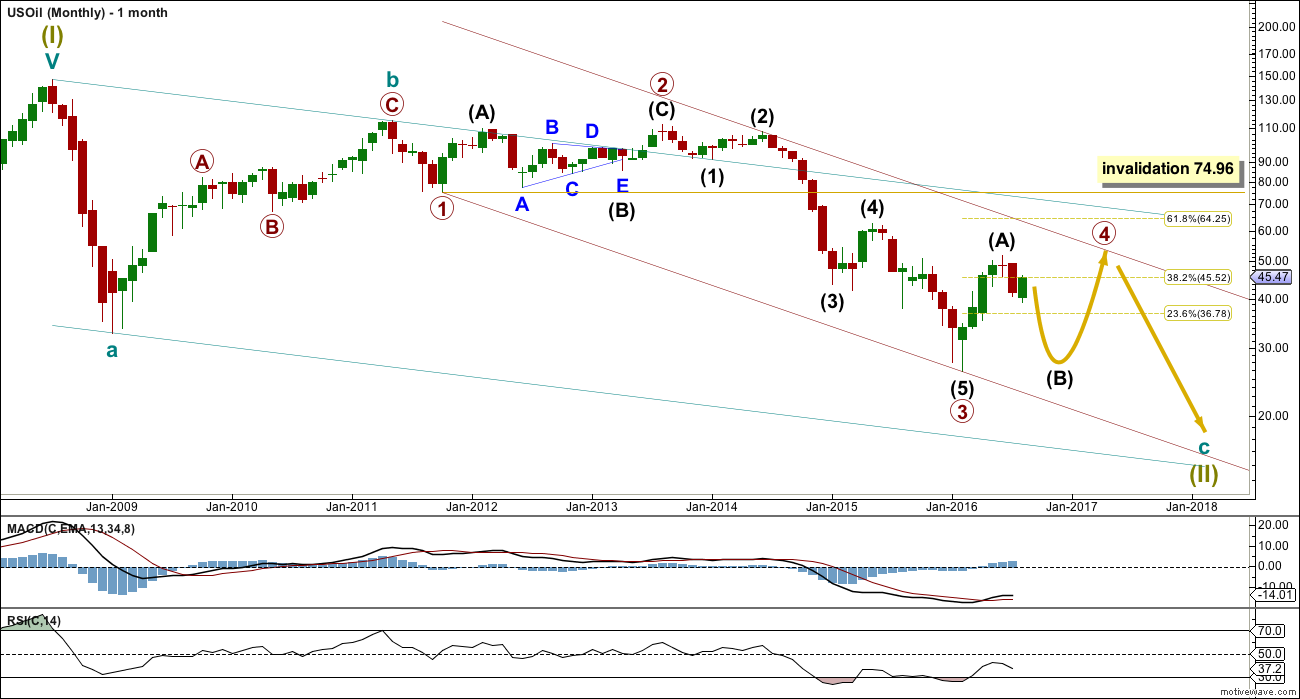
Within the bear market, cycle wave b is seen as ending in May 2011. Thereafter, a five wave structure downwards for cycle wave c begins.
Primary wave 1 is a short impulse lasting five months. Primary wave 2 is a very deep 0.94 zigzag lasting 22 months. Primary wave 3 is a complete impulse with no Fibonacci ratio to primary wave 1. It lasted 30 months.
Primary wave 4 is likely to exhibit alternation with primary wave 2. Primary wave 4 is most likely to be a flat, combination or triangle. Within all of these types of structures, the first movement subdivides as a three.
Primary wave 4 is likely to end within the price territory of the fourth wave of one lesser degree; intermediate wave (4) has its range from 42.03 to 62.58.
Primary wave 4 may end if price comes up to touch the upper edge of the maroon channel. The upper edge of this channel has been pushed up to sit on the end of intermediate wave (2) within primary wave 3.
Primary wave 4 is most likely to be shallow to exhibit alternation in depth with primary wave 2. So far it has passed the 0.382 Fibonacci ratio at 45.52. It may now move mostly sideways in a large range.
Primary wave 4 may not move into primary wave 1 price territory above 74.96.
DAILY ELLIOTT WAVE COUNT
Click chart to enlarge.
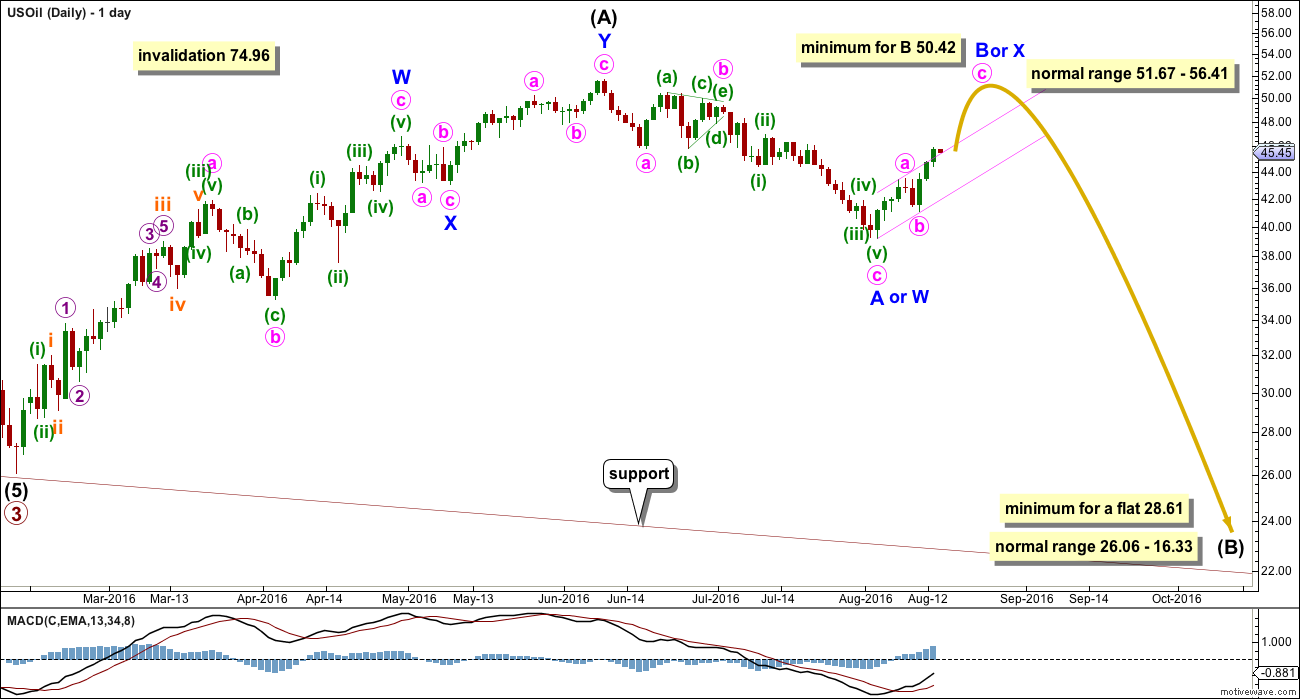
Intermediate wave (A) may be complete as a double zigzag.
If intermediate wave (A) is a three, then intermediate wave (B) is most likely to be a very deep correction. It may make a new low below the start of intermediate wave (A) at 26.06.
If primary wave 4 is to be a flat correction, then intermediate wave (B) must be a minimum 0.9 length of intermediate wave (A) at 28.61. The normal range for intermediate wave (B) would be 1 to 1.38 the length of intermediate wave (A) at 26.06 to 16.33.
If primary wave 4 is to be an expanded flat correction, then intermediate wave (B) should be 1.05 the length of intermediate wave (A) or longer, at 24.78.
If primary wave 4 is to be a triangle, then intermediate wave (B) has no minimum nor maximum. It must only subdivide as a three wave structure. It may make a new low below the start of intermediate wave (A) at 26.06 as in a running triangle.
Primary wave 4 may not move into primary wave 1 price territory above 74.96.
Intermediate wave (B) may be any of more than 23 possible corrective structures. It would most likely be a single or multiple zigzag in order to be a deep correction. It may also be an expanded flat to be deep. It may find support at the lower edge of the maroon channel.
So far intermediate wave (B) may be unfolding as either a double zigzag or an expanded flat.
If intermediate wave (B) is an expanded flat, then within it minor wave A may be a complete zigzag. Minor wave B would need to reach a minimum 0.9 length of minor wave A at 50.42. The normal range for minor wave B would be from 1 to 1.38 the length of minor wave A at 51.67 – 56.41. Within minor wave B, minute waves a and b may be complete. Within minute wave c, no second wave correction may move beyond the start of its first wave below 41.11.
A new low below 41.11 before a high above 50.42 would eliminate the flat correction for intermediate wave (B).
A double zigzag would be labeled minor waves W-X-Y. The first zigzag in the double for minor wave W would be complete. The double zigzag should be joined by a brief shallow three in the opposite direction labelled minor wave X. It is possible that minor wave X is over already. A new low below 41.11 before a high above 50.42 would indicate intermediate wave (B) as most likely a double zigzag.
The second zigzag in the double would be required to deepen the correction to 28.61 or below.
FIRST ALTERNATE DAILY ELLIOTT WAVE COUNT
Click chart to enlarge.
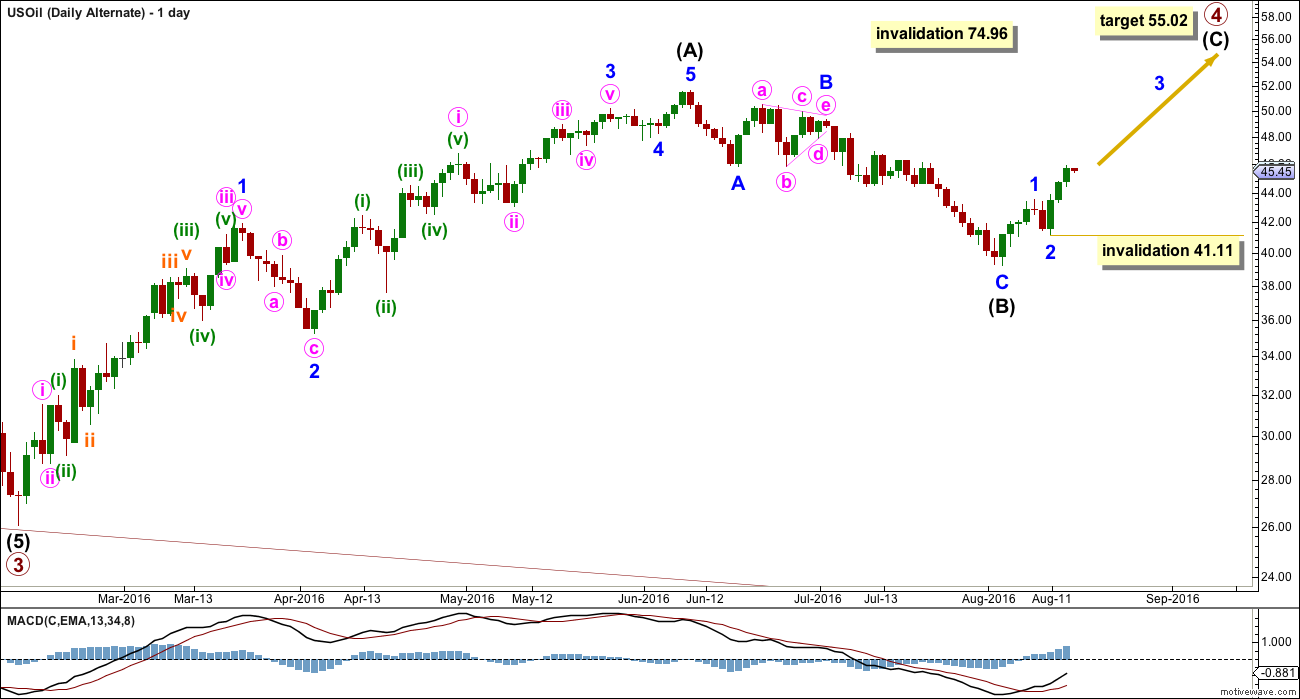
Primary wave 4 may be unfolding as a zigzag. This wave count is possible, and all possibilities must be considered, but because it would see no alternation in structure with the zigzag of intermediate wave (2) it has a lower probability than the main wave count.
Intermediate wave (C) must subdivide as a five wave structure. So far within intermediate wave (C), minor waves 1 and 2 would be complete. Within minor wave 3, no second wave correction may move beyond the start of its first wave below 41.11.
This wave count looks forced mostly because the triangle of minor wave B or minute wave b does not look right. It comes to too quick an end and the trend lines are too steep for a normal look. But it remains valid because no Elliott wave rules are broken and all guidelines are reasonably met.
SECOND ALTERNATE DAILY ELLIOTT WAVE COUNT
Click chart to enlarge.
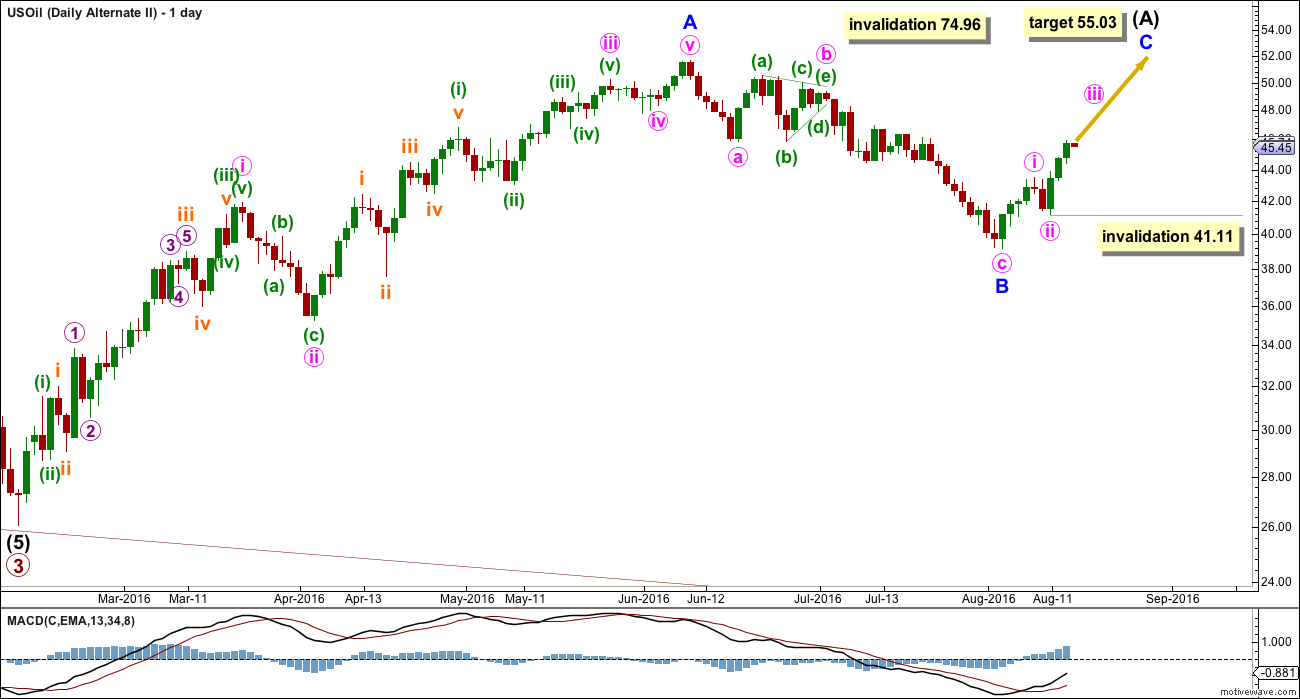
This wave count is the same as the first alternate but the degree of labelling within the correction so far is moved down one degree.
It may be more likely (than the first alternate) that a zigzag is completing for intermediate wave (A) within primary wave 4.
This may be a zigzag for intermediate wave (A) within a larger flat or triangle for primary wave 4.
Within minor wave C, minute waves i and ii may be complete. Within minute wave iii, no second wave correction may move beyond the start of the first wave below 41.11.
At 55.03 minor wave C would reach 0.618 the length of minor wave A.
Primary wave 4 may not move into primary wave 1 price territory above 74.96.
TECHNICAL ANALYSIS
DAILY CHART
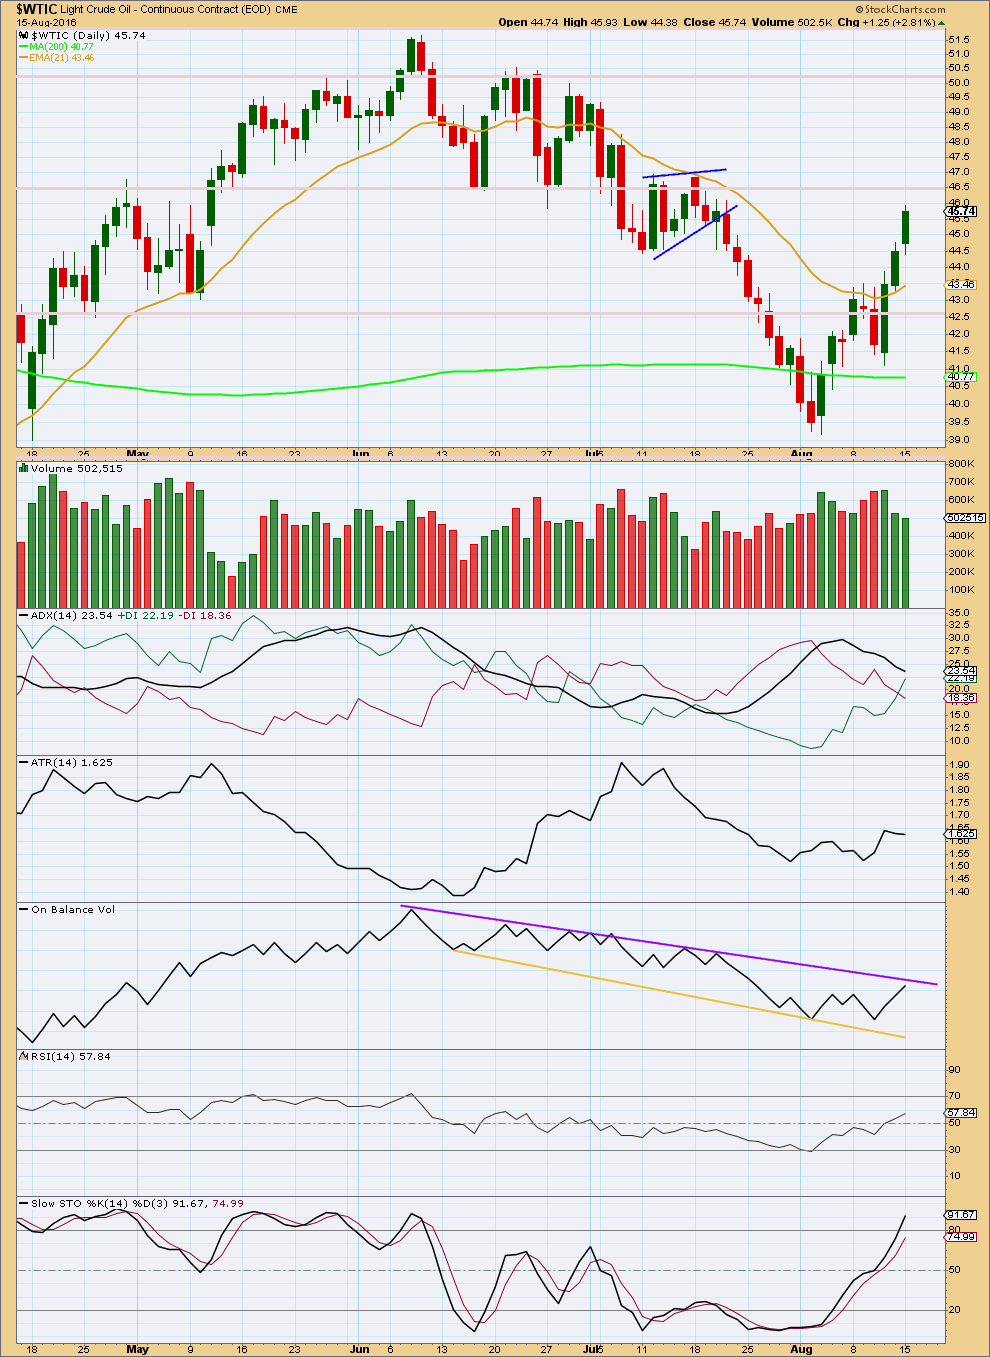
Click chart to enlarge. Chart courtesy of StockCharts.com.
The last three green daily candlesticks complete an advance block pattern. This indicates weakening in upwards movement. Longs should be protected or liquidated. This is not necessarily a reversal pattern, it just indicates weakness to upwards movement. The weakness of this pattern is reinforced with volume declining for the last two days in a row.
ADX is declining, indicating the market is not currently trending. It has indicated a trend change two days ago as possible, but the black ADX line has not begun to increase, so a trend change is not confirmed.
After some increase ATR is also now beginning to decline again. There is weakness to this last upwards movement.
On Balance Volume may find resistance about the purple trend line. A clear break above this line would be a bullish signal. With resistance expected here, this may hold down the rise in price and a downwards reaction may unfold about here.
RSI is just above neutral. There is room for price to rise or fall.
Stochastics is just entering overbought territory. There is further room for price to rise before Stochastics may indicate the end to this upwards swing.
There is strong resistance about 46.50.
This analysis is published @ 03:19 a.m. EST.
Kimble sees bullish patterns on oil and stocks
Kilroy was here.
Thanks Dreamer. I missed that!
He is not the only one.