
A little more downwards movement was expected for Monday to a small target zone at 1,319 – 1,322.
The low for Monday is at 1,320.94, right in the target zone.
Summary: Price should turn upwards as an upwards trend develops. Range and volatility are expected to increase. The long term target remains at 1,585. The volume profile remains bullish and supports the Elliott wave count.
New updates to this analysis are in bold.
Last weekly charts are here.
Grand SuperCycle analysis is here.
DAILY ELLIOTT WAVE COUNT
Click chart to enlarge.
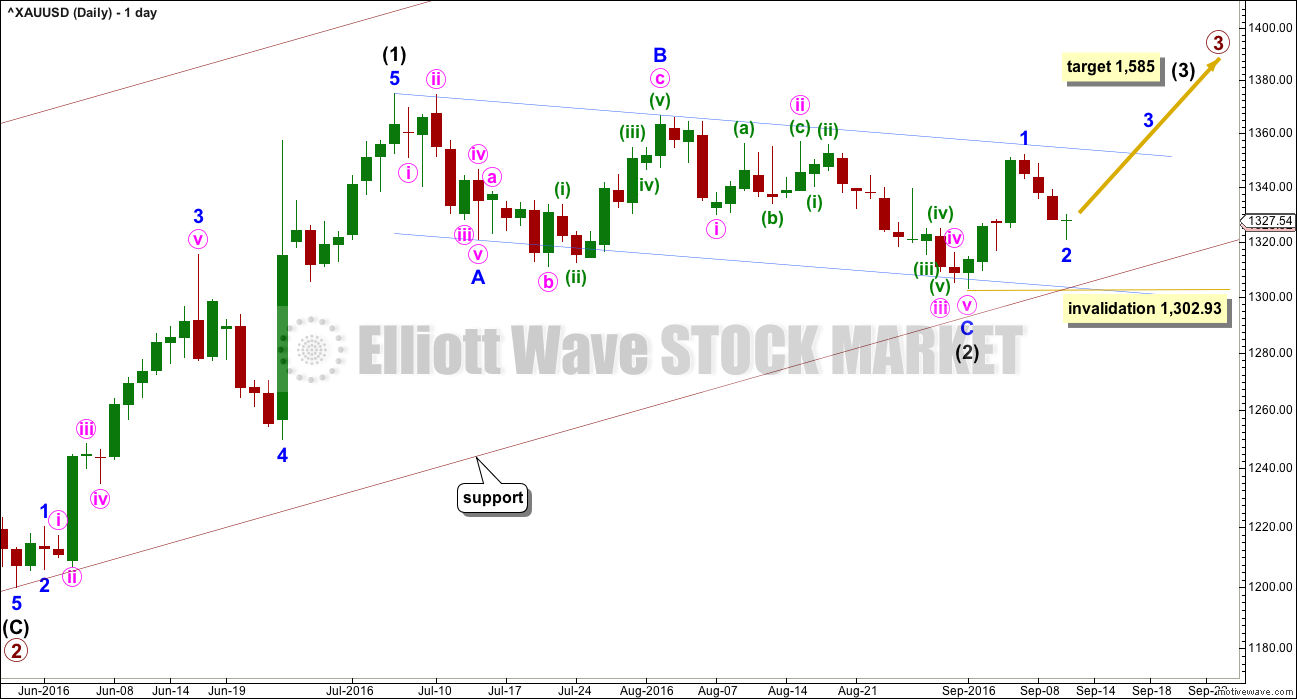
Primary waves 1 and 2 are complete. Thereafter, this wave count differs from the alternate.
This main wave count will expect primary wave 3 to be longer than primary wave 1. Because this is very common, this is the main wave count. It expects the most common scenario is most likely. At 1,585 intermediate wave (3) would reach 1.618 the length of intermediate wave (1).
Intermediate wave (2) may now be complete ending just below the 0.382 Fibonacci ratio of intermediate wave (1) and lasting 40 days. Within intermediate wave (3), minor wave 2 may not move beyond the start of minor wave 1 below 1,302.93.
Draw a channel about intermediate wave (2) using Elliott’s technique for a correction (blue lines). Price is finding some resistance on the way up about the upper edge. After breaking through resistance at the upper blue line price may then turn down to find support about there.
With this wave count expecting a third wave at two large degrees to begin, look out for surprises to the upside at this stage.
Intermediate wave (1) lasted 27 days and intermediate wave (2) lasted 40 days. Intermediate wave (3) may be reasonably expected to last longer than intermediate wave (1) in both time and price. A Fibonacci 55 days would be a first expectation.
HOURLY ELLIOTT WAVE COUNT
Click chart to enlarge.
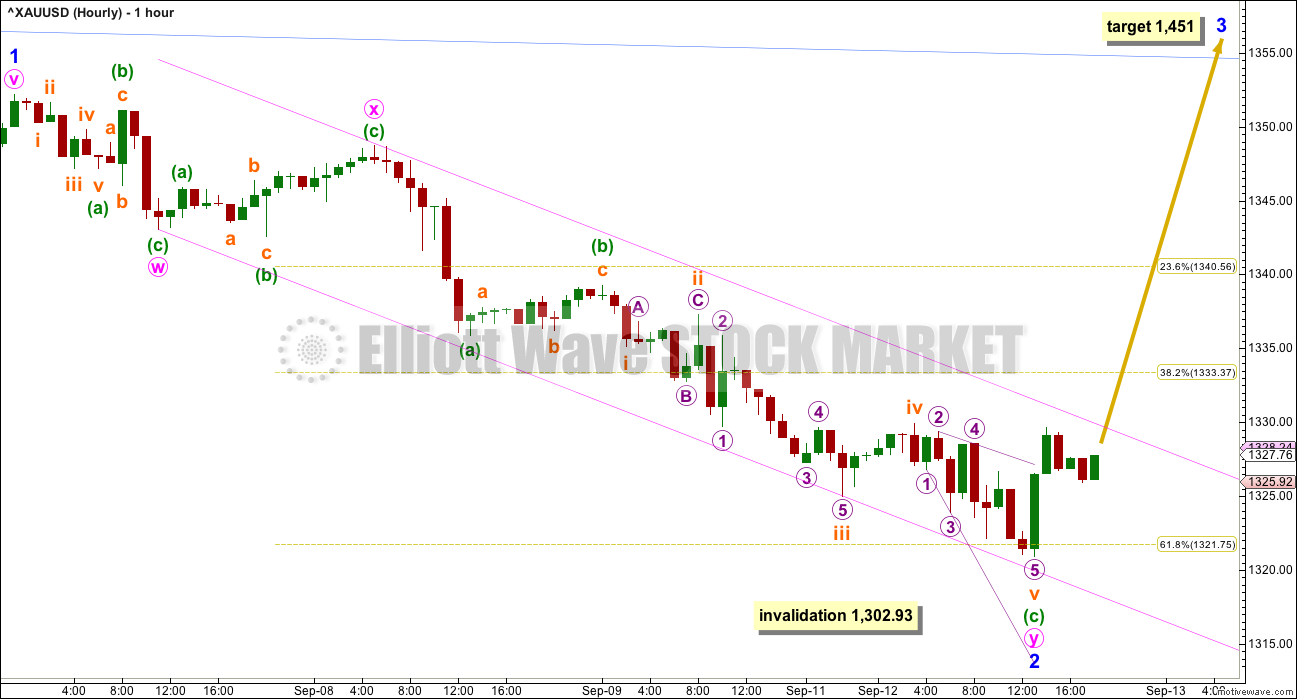
The structure of minor wave 2 is now a complete double zigzag ending just very slightly below the 0.618 Fibonacci ratio of minor wave 1. This is the most common depth for a second wave, and one of the most common structures. This wave count follows a very common scenario.
Within the first zigzag of the double, minuette wave (c) is just 0.09 short of 1.618 the length of minuette wave (a).
Within the second zigzag of the double, minuette wave (c) has no Fibonacci ratio to minuette wave (a).
The pink best fit channel is slightly adjusted. While price remains within it the risk that minor wave 2 may continue lower must be accepted. If it does continue lower, it may not move beyond the start of minor wave 1 below 1,302.93.
At 1,451 minor wave 3 would reach 2.618 the length of minor wave 1. Minor wave 3 may only subdivide as a simple impulse.
There will be more pullbacks along the way up. The next pullback to show up on the daily chart would be minute wave ii. First, another five up for minute wave i must complete, which may last two to three days and may reasonably be expected to move above the end of minor wave 1 at 1,352.18.
When the best fit channel is breached by clear upwards (not sideways) movement, then the invalidation point at the hourly chart level may be moved up to the end of minor wave 2 at 1,320.94.
ALTERNATE DAILY ELLIOTT WAVE COUNT
Click chart to enlarge.
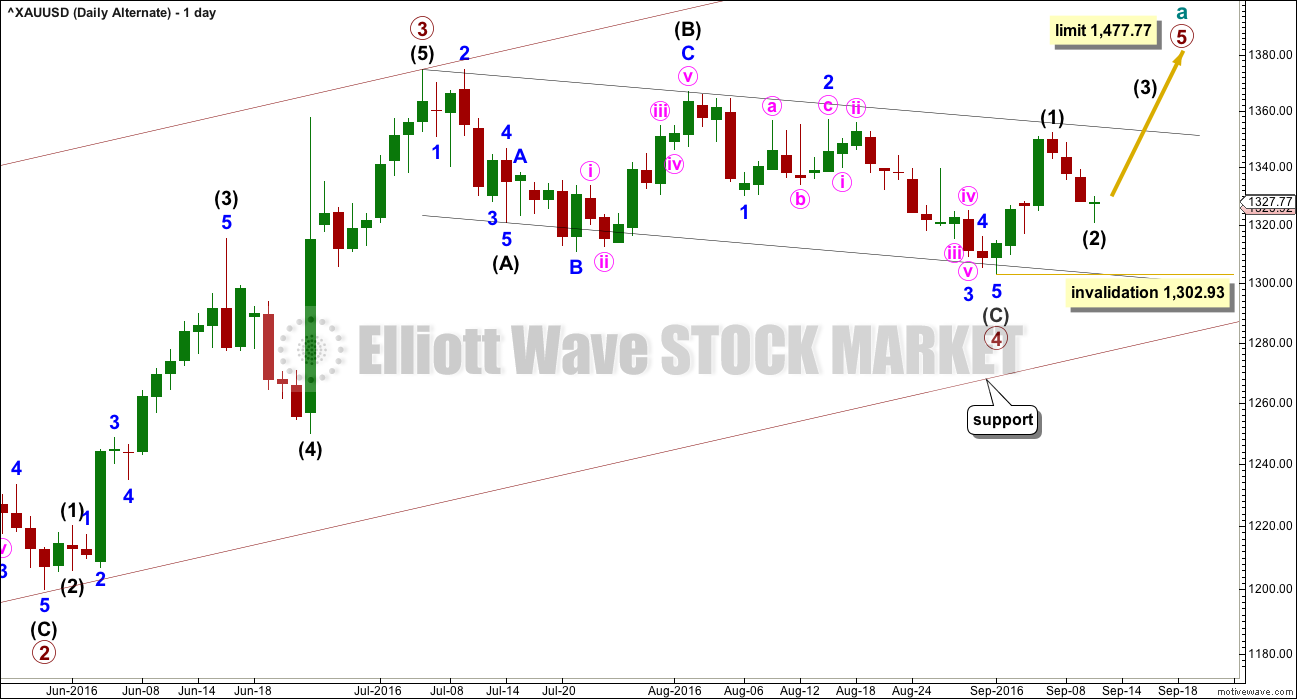
It is possible that primary wave 3 is over and shorter than primary wave 1. Primary wave 3 shows stronger volume than primary wave 1 (see technical analysis weekly chart).
If primary wave 3 is over, then the current consolidation for Gold would be primary wave 4.
Primary wave 2 was a relatively shallow 0.35 expanded flat correction. Primary wave 4 may be a deeper zigzag which would exhibit perfect alternation.
Within primary wave 5, no second wave correction may move beyond the start of its first wave below 1,302.93.
Primary wave 5 would be limited to no longer than equality in length with primary wave 3, so that the core Elliott wave rule stating a third wave may not be the shortest is met. Primary wave 5 would have a limit at 1,477.77.
The hourly chart would be exactly the same.
TECHNICAL ANALYSIS
WEEKLY CHART
Click chart to enlarge. Chart courtesy of StockCharts.com.
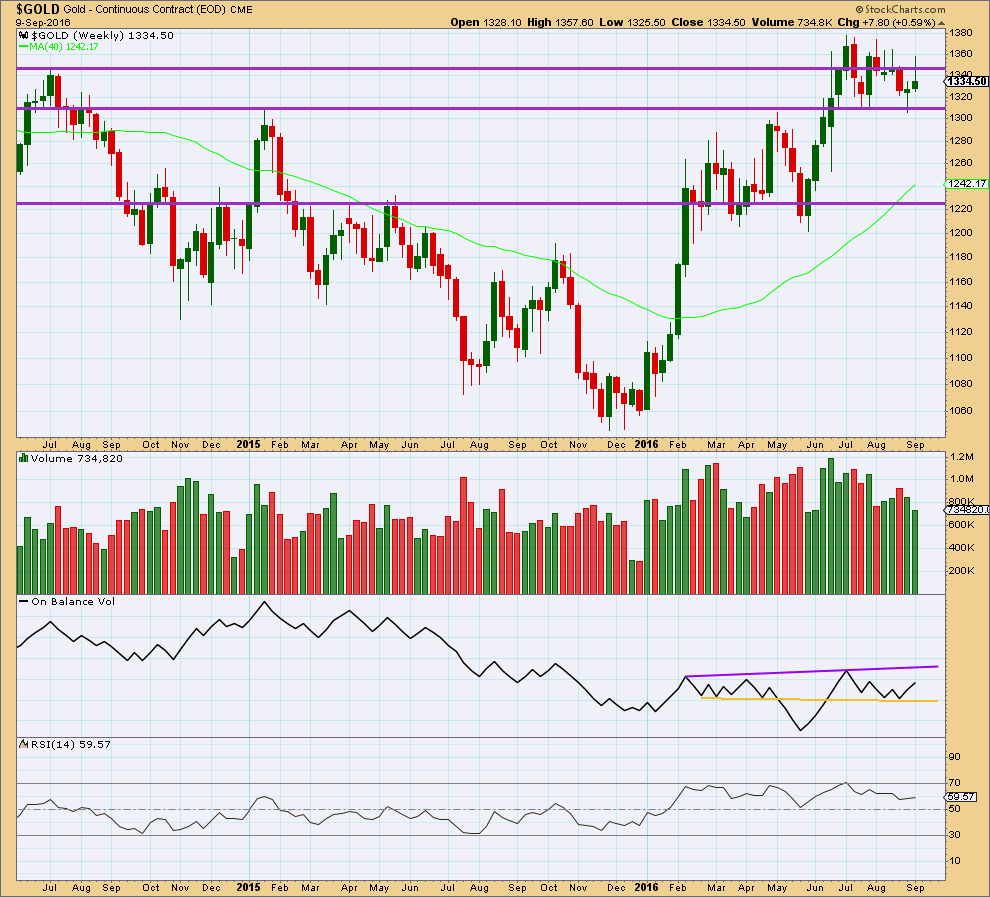
Last week moved price reasonably higher, but as yet now a new high above 1st August or 5th July has been made. The green candlestick colour is bullish, but the long upper wick is bearish. The decline in volume for an overall upwards week is bearish, but to understand what is exactly happening in terms of volume it needs to be looked inside at daily volume bars.
On Balance Volume remains bullish with an upwards move further away from the yellow support line.
RSI is still not extreme. There is room for price to rise or fall.
DAILY CHART
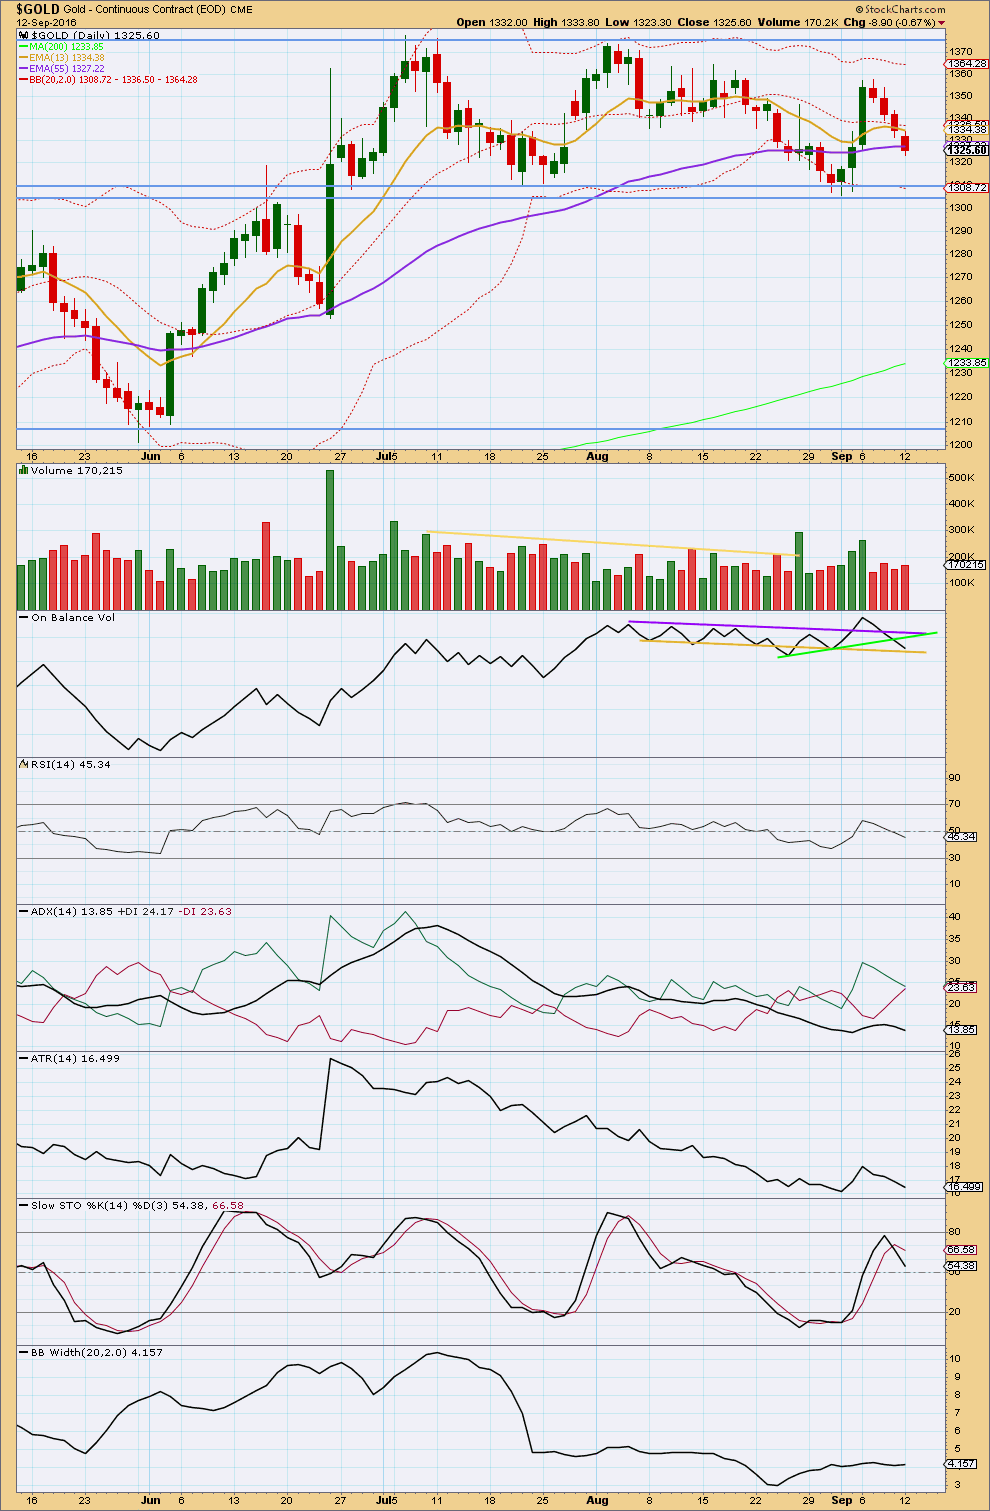
Click chart to enlarge. Chart courtesy of StockCharts.com.
Another downwards day comes again with relatively light volume compared to prior upwards days. Although Monday’s session has a small increase in volume over Friday, it is still lighter than the day before of 8th September. Overall, the volume profile short term is still clearly bullish. The fall in price has little support from volume.
Price may find some support here about the 55 day moving average.
Gold remains range bound. The sideways consolidation began back on 7th of July. It is now three upwards days of 8th of July, 26th of August, and 6th of September that have strongest volume. The signal is clear. Gold is more likely to break out of this consolidation upwards than downwards. Resistance is about 1,375 and support about 1,305.
The shortest moving average, a Fibonacci 13, is pointing lower but remains above both the mid term and long term moving averages. The Fibonacci 55 day moving average is now flat, but the long term 200 day moving average is still pointing upwards. The larger trend remains up.
On Balance Volume did not find support at the short term green trend line. It may now find support at the yellow trend line. This line is more technically significant as it is longer held and almost horizontal, so it offers more strength.
RSI is now just below neutral. There is plenty of room for price to rise or fall. There is no divergence today between price and RSI to indicate weakness.
ADX is declining indicating the market is not currently trending. The +DX line is now almost touching the -DX line. A cross over would indicate a potential trend change, but the black ADX line must increase also to indicate a downwards trend.
ATR is also declining for four days in a row now. Range for the last four days is very clearly smaller than prior upwards days. This strongly suggests that this downwards movement is a counter trend pullback and not the start of a new downwards trend.
Stochastics did not manage to reach overbought at the last high.
Bollinger Bands are still tightly contracted. This also supports the idea that the last four days downwards movement is a counter trend movement and not the start of a new trend.
This analysis is published @ 07:05 p.m. EST.
I think I have had the correction labelled wrong. With another wave down it will now fit as a single zigzag.
Price is now coming to touch the lower edge of the Elliott channel about this zigzag. That may be where it ends.
Right now the only thing that isn’t in a loss is gas, sugar, US bonds, T-bills and US dollar.
http://www.gannglobal.com/webinar/2016/August/16-08-Video13-2ndChance.php?inf_contact_key=c3a58d21ccf44876cc270451e1a474e7d9fc18c87c3a6a1043f82a174e490758
Gann Global….another perspective suggesting that Gold’s correction may Not be complete. About 15min. video. Crude 1st half, Gold- 2nd half.
I bought a little NUGT but it dropped to month low of $17.69 at 1:04 pm then moved up a little where I used my 5 multi trend indicators set up to sell a little under break even before it dropped again. Next time I’ll buy on an up trend safer.
Alan says there may be one more small 5th wave gold drop to first target at $1,318.99.
Richard. That’s true. I normally wait for the first two waves in an uptrend to complete before buying. Call it prudence if you like but it beats agonising over being shorted out (and losing money).
Good strategy thanks Alan.
Oil dropped and took market and gold and miners with it.
US dollar has been moving up since Monday noon.
Another sell miners at the morning high, seems to be a frequent pattern.
Gold dropped below Monday’s low and NUGT drops to the low since September 1st
1:27pm Stocks sell off as retreating oil, Fed worries, dog market.
I don’t really like the action in GDX today, but the bull case is still valid above 25.17. That said, GDX should really turn up now as we are at trend line support at the recent low around 25.73. The bottom may now be in, but too soon to tell. The move down from September 7 could now be a double zigzag.
The bane of the 3-wave combination 4th wave is upon us again. Yesterday’s low was not the low.
Instead, subminuette 4 was an expanded flat. The labelling of subminuette 4 by Lara was actually w, subminuette 5 was x, and subminuette 4 ended at the high of 1332.10.
Subminuette 5 is a nice 5-wave impulse down. The 5th wave of the fifth is not done yet. There is one last drop from now. My first target is 1318.99, where subminuette 5 = subminuette 3.
I for one couldn’t foresee this yesterday.
Wow. It shot past my first target without batting an eyelid. My worst case scenario is 1313.26, in which Minor 2 = 0.786 Minor 1. Counting down to submicro 5 level, the 5th wave appears to be targeting that vicinity.
It’s going to be another of those recurring situations in which wave 2 = 0.786 wave 1. I’ve encountered it so many times in the past one or two weeks. It’s fast becoming the norm!
Based on gold’s price action, Minor Wave 2 is continuing… reached lower than 1320.94.
Now, the big question is when will Minor Wave 3 begin? Any thoughts… Alan – You’re really good at the intraday wave counts and expectations. Gold looks to be hovering around the fib ratio; 1321.75.
Invalidation remains 1302.93; Minor Wave 2 can’t go below Minor Wave 1.
I reckon we are going retest bull flag (on daily) lower trend line around c.1290, this correction isn’t finished, too weak in the pushes.
Sorry Stephen K, didn’t see your post. I’ve posted as above.
No problem… As always, thanks for your input and to the many others that offer their thoughts and comments.
The sell at the morning high has been a good idea for quite a few days.
Gold and miners both almost retraced their gains as almost dropped to Monday’s lows.
It surprising such a big drop in gold and miners after Monday strong day up.
Many time frames in a bearish position because gold has been dropping since the 1332.10 overnight high at 10:25 pm.
2nd chart showing Wkly cycles of US Dollar– Cyclesman.net
Oil is down and so are stocks and putting pressure on gold.
Dow tumbles more than 200 points as energy slumps – Sept 13, 2016 11:18 a.m. ET
Apple is the lone Dow component in the green
All the currencies are down except the US dollar
Hi Richard,
With your experience, who usually wins in a market environment that we have currently.
US Markets are bouncing around and when down, they bring GDX with them. However, gold is expected to rise based on Lara’s analysis. Should gold climb and the US markets continue to correct, will the miners find a way to rally?
Currently, the price of GDX (26.12) is near the stop referenced in Dreamer’s charts; 25.86.
Anyone else can offer their thoughts too.
Thanks!
Daily stop = 25.17
Thank you!
I read something today that is quite sobering. We all know that storing your PMs with a service that uses unallocated custody is risky. The notional value of these “contracts” is estimated to be over 150 times the amount of Gold actually in existence. A lot of people who think they own the metal are never going to be able to take delivery. There are now some troubling reports that custodians who are supposed to be using an allocated form of storing the PMs are not actually doing so. It may be smart to do an occasional “dry run” and have some of you metals delivered. While many of these companies have written into their agreements provisions that allow them as many as 30 days to complete a delivery, if you cannot get you hands on your metals in 72 hours after lodging a formal request that could be a red flag. I am seriously considering a format that allows me direct access without permission of the storage custodian but retains the option to request delivery if that is preferred. Of course this means one would have to travel to the location. There are a few places in Hong Kong that allow this. Things are going to get very dicey in the coming financial storm so make sure you watch your six…
Excellent point. There was a report lately on zerohedge coming out of Europe concerning delivery “failure”:
http://www.zerohedge.com/news/2016-08-31/deutsche-bank-refuses-delivery-physical-gold-upon-demand
This was supposedly allocated storage with guaranteed delivery options. I read another account of something like it at a US based bank with allocated storage. They made the account holder jump through a long series of hoops, one after the other, for a total delay of about a month, and finally adding on a fee not specified in the original agreement. I don’t remember whether he ended up actually getting delivery.
Melanie and other $USD watchers,
$USD seems to be wedging to a decision. I would think that this would break down soon to support the move up in gold. I know Lara expects a 5th wave up in the $USD, but there’s plenty of room in the near term for it to go lower first. We’ll see.
Here’s the weekly look. I know gold doesn’t always move inverse to the $USD, but that seems to be the path of least resistance. A move like what is shown here would likely support the current gold count well.
Dreamer,
Thank you for your informative charts.
If USD were to break down from this wedge to the high to mid 80s, couldn’t you say that based on Lara’s count that wave (4) of Primary 3 would have ‘the wrong look’ as Lara would say (too extended) compared to (2) of Prime 3? Then the entire count might be in question?
Lara places (3) as coming in during December 2015 on FXMC USdollar chart.
EWI- Hochberg places (3) coming in January 2015 @ 100.39 on DXC5- futures chart (a chart Lara will not use to analyze EW), almost a year earlier which would cause an even more extended look if perhaps (4) of Prime 3 is Not over and breaks down.
Though the Dec 2015 peak is slightly higher @ 100.51 on DXC5, Hochberg labels it as Minor B of (4), while Lara labels this peak as (3).
Hochberg’s (4) runs about 16mos. Lara’s is much shorter, 4+mos.
I have not subscribed to Tim Wood, Cyclesman since March of 2016, but he did call the most recent 4yr cycle low in the US Dollar, May 2014. (Tim’s 4yr cycle actually has been running 36-39mos, rather than 4 for the last several cycles which he notes.). Based a chart of Tim’s I saved, looks like the 4yr cycle may have peaked about Dec 2015 at about 19mos. That would make end August 2016 approx. 27th mo., meaning that UNLESS Tim has Changed his thinking, your wedge thought ‘holds water’ in that the 4yr low time wise may not have come in. That said, cycles Can come in earlier/later than expected.
I’m attaching a few charts from Tim’s (Cyclesman.net) Feb 2016 research letter. I need to touch base w/Tim, (and his friend, Peter Eliades) to see if their thinking has changed.
On Avi Gilburt’s charts, I thought exactly the same thing about Avi’s Gold count when I reviewed the video, but I do think it is important to look at varying interpretations.
Dreamer,
Thank you for your efforts! For a comparison you and others may wish to take a look at this video published Sept 08 on You Tube by Elliottwavetrader.net.
https://www.youtube.com/watch?v=wn5bbmLUR1k&feature=youtu.be
@ minute 46-47 Garrett begins to discuss and show counts on the metals, Gold 1st.
@ minute 58-59, he discusses GDX
Melanie, thanks for the link. They have a very bullish view of gold long term since they are calling the January low a “wave 2”. I know that Lara has looked at Avi’s work in the past and found some rule violations. That said, its always good to review other ideas.
Just for fun, I captured a picture of the 5 min GDX chart he was examining from last week. His thoughts at the time mirrored mine in that it looked like we were in a small wave 4, but the correction morphed into a much bigger decline. I added the actual path that GDX took and the labels for that Minor wave 1 up that look to be correct. EW is tricky and you have to be open to all possibilities.
Gold may already be breaking out and back-testing a small inverted H&S pattern on the hourly chart. This projects a target of 1,340 which is near the recent downtrend line. Some resistance should be expected there. A break above the downtrend line would really help the bull case.
The technical look for GDX is not yet bullish:
> Need to see RSI break back above 50
> Need to see the downtrend line break to the upside
> Need to see stronger upside volume
> Need to see OBV break back above resistance
Dreamer, thank you again very much for your updated GDX analysis.
Most excellent 🙂
Thank you Lara. Your feedback is appreciated!
Another pattern for GDX. Possible inverted H&S pattern projects to 32. Very close to the Minor 3 target. Interesting…
Possible hourly look for GDX
Updated daily GDX main count
Awesome Dreamer, the deluxe analysis package on GDX, thank you.
Thanks Richard. Hopefully it’s helpful.