
Upwards movement was expected for Tuesday’s session but did not happen.
Price moved lower but remains above the invalidation point.
Summary: Price should turn upwards as an upwards trend develops. Range and volatility are expected to increase. The long term target remains at 1,585. The volume profile remains bullish and supports the Elliott wave count.
New updates to this analysis are in bold.
Last weekly charts are here.
Grand SuperCycle analysis is here.
DAILY ELLIOTT WAVE COUNT
Click chart to enlarge.
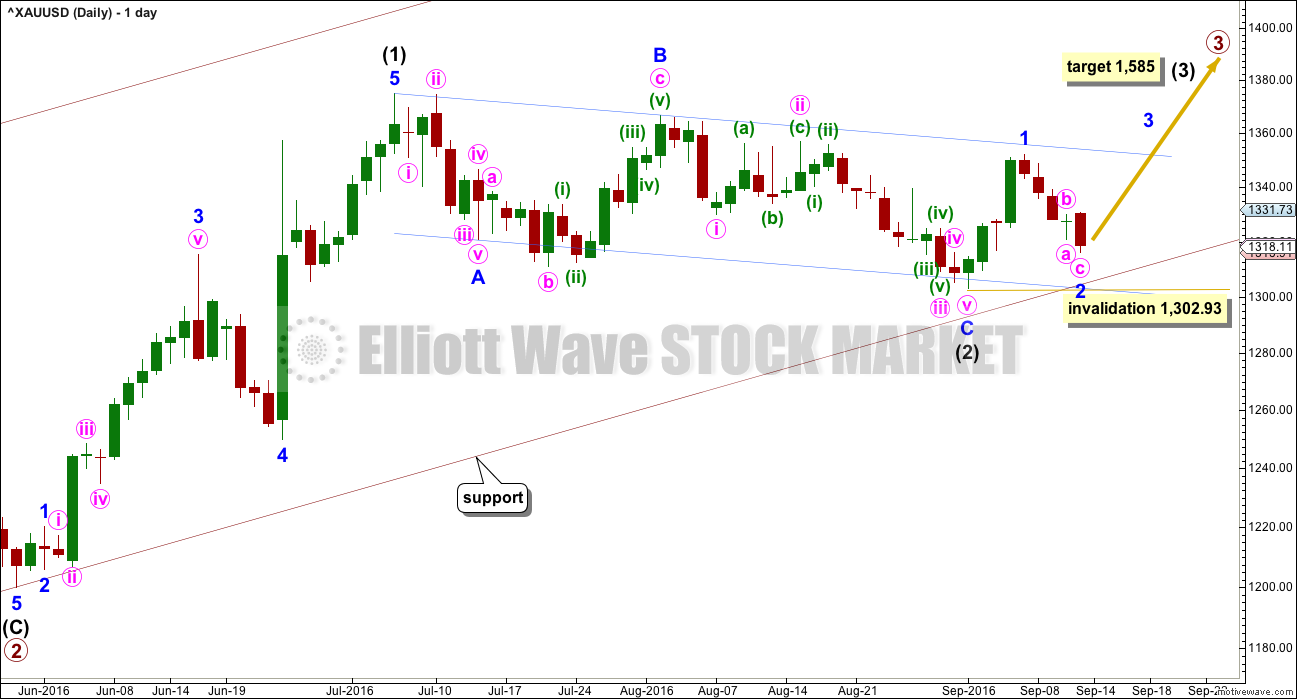
Primary waves 1 and 2 are complete. Thereafter, this wave count differs from the alternate.
This main wave count will expect primary wave 3 to be longer than primary wave 1. Because this is very common, this is the main wave count. It expects the most common scenario is most likely. At 1,585 intermediate wave (3) would reach 1.618 the length of intermediate wave (1).
Intermediate wave (2) may now be complete ending just below the 0.382 Fibonacci ratio of intermediate wave (1) and lasting 40 days. Within intermediate wave (3), minor wave 2 may not move beyond the start of minor wave 1 below 1,302.93.
Draw a channel about intermediate wave (2) using Elliott’s technique for a correction (blue lines). Price is finding some resistance on the way up about the upper edge. After breaking through resistance at the upper blue line price may then turn down to find support about there.
With this wave count expecting a third wave at two large degrees to begin, look out for surprises to the upside at this stage.
Intermediate wave (1) lasted 27 days and intermediate wave (2) lasted 40 days. Intermediate wave (3) may be reasonably expected to last longer than intermediate wave (1) in both time and price. A Fibonacci 55 days would be a first expectation.
HOURLY ELLIOTT WAVE COUNT
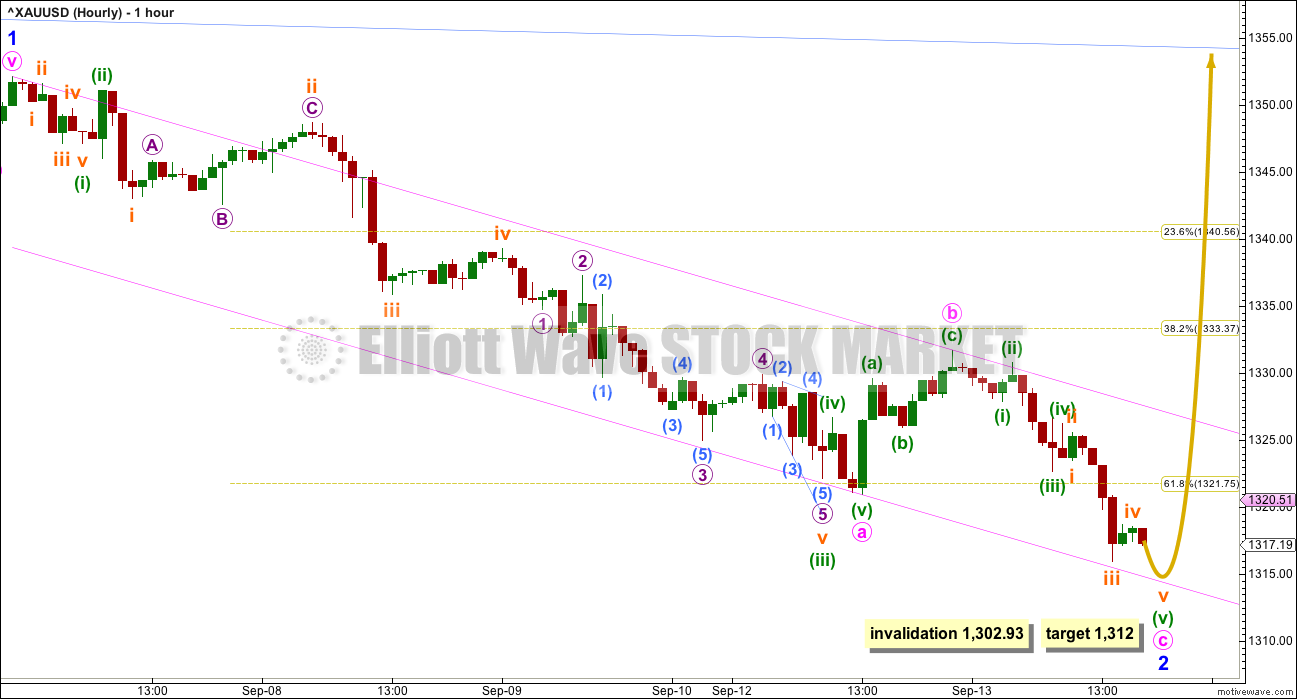
Click chart to enlarge.
With price moving lower, the double zigzag no longer has a good fit and does not look right. A single zigzag may now be either complete or very close to completion.
At the daily chart level, the green doji for 12th of September now gives minor wave 2 a clearer three wave look.
At 1,312 minute wave c would reach 0.618 the length of minute wave a. Price is now very close to the lower edge of the Elliott channel drawn about this zigzag. If it touches the lower edge, that may provide enough support to halt the fall in price. The lower edge of the maroon channel on the daily chart should also provide support before the invalidation point is reached.
Minor wave 2 may not move beyond the start of minor wave 1 below 1,302.93.
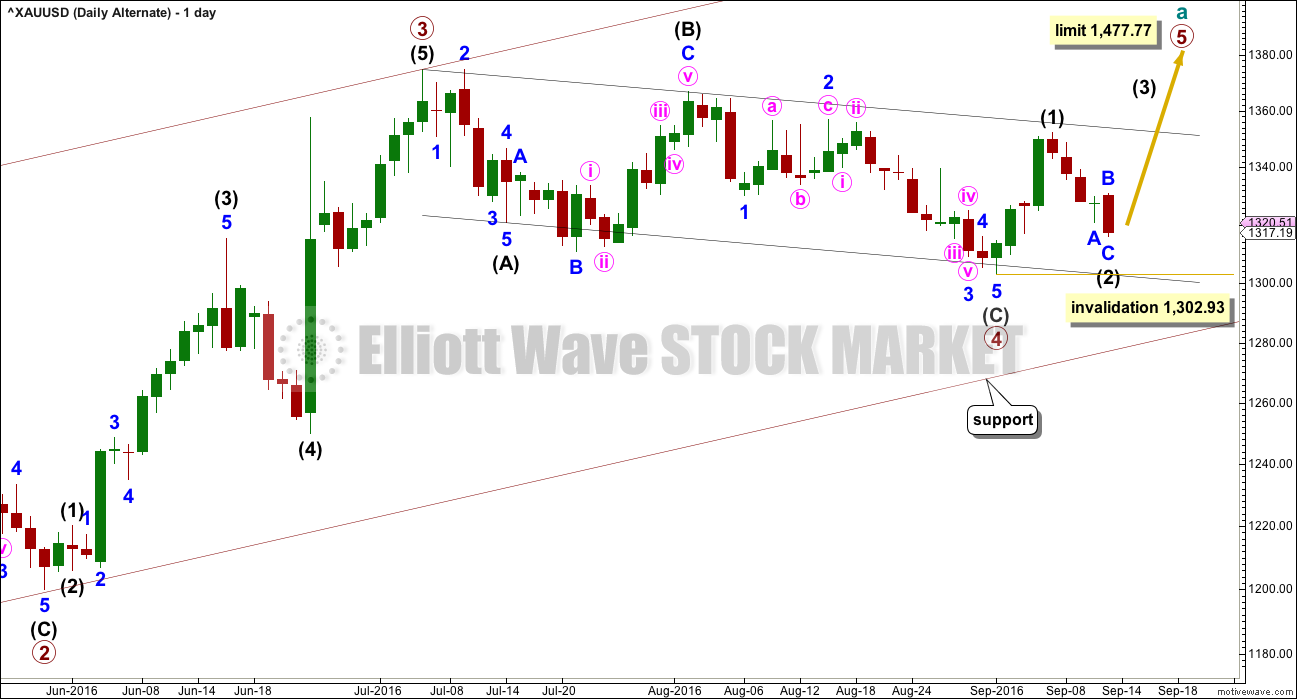
ALTERNATE DAILY ELLIOTT WAVE COUNT
Click chart to enlarge.
It is possible that primary wave 3 is over and shorter than primary wave 1. Primary wave 3 shows stronger volume than primary wave 1 (see technical analysis weekly chart).
If primary wave 3 is over, then the current consolidation for Gold would be primary wave 4.
Primary wave 2 was a relatively shallow 0.35 expanded flat correction. Primary wave 4 may be a deeper zigzag which would exhibit perfect alternation.
Within primary wave 5, no second wave correction may move beyond the start of its first wave below 1,302.93.
Primary wave 5 would be limited to no longer than equality in length with primary wave 3, so that the core Elliott wave rule stating a third wave may not be the shortest is met. Primary wave 5 would have a limit at 1,477.77.
The hourly chart would be exactly the same.
TECHNICAL ANALYSIS
WEEKLY CHART
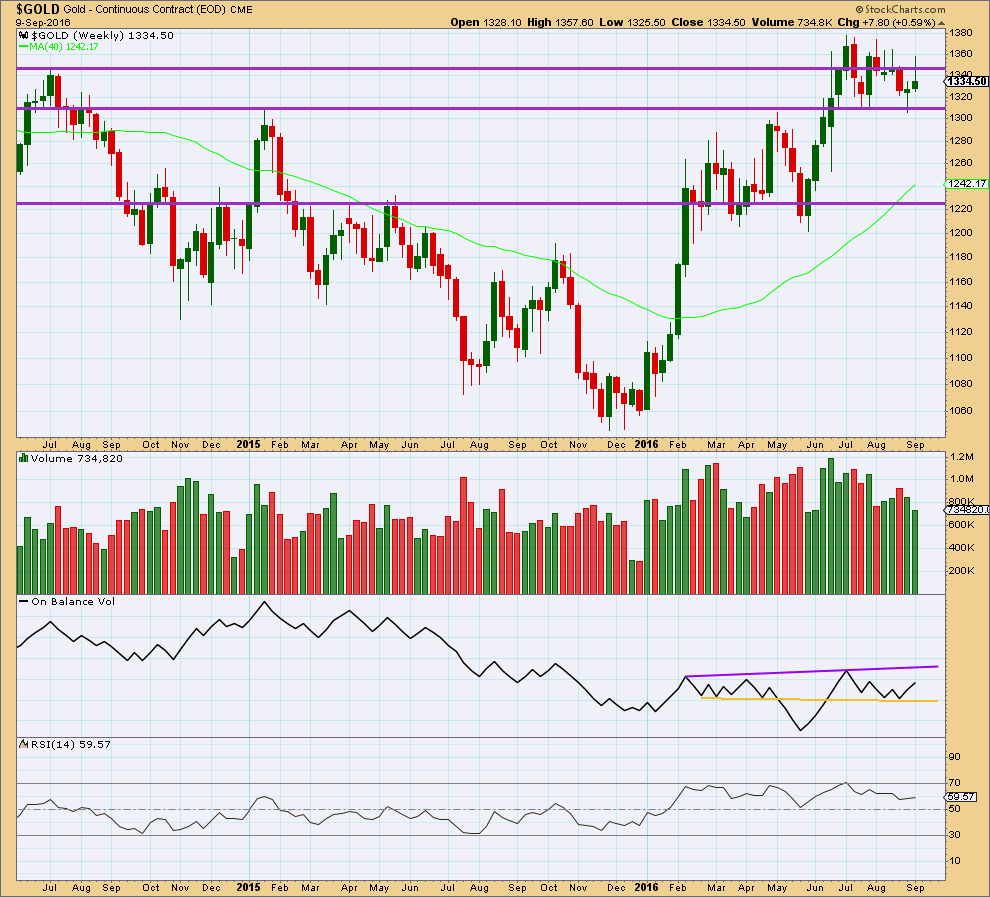
Click chart to enlarge. Chart courtesy of StockCharts.com.
Last week moved price reasonably higher, but as yet now a new high above 1st August or 5th July has been made. The green candlestick colour is bullish, but the long upper wick is bearish. The decline in volume for an overall upwards week is bearish, but to understand what is exactly happening in terms of volume it needs to be looked inside at daily volume bars.
On Balance Volume remains bullish with an upwards move further away from the yellow support line.
RSI is still not extreme. There is room for price to rise or fall.
DAILY CHART
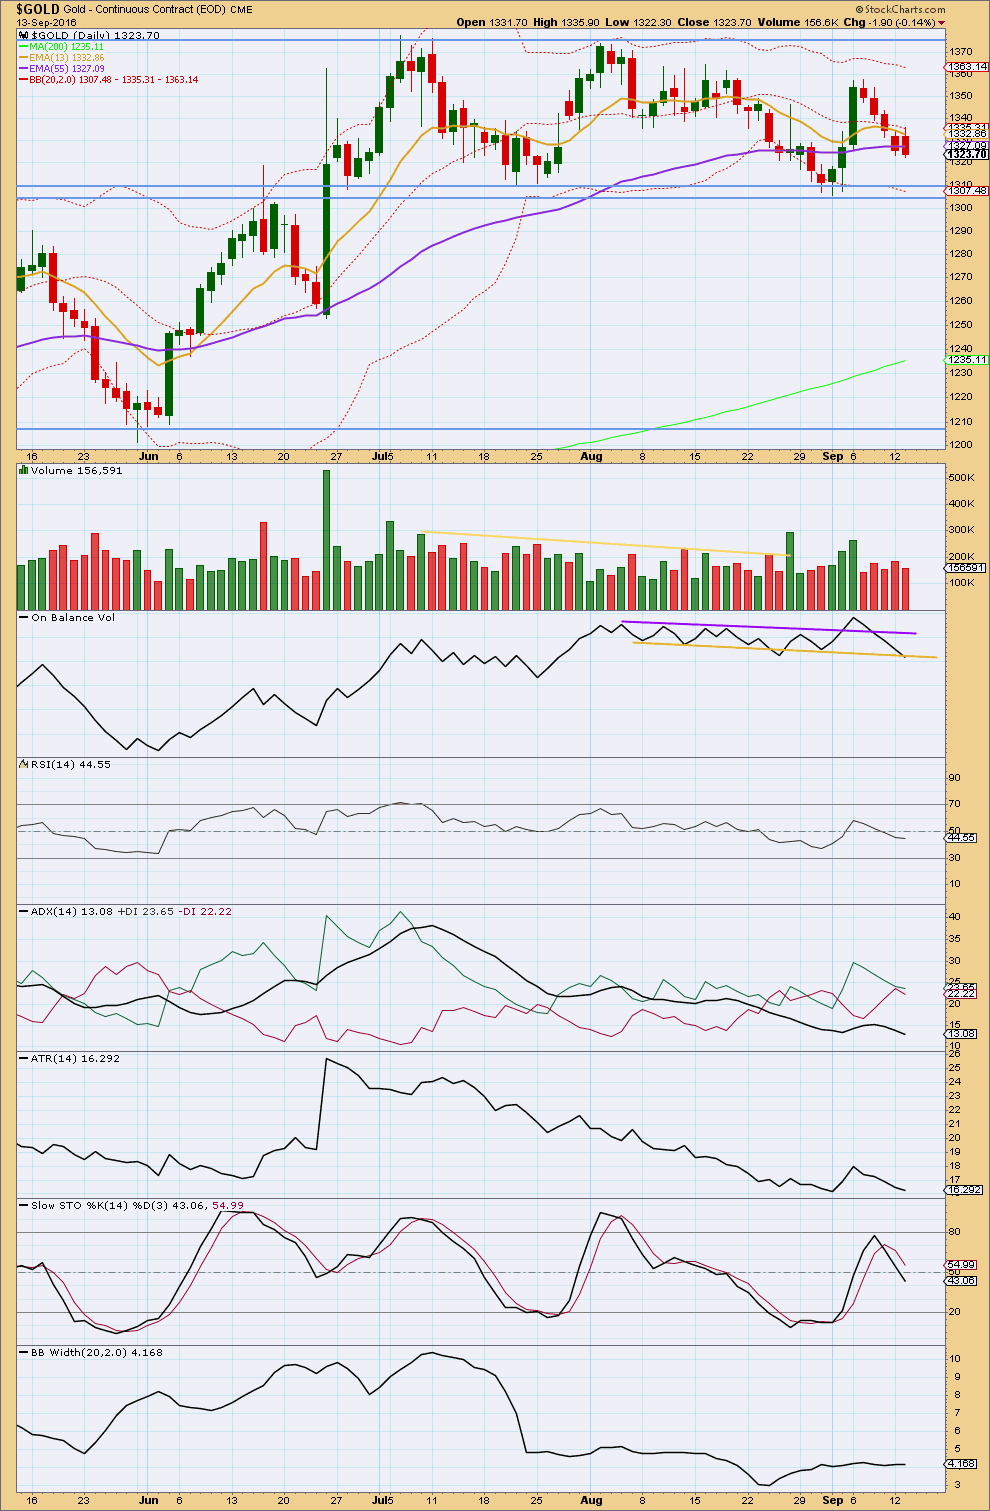
Click chart to enlarge. Chart courtesy of StockCharts.com.
Another downwards day comes with lighter volume than the prior day. The fall in price is not supported by volume. Volume of the last five days is still lighter than prior upwards days. The short term volume profile is still bullish.
Price may find some support here about the 55 day moving average. If price moves below the 55 day average, then it should find very strong support at the horizontal trend lines at 1,310 and 1,305.
Gold remains range bound. The sideways consolidation began back on 7th of July. It is now three upwards days of 8th of July, 26th of August, and 6th of September that have strongest volume. The signal is clear. Gold is more likely to break out of this consolidation upwards than downwards. Resistance is about 1,375 and support about 1,305.
The shortest moving average, a Fibonacci 13, is pointing lower but remains above both the mid term and long term moving averages. The Fibonacci 55 day moving average is now flat, but the long term 200 day moving average is still pointing upwards. The larger trend remains up.
On Balance Volume is breaking below the yellow support line. The breach is as yet too slight for this to be a clear bearish signal. If OBV turns upwards from here, then it would be offering a strong bullish signal and the line may need to be slightly adjusted to sit on the low for today. If OBV moves lower tomorrow, that would be a strong bearish signal; it may precede further strong downwards movement from price.
RSI is now just below neutral. There is plenty of room for price to rise or fall. There is no divergence today between price and RSI to indicate weakness.
ADX is declining indicating the market is not currently trending. The +DX line is still above -DX line. A cross over would indicate a potential trend change, but the black ADX line must increase also to indicate a downwards trend.
ATR is also declining for five days in a row now. Range for the last five days is very clearly smaller than prior upwards days. This strongly suggests that this downwards movement is a counter trend pullback and not the start of a new downwards trend.
Stochastics did not manage to reach overbought at the last high.
Bollinger Bands are still tightly contracted. This also supports the idea that the last four days downwards movement is a counter trend movement and not the start of a new trend.
This analysis is published @ 05:40 p.m. EST.
While price is moving up (and failed first to go down any more to the target) so overall the third wave may be starting…
But the rise is a bit pathetic.
I can see a five up on the hourly chart. I need still to check the subdivisions (focussing on subminuette iii) on the five minute chart.
So far this is what I have.
I can now see another possible wave count for the original down structure.
Supposing minuette 1 (1327.93) and 2 (1331.17) in Minor 2 are correct, and the low of 1315.71 is minuette 3. Also, that the long corrective structure up to the high of 1326.17 is minuette 4. Then, a 5 wave down would complete minuette 5 and hence Minor 2.
The divergence is my two wave counts would be:
(a) a rise above 1332.10 to favour the Minor 3 count, posted below; and
(b) a drop below 1315.71 to confirm this Minor 2 count.
Let’s see how it plays out.
This is a chart showing the structure assumed.
I agree it’s possible in the realm of possibilities…. but I really don’t like the proportions and the three wave look to minuette (iii)
For the Minor 3 continuation structure, use the chart above with these substitutions:
(a) Minuette 3 becomes Minute C and hence Minor 2.
(b) Minuette 4 becomes subminuette 1 of Minor 3.
Gold inches higher as dollar faces selling pressure
Sept 14, 2016 10:52 a.m. ET
http://www.marketwatch.com/story/gold-tilts-higher-as-dollar-faces-selling-pressure-2016-09-14
I had considered Minuette 5 (and hence Minor 2) complete at the low of 1315.71, which is the point Lara labelled subminuette 3. I can count 3 waves between her labelled subminuette 2 and subminuette 3 (and they are subminuettes 3, 4, and 5), and entered a small buy at yesterday’s close.
The rise from 1315.71 to the high of 1326.17 shows a clear 5 waves, and this is the first wave of some lower degree in Minor 3. I just choose to call it subminuette 1 as that would fit all projected waves up to the end of Minor 3. This 5-wave structure looks like a leading diagonal. Confidence in this wave count is 1332.10, the start of Minute C in Minor 2. Anyway, I got out of my NUGT at 19.50 just now for a $1+ profit which works out to be a respectable sum given that it is only a few hours’ holding. I’m not going to risk a second wave drop which, in the last couple of weeks, had been a whopping 0.786 drop.
Than makes sense Alan, thanks.
The rise from 1315.71 Tuesday’s 1:40 pm gold low at barchart.com to the high of 1326.17 at 1326.17 on pmbull.com at 10:30 am shows a clear 5 waves up.
Gold may retrace down from 1326.17 today however the low may have already happened Tuesday.
Now I just watch gold drop as usual lately.
Interesting gold EW chart and brief article as of end of Sept. 12th. He was looking for a 3rd wave to have possibly started as of Monday, however since then gold made a new low Tuesday.
GOLD Trading At A Support And A Possible Turning Point
Gregor Horvat of Elliott Wave Financial Service – IF – Tue Sep 13, 2:32AM CDT
http://www.barchart.com/headlines/story/942956/gold-trading-at-a-support-and-a-possible-turning-point
Low buys would of been right call Tuesday.
Miners up good now.
Not sure how high may go today before dropping.
Maybe 10:23 am high of 1324.73 will be the morning high?
Did have some bullish signals on gold and NUGT firing buys at 5 minute time frame at 9:10 and 9:20 am so may continue higher.
Lara’s target of 1312 wasn’t reached yet and not sure if still in play or gold already bounced off of support but may be due for a correction down for a 2nd wave to test the low.
barcharts low is 1315.91 at 1:40 pm Tuesday so far.
http://www.barchart.com/chart.php?sym=^XAUUSD&t=BAR&size=M&v=0&g=1&p=I:20&d=M&qb=1&style=technical&template=
Any wave counts?
Rambus on the GDXJ
http://www.safehaven.com/article/42520/gdxj-updatea-diamond-in-the-rough
To be frank guys i just want to stick with the idea that we are in minor 3. Many options many thoughts many guys all around with ther ideas on this move in gold is actually making this a big mess. So better to stick only with Laras analysis untill it proves wrong. This is my personal feel.
Just want an idea on TA. What does that say for next couple of session ?
Since we had 4 red days in a row,this redbath in gold seems to be overly carried now. So what the technical indicators suggests for the upcoming short term move?
Any idea..??
Until I woke up today to see a pathetically small green candlestick, I would have said I would be expecting a strong green daily candlestick today and tomorrow.
At least the colour is right 🙂
I base this on volume and On Balance Volume mostly. Volume is bullish, and OBV is right at support.
Lara
The green speck, I mean candlestick, it looks pretty big to me through the Hubble telescope.
http://www.spacetelescope.org/images/sts103_713_048/
Im also delighted to see the color green 🙂
So I’ve been thinking about the recent market movements:
> Gold can’t seem to get it’s 3rd wave up going
> Miners have sold off hard
> USD is wedging into a pennant with a breakout pending
> General Market is selling off (probably in hope that will encourage Fed not to raise rates)
All this as we go into another Fed meeting next week.
So my latest idea for GDX is that it may move sideways to form a triangle that may end next Wednesday. I’m showing two possible paths, both of which could be a continuation of Cycle Wave x. Ultimately, I think GDX (and gold) still has more up to go, but there’s still room for a little more down first, or we just go up. Something for us to keep an eye on anyway.
Any comments?
Perfectly summarized, Dreamer! That Gap fill potential is quite spooky and it’s hard to have faith in all of the analysis while gold retreats day after day even though the bottom was thought to be in for several sessions.
What’s also interesting is that with all of the other Fed meetings that have taken place in 2016, the stock market hasn’t behaved the way it’s behaving now. It’s almost as if the smart money is positioning for a rate increase on 9/21 regardless of the less than 15% rate increase potential… dot plots.
Personally, I don’t think the Fed will raise on 9/21. If they do, gold will certainly retreat and GDX will be crushed as the markets work to correct the 5% – 10% being forecasted.
Until then, pennants will form as you’ve described and then it’s hold on tight for the decision on 9/21.
Thanks for your thoughts and charts!
Hourly chart of XAUUSD- barchart.com.
Of course, as usual, the ‘picture’ changes when one views the same time frames on a different platform, ie: PMbull.com– they use Pro Real Time charts looks less difinitive, etc.
Dreamer ,
Uploading a few charts w/candles- XAUUSD fr. Barchart.com. I am not an expert and often sit in front of my platform w/Steve Nison’s book in my lap.
1. Note on the daily a potential Inverted Hammer. (I’m not suggesting a Gravestone doji because candle has shown up towards bottom of a short term move)
2. Note on the hourly a potential Hammer.
Dreamer, as time allows….could you go back to Sept 12 under your Dollar charts and take a look at my brief discussion/charts. Your thoughts are appreciated.
Thank you
Hi Melanie,
I agree, the current sideways move (4th wave?) is getting very long compared to wave 2 and would look better if it resolved sooner than later. I illustrated a possible move down to the 200MA, but it could break the pennant to the downside and then turn back up much sooner. There are some analysts out there that think the $USD top is already in. I really don’t spend a lot of time analyzing the $USD. That said, I think it will break the pennant around next Wednesday. Let’s see which way it breaks
The bulls are thoroughly being tested. There’s really no more room on the downside for the bull count IMO. A confirmed break above the downtrend line of the last week is needed for the bulls. Likewise, a confirmed break below the uptrend line shown would be bearish. Volume for today’s down day was slightly lower than the volume for yesterdays up day…a slightly bullish sign.
Hi Lara,
Thanks for your analysis! I think we’re all ready to start this uptrend and rally!
So, in your notes, you mention the following, “A single zigzag may now be either complete or very close to completion.
At 1,312 minute wave c would reach 0.618 the length of minute wave a. Price is now very close to the lower edge of the Elliott channel drawn about this zigzag.”
Since it’s possible that gold’s decline may be complete, is there a price level that gold could reach (other than the upper channel, of coursel…hahahaha) that would make you feel comfortable that gold may not retrace to 1312? Currently, gold has climbed to 1319 since hitting it’s low late this afternoon.
Also, Alan helpfully mentioned this afternoon that he was expecting one last final push downwards to complete the 5th wave down. With gold bouncing, I’m just curious as to the probability that it has bottomed or still needs to bottom?
I’m grateful for the feedback.
A new high above the start of minute c at 1,331.73 would give me confidence.
At that stage upwards movement couldn’t be a second wave correction within minute c. So IF I have labelling of minute c right then that would be a strong confidence point for minor 3 beginning.