
Upwards movement was expected from yesterday’s Elliott wave count.
Summary: Price should continue upwards as an upwards trend develops. Range and volatility are expected to increase. A short term target is now calculated at 1,446. The long term target remains at 1,585. On Balance Volume today gives a bullish signal in support of the Elliott wave count. Risk must remain at 1,302.93.
New updates to this analysis are in bold.
Last weekly charts are here.
Grand SuperCycle analysis is here.
DAILY ELLIOTT WAVE COUNT
Click chart to enlarge.
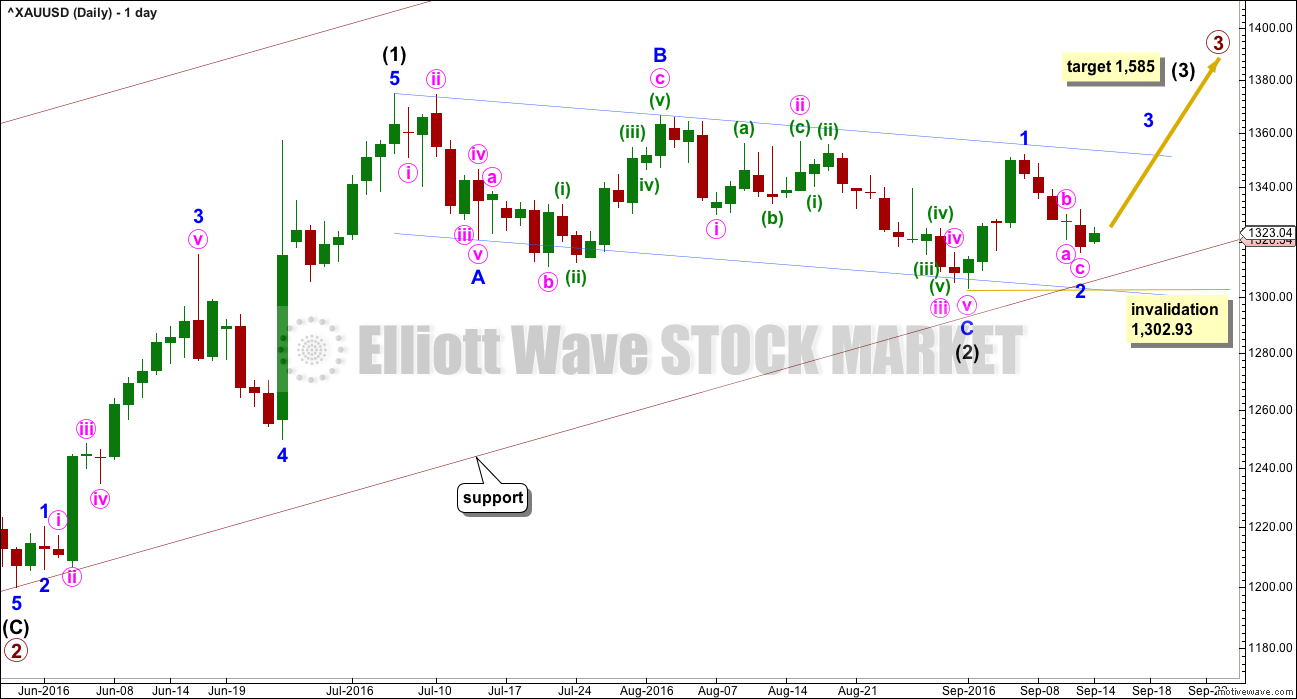
Primary waves 1 and 2 are complete. Thereafter, this wave count differs from the alternate.
This main wave count will expect primary wave 3 to be longer than primary wave 1. Because this is very common, this is the main wave count. It expects the most common scenario is most likely. At 1,585 intermediate wave (3) would reach 1.618 the length of intermediate wave (1).
Intermediate wave (2) may now be complete ending just below the 0.382 Fibonacci ratio of intermediate wave (1) and lasting 40 days. Within intermediate wave (3), minor wave 2 may not move beyond the start of minor wave 1 below 1,302.93.
Draw a channel about intermediate wave (2) using Elliott’s technique for a correction (blue lines). Price is finding some resistance on the way up about the upper edge. After breaking through resistance at the upper blue line price may then turn down to find support about there.
With this wave count expecting a third wave at two large degrees to begin, look out for surprises to the upside at this stage.
Intermediate wave (1) lasted 27 days and intermediate wave (2) lasted 40 days. Intermediate wave (3) may be reasonably expected to last longer than intermediate wave (1) in both time and price. A Fibonacci 55 days would be a first expectation.
HOURLY ELLIOTT WAVE COUNT
Click chart to enlarge.
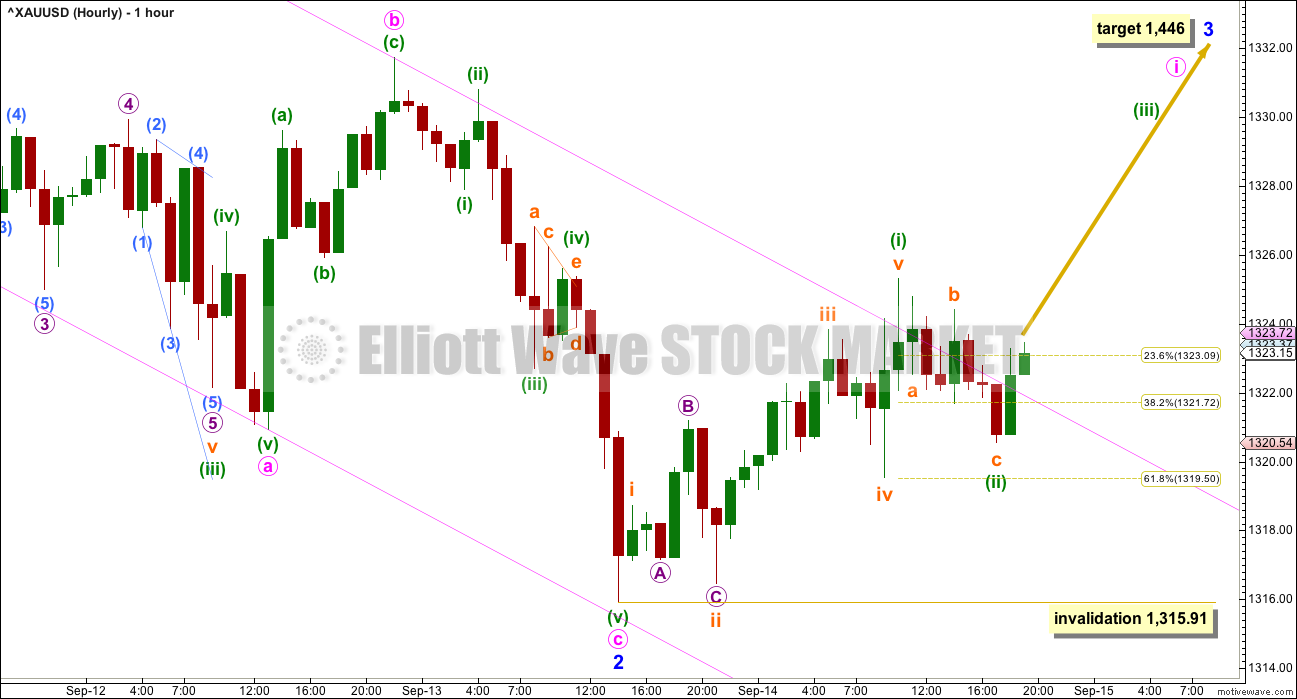
A single zigzag may now be complete.
At the daily chart level, the green doji for 12th of September now gives minor wave 2 a clearer three wave look.
Within minor wave 2 there is no Fibonacci ratio between minute waves a and c.
Ratios within minute wave a are: there is no Fibonacci ratio between minuette waves (i) and (iii), and minuette wave (v) is 0.7 longer than equality in length with minuette wave (i).
Ratios within minute wave c are: minuette wave (iii) has no Fibonacci ratio to minuette wave (i), and minuette wave (v) is 0.58 short of 2.618 the length of minuette wave (i).
So far a five wave impulse upwards from the low of minor wave 2 may have completed. Ratios within minuette wave (i) are: subminuette wave iii is just 0.03 short of 2.618 the length of subminuette wave i, and subminuette wave v has no Fibonacci ratio to either of subminuette waves i or iii.
Minuette wave (ii) may now be complete as a relatively quick zigzag, and relatively deep at 0.51 of minuette wave (i). If minuette wave (ii) continues any lower as a flat, combination or double zigzag then it may end closer to the 0.618 Fibonacci ratio of minuette wave (i) at 1,319.50.
Minuette wave (ii) may not move beyond the start of minuette wave (i) below 1,315.91.
Minor wave 3 may only subdivide as an impulse. Within it the first wave of minute wave i is unlikely to be complete, it should last a few days. When minute wave i is over then another relatively deep correction for minute wave ii should unfold and is very likely to show up at the daily chart level, it may last about two to four days. This should present another opportunity to join the upwards trend.
ALTERNATE DAILY ELLIOTT WAVE COUNT
Click chart to enlarge.
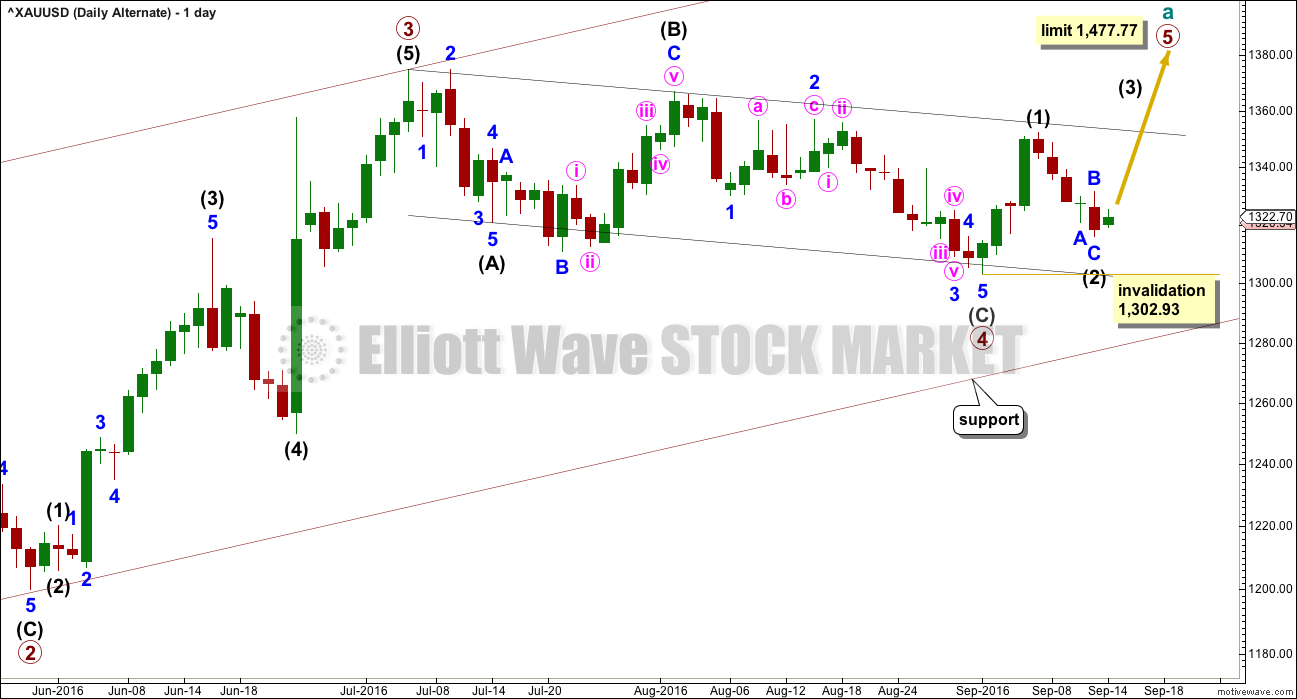
It is possible that primary wave 3 is over and shorter than primary wave 1. Primary wave 3 shows stronger volume than primary wave 1 (see technical analysis weekly chart).
If primary wave 3 is over, then the current consolidation for Gold would be primary wave 4.
Primary wave 2 was a relatively shallow 0.35 expanded flat correction. Primary wave 4 may be a deeper zigzag which would exhibit perfect alternation.
Within primary wave 5, no second wave correction may move beyond the start of its first wave below 1,302.93.
Primary wave 5 would be limited to no longer than equality in length with primary wave 3, so that the core Elliott wave rule stating a third wave may not be the shortest is met. Primary wave 5 would have a limit at 1,477.77.
The hourly chart would be exactly the same.
TECHNICAL ANALYSIS
WEEKLY CHART
Click chart to enlarge. Chart courtesy of StockCharts.com.
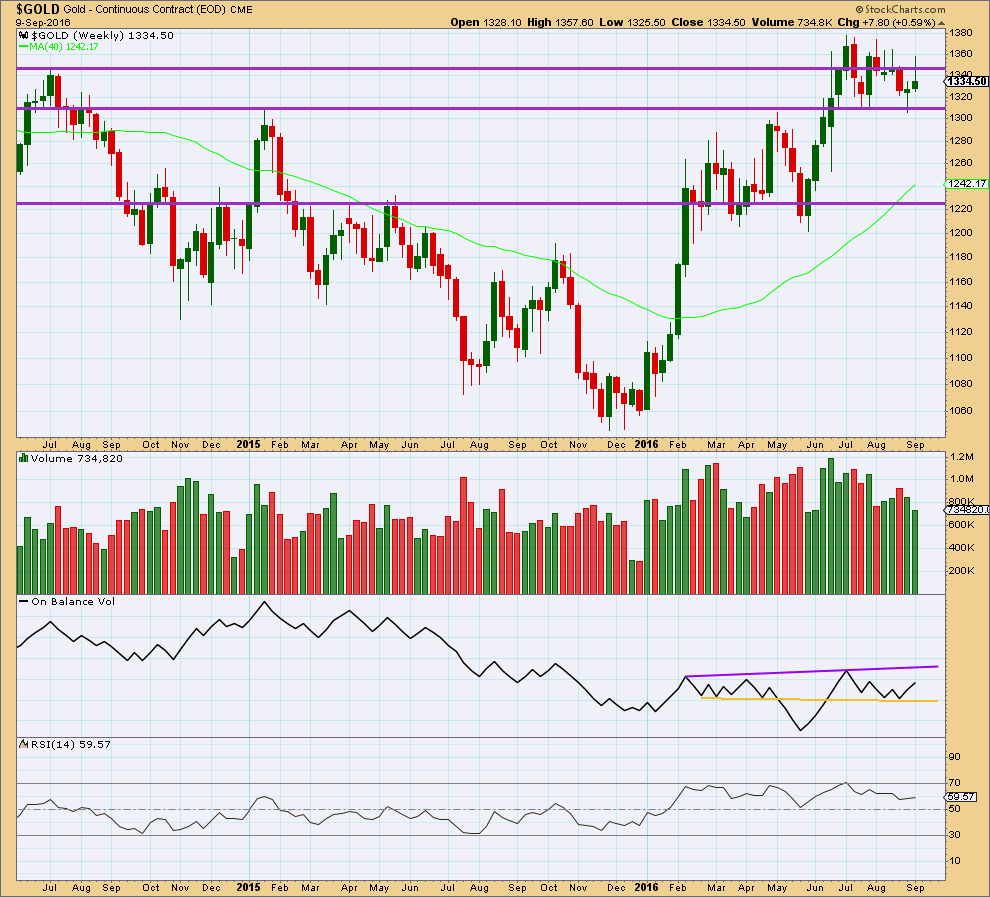
Last week moved price reasonably higher, but as yet now a new high above 1st August or 5th July has been made. The green candlestick colour is bullish, but the long upper wick is bearish. The decline in volume for an overall upwards week is bearish, but to understand what is exactly happening in terms of volume it needs to be looked inside at daily volume bars.
On Balance Volume remains bullish with an upwards move further away from the yellow support line.
RSI is still not extreme. There is room for price to rise or fall.
DAILY CHART
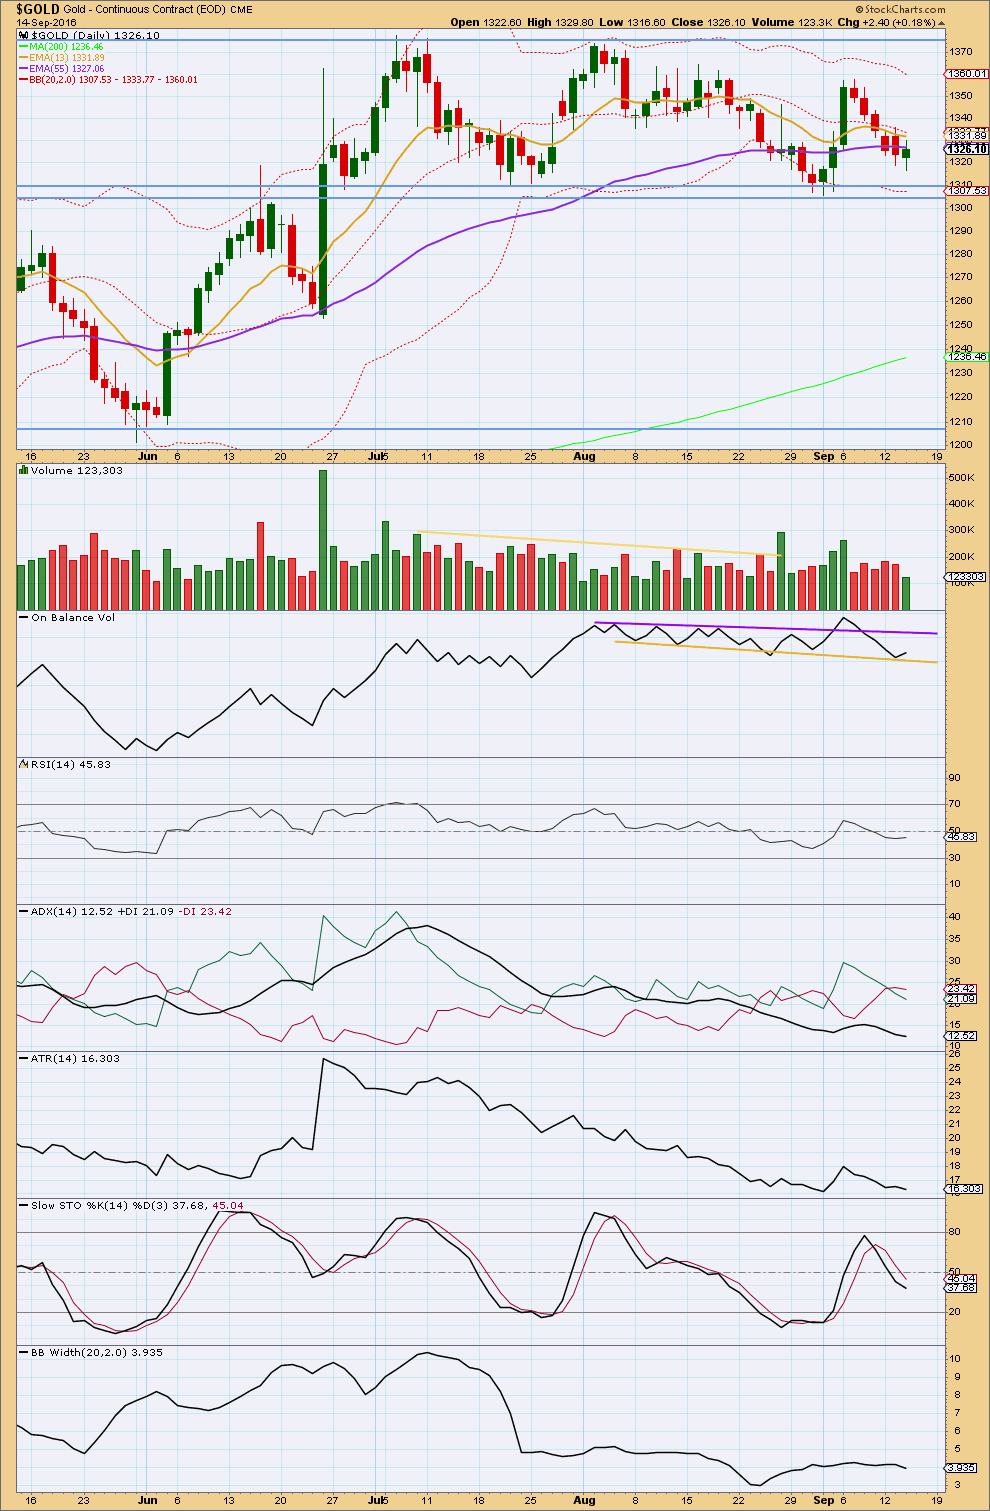
Click chart to enlarge. Chart courtesy of StockCharts.com.
The session for 14th of September completes with a lower low and lower high than the prior session. This daily candlestick may be the last candlestick of this small counter trend movement.
Overall the session completed with upwards movement, closing above the open. The rise in price was not however supported by volume, volume is lighter for this upwards day than prior downwards days. On it’s own this is slightly bearish, it suggests the low may not yet be in place. If price continues lower it may find support about 1,310.
Overall though the volume profile remains more bullish than bearish; the rise in price to the last swing high of 6th September was supported by volume, and the following fall in price is not.
On Balance Volume is giving a reasonable bullish signal today with a small move up and away from the yellow support line. This line is very slightly adjusted now to sit on the last low. OBV may find some resistance at the purple line. This bullish signal supports the Elliott wave count.
RSI is just below neutral and exhibits no divergence with price to indicate any weakness.
ADX is still declining indicating the market is not trending. ATR agrees as it too is overall flat to declining. Bollinger Bands agree as they remain tightly contracted.
Price is still range bound, with resistance at 1,375 and support at 1,305. During this range bound period it is three upwards days which have strongest volume suggesting an upwards breakout is more likely than downwards. This supports the Elliott wave count.
Stochastics is close to neutral. It did not reach overbought at the last swing high, and price did not reach resistance. A range bound approach may expect price to continue higher from here and only to end when price is at or very close to resistance, and Stochastics is overbought at the same time.
This analysis is published @ 07:51 p.m. EST.
its not over yet. Evrethyng as I said a while ago. Going side and down all September and at the end of September trough October down to 1300 to 1200. End of story. Can anybody give at list one reason what can move gold up to targets on EW 1400 in short term? I don’t see any. Looks like by November trend will be changed to bearish and probably not far from there we will be back to where we start this rally a year ago
That’s fine enough to make a prediction, but you still need to back it up with some technical analysis.
You have been right to date, Gold has moved lower. But that does not mean you will continue to be right, and it still means you need to back up your prediction with some reasoning.
I am genuinely curious. If you have some bearish TA to back up the prediction, I am genuinely curious to see it. Maybe I’ve missed something. It wouldn’t be the first time, and nor would it be the last.
Hi Laura. Im not EW analyst and made a mistake by letting EW analysts influence on my decision with purchasing wrong positions. I think EW works on ideal , quiet relatively market . But when it comes to turbulence, many EW analysts totally wrong on their predictions. In global picture maybe fine but on lower charts 1H-4H-Day are not. I used 3 other services and all of them wrong on their visions of gold movements. Only one guy was correct, not in numbers for 100%, with a direction. Tim Wood. I called him a week ago and we talk for 30 minutes about his method. He proof what I was worried about others. He using all statistic data and events from past and present to make EW analysis. As I understand others not. It takes massive amount of time but its giving more accurate prediction. What I don’t see in your and other EW sites connection between current events and your predictions. You sounds very bullish on things that is not in reality. Im not accusing you on been inaccurate, its market, and its your way to do your business, and as I said you might be right as many others in normal market and lost when market comes to volatility mode like now. But you were asking me to tell you my point and I do. And I think its normal.
On my vision events that contradict your price targets are:
1. USD bullish trend. ( its correlated with gold price)
2. Rising VIX ( never good for gold , when investors see unpredictable risk level they prefer to cash money out from their positions. They don’t see a gold as Safe Haven, remember market crash with Lehman Brothers, gold fall as any other assets) This time election, Over credited situation on the market, manipulated economical data and so on… List is huge
3. Fed decision with a rates hike will make dollar stronger and gold more expensive for foreign buyers.
And overall bearish situation so clear and dominates that I don’t know even if the Fed decision even matter anymore. Gold movements lately fallowing same bearish pattern: good news for gold – and its up for $10 and next 3 days its down $30. One step up and three down. This is overall sentiment.
Thats why I was asking anyone to give at list one reason why gold should continuing its rally? I hope Im wrong. I do have stupid long positions I like to get rid of. And I like to see your plan works, but all I want to know on what bases . Best of luck
One more thing. On my point of you major drivers for gold rally should be:
1 Inflation number rise
2. Interest rates lower
3. QE4 starts again.
Until its happened I don’t see any other drivers but speculations
The low for today is very close to the maroon trend line on the main daily chart. If price moves any lower it should find strong support there.
Minor wave 2 is now very deep indeed.
When second waves are very deep they convince us that there is not an upwards trend, that there has been a trend change and that price must move lower. They do this right before a third wave.
Yes gold is trying to head fake us that a mega 3rd wave won’t happen and tomorrow gold hopefully may jump up $100 like BREXIT and we can Buy in, throw a lasso around it and ride it like Lara surfs a Tsunami, Yee-haw .
LOL
My surfing is a bit more moderate than that, but yeah, technically I have surfed a tsunami!
I was stopped out on my second position. Sill holding my first.
This is actually a really great entry point for a long IF the wave count is correct.
And the hardest thing in the world to do as traders is enter on a correction, in the direction of the larger trend. Psychology is most of trading.
Buy the dips sounds easy as a sound byte, but doing it IRL is really hard! Right when price has been going down for seven days now, against the trend, is the hardest point to enter long.
Live Interactive gold chart going back to 1979- from 1 minute to 1 month with studies
http://www.investing.com/commodities/gold-advanced-chart
Lara,
Is there a bearish hourly count you can publish for possible break below 1300?
Thanks.
Every time a second wave is deep this question is asked.
I could manufacture a wave count for you.
I could come up with a wave count that sees intermediate (2) continuing lower, that would be possible. But it would be longer in duration that primary 2 one degree higher and would have to breach the base channel in order to complete.
That would look all wrong. Manufactured.
Should I publish such a wave count because members request it?
After markets are closed and I have volume data from StockCharts I’ll make a decision. If the classic TA points to more downwards movement then I may publish the idea. But if it doesn’t, then I won’t.
Appreciate the comments and thanks for the consideration.
No worries. And I understand the concern.
Hourly chart was invalidated below 1,315.91
Today’s Low: 1,314.50 at barchart, Lara’s gold feed
Gold (^XAUUSD)
http://www.barchart.com/quotes/forex/Gold/%5eXAUUSD
Sorry barchart gold day low was 1310.28 at 10:10 am.
I find that using barchart to find gold price is hard to use and their link even changes after you cut and paste it. Bizarre.
Barchart appears not user friendly. I much prefer pmbull.
http://www2.barchart.com/news/%5EXAUUSD
http://www.barchart.com – enter – Symbol – %5EXAUUSD
Yaa it looks like an amazing call Alan..superb :). But im concerned on volume profile and on balance volume indicator today. If this move dont happen to close in a positive territory we could actually have a huge volume day in RED. And also that on balance may breach the down side line. So like this TA will give a bearish outlook for short term 🙁
I hope that we close above yesterday close to get a doji it will be a power booster for the minute wave up
pmbull site down, you can access it here a save chrome version.
http://webcache.googleusercontent.com/search?q=cache:http://www.pmbull.com/gold-price/&gws_rd=cr&ei=2snaV53dAYHq-QHBl4mQBg
pmbull live idown last 10 minutes but google chrome can pull up a saved version
This site can’t be reached
http://www.pmbull.com refused to connect.
Search Google for pmbull gold price
ERR_CONNECTION_REFUSED
SHOW SAVED VERSION
http://webcache.googleusercontent.com/search?q=cache:http://www.pmbull.com/gold-price/&gws_rd=cr&ei=1cjaV4z_Ccyv-AGGw4HQBw
Days like today are why often it is a good idea to sell at the morning high as gold and miners are like seesaws up and down often this month.
PMbull Non-flash server is not working???
Any one exp that???
I’ve always used the live gold version, haven’t tried the non-flash version. Anyway, pmbull has the uncanny ability to time out, sometimes very quickly and often. But, I like to use it because it is “live”. I use the 1 minute chart for timing my entry and exit points.
Accuracy-wise BarChart would be better, but there is a 20 minute delay. Very costly if you use it for day trading.
It is working for me, however it does need refreshing too often for my liking but I still use is everyday including right now.
papurdi, I use the live not the non-flash
So, the down move I surmised yesterday turned out to be the real McCoy? The one I posted at 1:52 pm yesterday.
The strong move down (currently 1310.06 low) would be minuette 5 of minute c of Minor 2. Right now, the drop is likely to be not be over yet. At 0.886 retrace, my target is 1308.25.
If correct, the strong move up in Minor 3 should start once the drop is complete.
Alan yes another good call of yours thanks for your clarity.
I’ll look for 1308.25 and also for NUGT to settle as I’d expect NUGT to drop even more when gold touches a 2nd time just above where it bottoms around 1308.25 as it usually freaks out the GDX and NUGT investors even more in the small 2nd wave drop maybe 30 to 60 minutes later?
Richard. As of now, it is still not done yet. I can only count 3 waves down in minuette 5, ending at 1309.40. Now we are in the deceptive 4th wave up. One last 5th drop should take place after the rise.
That is one heck of a strong wave up and only $1 above your 1308.25 target.
Gold seemed to react as if it was the bottom at 1309.40 at 10:09 am.
Miners sure took off since then.
NUGT topped pre-market at 8:30 am at 19.36, then dropped to a month low of 17.50 and then NUGT 1 minute fired BUY at 10:00 am and jumped and hit 19.28 at 11:00 am then 19.65 at 12:06 pm which may be the top for now?
Since 12:20 NUGT dropping fast, but hard to call the top on miners when numerous time frames from 1 to 78 minutes go into an EMA buy for both gold and NUGT this morning as when gold retested at 11:53 the market high but failed to make one, then NUGT did make a new high at 12:06 of 19.65 as sentiment on miners builds up when gold stay at this $10 above market gold low and after miners month low.
Hi, I am a new subscriber and not so technical yet.
Does this mean we are now heading for the last 5th wave down which has 1308.25 as a target? Will that be the final target bottom or is there a likely risk that we are going to test the trendline at 1303 or even down to touch the 200DMA?
Original chart reproduced for convenience.
What is wrong is the position of minuette 4. It should be at today’s high of 1328.32 instead. Sigh, the combination WXY and not the simple zigzag.
Amazing, Alan! Yes, you did call that yesterday. All the head scratching I’ve been doing this morning made me forget about that call.
Thanks so much for sharing your thoughts….. always!
Gold’s move this morning is just so hard to understand considering all of the negative US news released this morning. So many pundits are confirming that September is off the table in terms of a rate hike and today’s data suggested at least a positive move in gold today.
Thanks for relaying your comments again today! It’s a breath of fresh air as I and others wonder if we should hold on.
Alan your report with chart helps clarify the counts. Thanks for posting chart.
One more down to $1308 Alan?
Sorry Marc. I was having my dinner.
I am now inclined to believe that the drop was over at 1309.40 after all. The fourth and fifth waves were rather shallow.
If price continue to rise with increased momentum, then Minor 3 would be underway.
Thanks
Current daily wave count invalidation is at 1302.93
Hourly wave count is invalidated. Need a new hourly wave count.
Gold near term target still $1446.
Lara: “Range and volatility are expected to increase. A short term target is now calculated at 1,446. “
Very interesting move in gold this morning.
After touching $1319 a couple of times last night, I thought we were out of the woods. This morning, US economic news broke that wasn’t favorable for Retail Sales and PPI. Low and behold, gold spiked to 1328. However, thereafter, gold has fallen for the next 35 minutes to 1316. That’s quite a move considering that the news was poor and also reinforces the idea that the Fed most likely can’t move on interest rates in September.
From a wave count perspective, what would this equate to and is this expected? Invalidation point is 1315 so let’s hope it holds on.
weiquan
Below is monthly stockchart of gold from 1980 to today.
Thanks, Papudi!
Hi..
Today retail sales data will help us to achieve our desired wave 3 target. Than a second wave correction may start tommorow or from monday till wednesday and than madam jannet yellen will set a road map for minor 3 to achieve its target 🙂
Lolzz
Chart by Gary Savage
Does anyone know a website that can show charts that are beyond 20 years history? Thanks!
barcharts goes to 25 years
http://www.barchart.com/chart.php?sym=GE&t=BAR&size=M&v=1&g=1&p=MO&d=X&qb=1&style=technical&template=
if you google the stock you are inquiring about and how many years back it may show up further back somewhere else
Historic charts of markets:
http://www.goldchartsrus.com/chartstemp/chartsrus.php
Thanks for your help, guys. Those websites are good, but the chart is too small, and I can’t really zoom in to see it in detailed. 🙂
I use fxtop 🙂
Thanks, Adam! 🙂