
Upwards movement was again expected.
Summary: The trend is up. The mid term target is at 1,437. The long term target is at 1,585. At this stage, expectations are for price to continue overall upwards for another one to few days before another counter trend pullback begins. Classic technical analysis strongly supports the Elliott wave count; volume supports this rise in price.
New updates to this analysis are in bold.
Last weekly charts are here.
Grand SuperCycle analysis is here.
DAILY ELLIOTT WAVE COUNT
Click chart to enlarge.
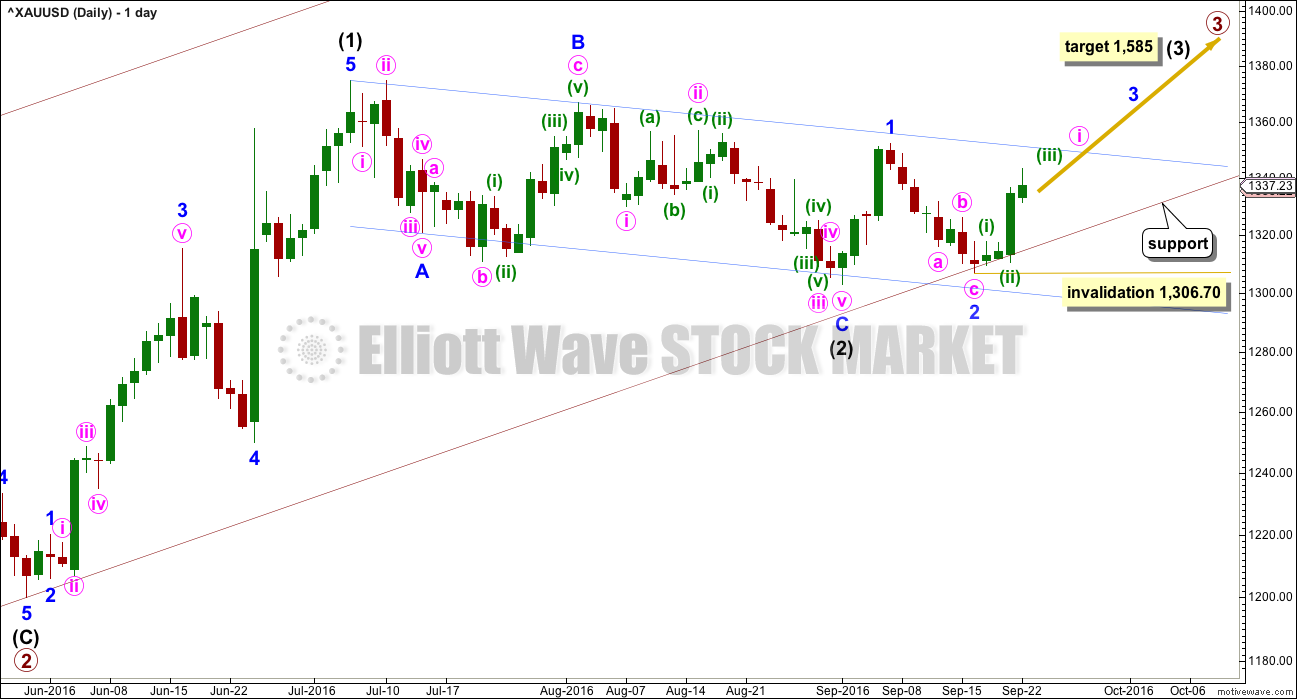
Primary waves 1 and 2 are complete. Thereafter, this wave count differs from the alternate.
This main wave count will expect primary wave 3 to be longer than primary wave 1. Because this is very common, this is the main wave count. It expects the most common scenario is most likely. At 1,585 intermediate wave (3) would reach 1.618 the length of intermediate wave (1).
Intermediate wave (2) may now be complete ending just below the 0.382 Fibonacci ratio of intermediate wave (1) and lasting 40 days. Within intermediate wave (3), minor wave 2 may not move beyond the start of minor wave 1 below 1,302.93.
Draw a channel about intermediate wave (2) using Elliott’s technique for a correction (blue lines). Price is finding some resistance on the way up about the upper edge. After breaking through resistance at the upper blue line price may then turn down to find support about there.
With this wave count expecting a third wave at two large degrees to begin, look out for surprises to the upside at this stage.
Intermediate wave (1) lasted 27 days and intermediate wave (2) lasted 40 days. Intermediate wave (3) may be reasonably expected to last longer than intermediate wave (1) in both time and price. A Fibonacci 55 days would be a first expectation. Intermediate wave (3) may end with a blowoff top.
The lower edge of the maroon base channel has proven to be providing strong support. Copy this over from weekly charts: draw a base channel from the start of a first wave to end end of the second wave, then place a parallel copy on the end of the first wave. In this case, the lower edge of the base channel is providing support. If price again comes down to touch it for another pullback, then it would provide an opportunity to join the trend at a very good price.
HOURLY ELLIOTT WAVE COUNT
Click chart to enlarge.
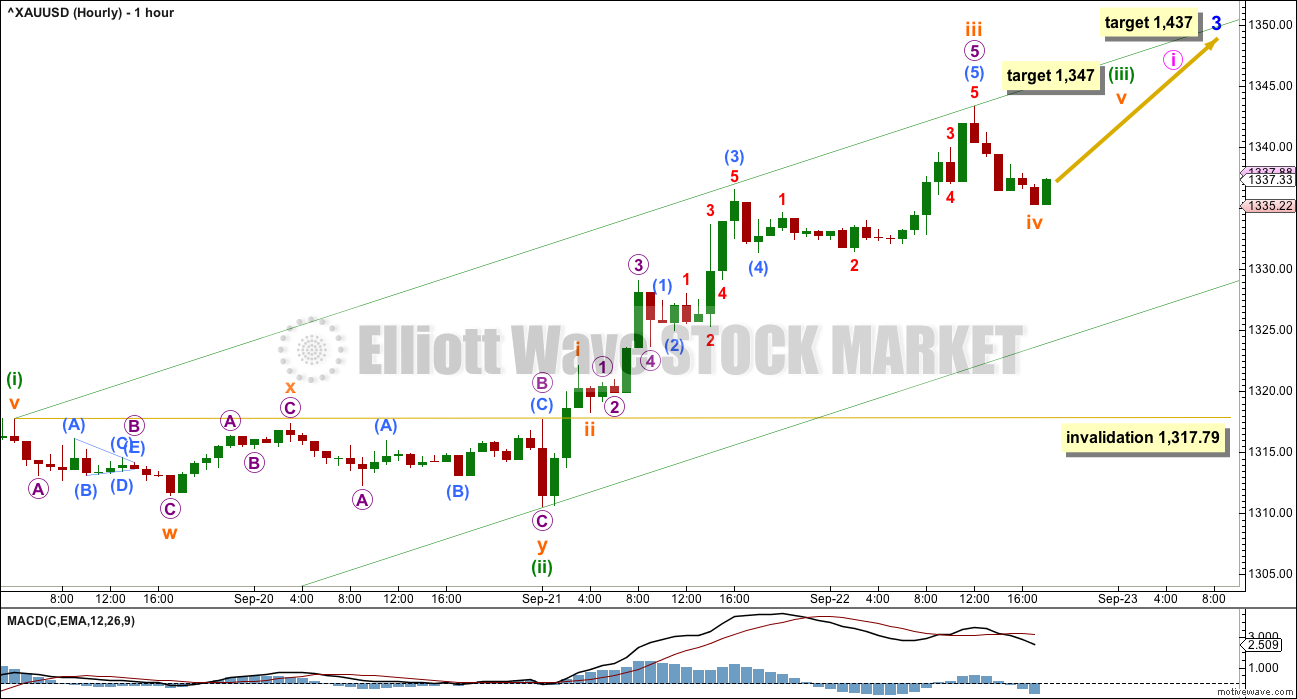
At 1,437 minor wave 3 would reach 2.618 the length of minor wave 1.
Minor wave 3 may only subdivide as an impulse. Within minor wave 3, the correction for minute wave ii is very likely to show up as a multi day pullback on the daily chart. First, minute wave i needs to complete.
Minute wave i must subdivide as a five wave structure. It is unfolding as an impulse. Within the impulse, the correction for minuette wave (ii) can be seen on the daily chart with smaller range days but no red daily candlesticks. When it arrives, minuette wave (iv) may show on the daily chart as one red daily candlestick or doji. It may last more than one day, but is likely to be over relatively quickly. Minuette wave (iv) may not move into minuette wave (i) price territory below 1,317.79.
At 1,347 subminuette wave v would reach equality in length with subminuette wave i. If subminuette wave iv is not over here and moves lower, then this target must also move correspondingly lower.
At this stage, the structure of minute wave i is still incomplete. Overall, it should be expected that price will continue to move higher to complete a five wave impulse for minute wave i. It may end in another one to three days.
At this stage, this wave count expects a third wave up at three large degrees to be in the early stages. Gold’s third waves often start out relatively slowly, building momentum towards the middle and exploding at the end. This allows plenty of opportunity to join the trend at the beginning, but only if traders have confidence in the trend. Buy the dips. Use corrections as opportunities to join the trend.
Risk is now at 1,306.70. When minute wave i is complete and minute wave ii arrives, minute wave ii may not move beyond the start of minute wave i at 1,306.70.
As always, never invest more than 3-5% of equity on any one trade. Always use a stop loss for all trades. Risk management is the difference between profit and loss, between traders who remain in the game and those who get wiped out.
ALTERNATE DAILY ELLIOTT WAVE COUNT
Click chart to enlarge.
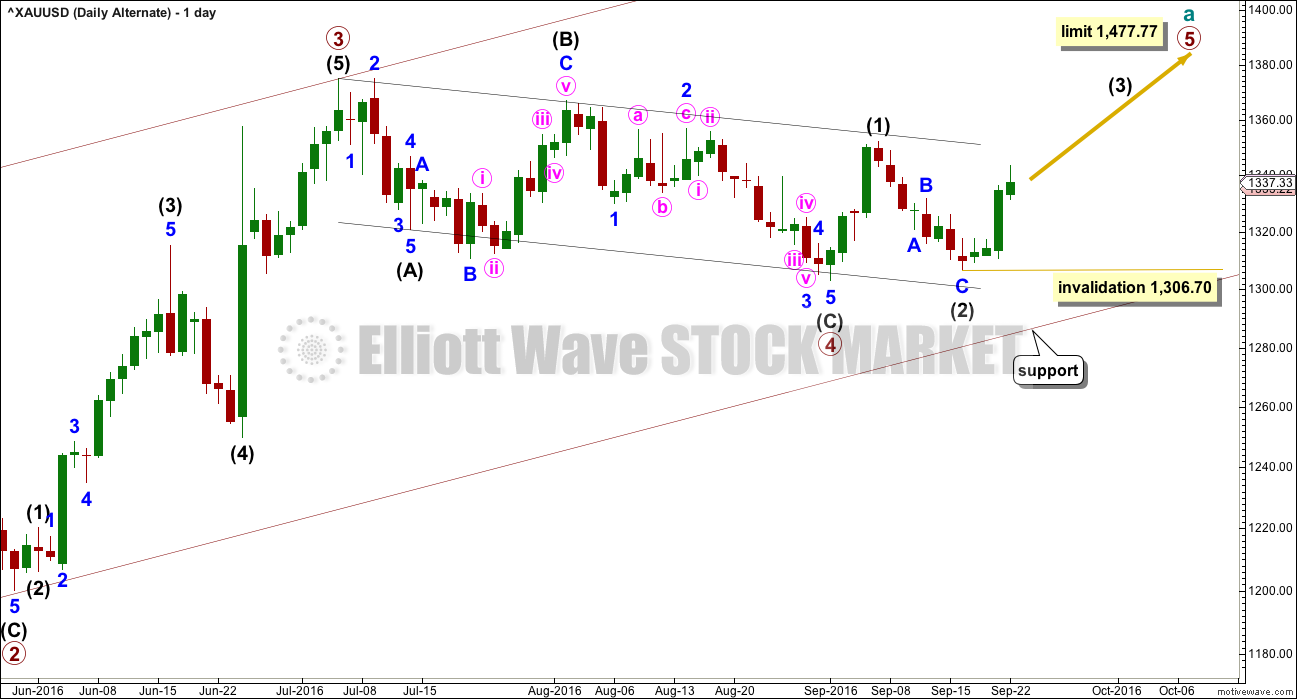
It is possible that primary wave 3 is over and shorter than primary wave 1. Primary wave 3 shows stronger volume than primary wave 1 (see technical analysis weekly chart).
If primary wave 3 is over, then the current consolidation for Gold would be primary wave 4.
Primary wave 2 was a relatively shallow 0.35 expanded flat correction. Primary wave 4 may be a deeper zigzag which would exhibit perfect alternation.
Within primary wave 5, no second wave correction may move beyond the start of its first wave below 1,302.93.
Primary wave 5 would be limited to no longer than equality in length with primary wave 3, so that the core Elliott wave rule stating a third wave may not be the shortest is met. Primary wave 5 would have a limit at 1,477.77.
The hourly chart would be exactly the same.
TECHNICAL ANALYSIS
WEEKLY CHART
Click chart to enlarge. Chart courtesy of StockCharts.com.
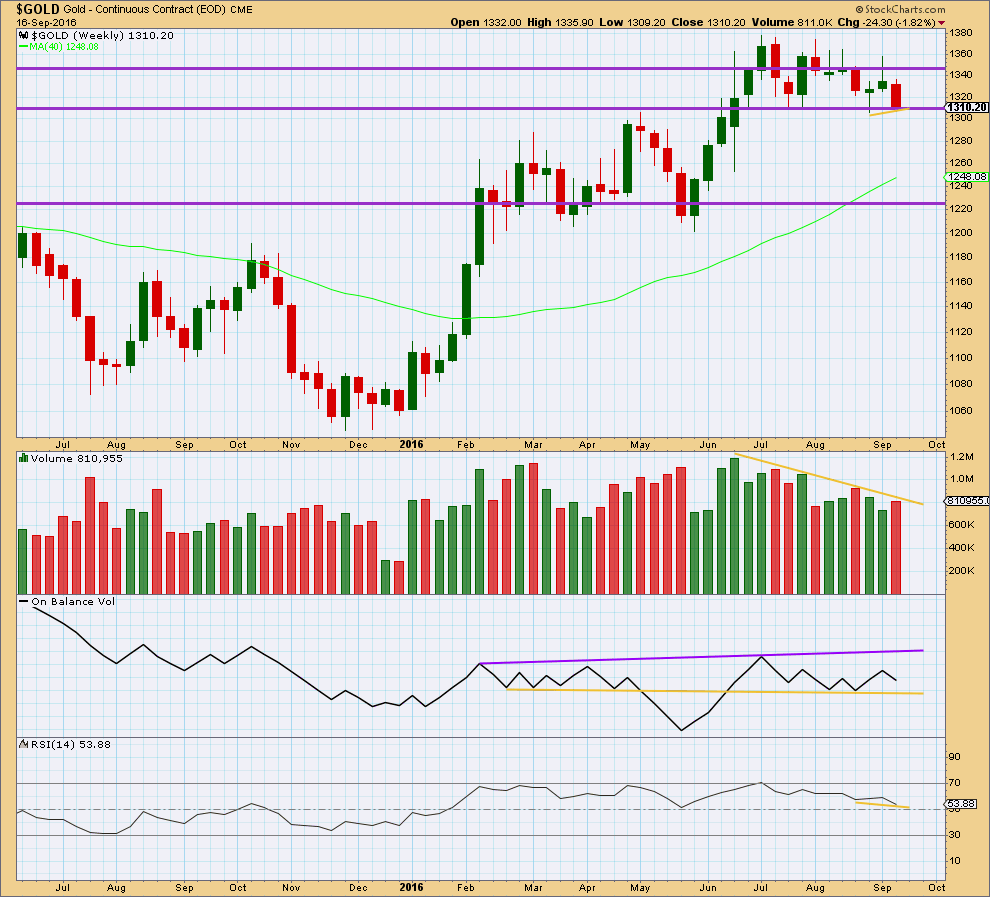
Short term stronger volume for last week compared to the prior green weekly candlestick is short term bearish. Again, it is important to look inside last week at daily candlesticks to have a clearer picture to what is happening here.
Mid term price is again finding support about 1,310 – 1,305. Volume is declining as price has been moving sideways. This sideways movement is more likely to be a consolidation than the start of a new trend.
On Balance Volume remains overall bullish with the last signal a bounce up from support at the yellow line. A break above the purple line would be a strong bullish signal. A break below the yellow support line would be a reasonable bearish signal.
RSI is close to neutral. There is room for price to rise or fall. RSI exhibits short term divergence at last week’s low with its last low, indicated by short yellow lines on price and RSI. This divergence is bullish and indicates weakness in the downwards movement from price last week. For Gold this divergence at the weekly chart level at its lows is usually a fairly reliable signal of a bottom. This reliability in the past means this divergence should be given reasonable weight in this analysis.
DAILY CHART
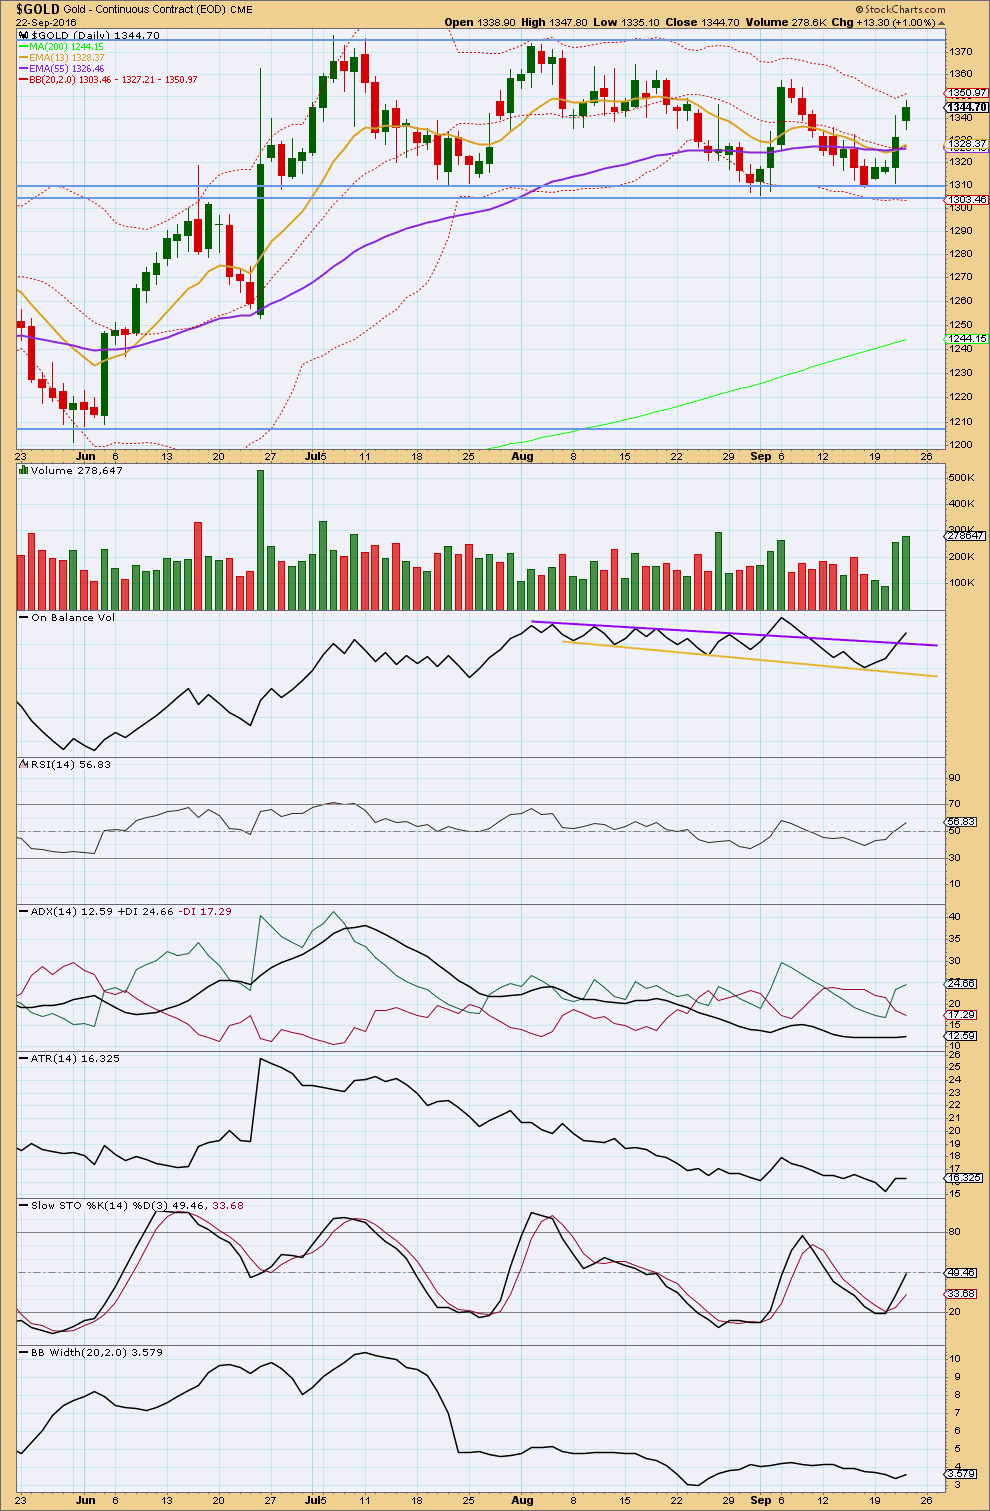
Click chart to enlarge. Chart courtesy of StockCharts.com.
Another upwards day with a higher high and higher low comes on strong and increasing volume. The rise in price is supported by volume. The prior fall in price was not supported by volume. The volume profile is bullish.
On Balance Volume is giving a reasonable bullish signal today with a break above the purple trend line.
RSI is close to neutral. There is plenty of room for price to rise or fall. There is no divergence today to indicate weakness in price.
ADX is increasing and the -DX line is above the +DX line. It is too early though to say ADX is indicating an upwards trend because it is less than 15.
ATR is not yet clearly increasing. It is overall flat. Bollinger Bands have been contracting. These indicators do not yet show an upwards trend has begun, so it may be assumed that the market is still consolidating.
Within the consolidation, an upwards swing may reasonably be expected to continue until price finds resistance about 1,375 and Stochastics reaches overbought at the same time. Stochastics is closing in on neutral and price is only about halfway to resistance.
During the consolidation, which began back on 7th of July, it is now five upwards days which have strongest volume. This signal is strong and clear. Gold is more likely to break out of this consolidation upwards than downwards. This trick usually works well for Gold.
This classic technical analysis today is strongly bullish and supports the Elliott wave count.
This analysis is published @ 7:12 p.m. EST.
It looks like minuette (iv) has arrived earlier than expected. This sideways movement is showing on the daily chart as a small range day (still green so far, that may change) so the proportion at the daily chart level looks good with minuette (ii).
The best way to see when / where minuette (iv) ends may be the lower edge of the green channel. If price touches that it should bounce up from there, from support.
When minuette (iv) is over then I can calculate a target for minuette (v) to end. I can’t do that until I know where it starts.
At this stage labelling of minuette (iv) is provisional. After some time on the five minute chart this labelling may change. It may be a zigzag or it may still morph into a triangle.
Minuette (ii) was a deep 0.80 combination. Minuette (iv) may be a more shallow zigzag or triangle to give best alternation.
Thanks for posting earlier.
Marc
Hi Lara,
Any chance you will be updating silver today?
Thanks,
Kyle
There is every chance. It will be done after I’ve had some lunch.
Hi Laura
Love your end of day summaries with the chart !
Normally the less talented of us lean on Alan for his take on where we might be in the count for the trading day.
Any chance of getting your end of day summary posted earlier say 15 min prior to 4 PM end of the trading day?
Thanks
Marc
Okay, will try to be more aware in my mornings of time.
I think I need to get up a little earlier. Today my teenager has the day off, so we all got up after seven 🙂
It really must wait until I’ve got at least one coffee in me though, otherwise I’m not going to be very onto it for you.
Thanks Laura
That hourly info update is much appreciated and so valuable?
Excellent! Thanks a bunch, enjoy your lunch!
Hi Lara
Any chance for GDX?
Thanks
Possibly.
Thanks Lara