
Upwards movement was expected for Friday.
Price moved sideways to complete a small inside day and a green candlestick.
Summary: The trend is still up. Monday may move mostly sideways; after a small consolidation is complete, then a new high is expected. Afterwards, another multi day pull back may begin next week. The long term target remains the same at 1,585.
New updates to this analysis are in bold.
Last weekly charts are here.
Grand SuperCycle analysis is here.
DAILY ELLIOTT WAVE COUNT
Click chart to enlarge.
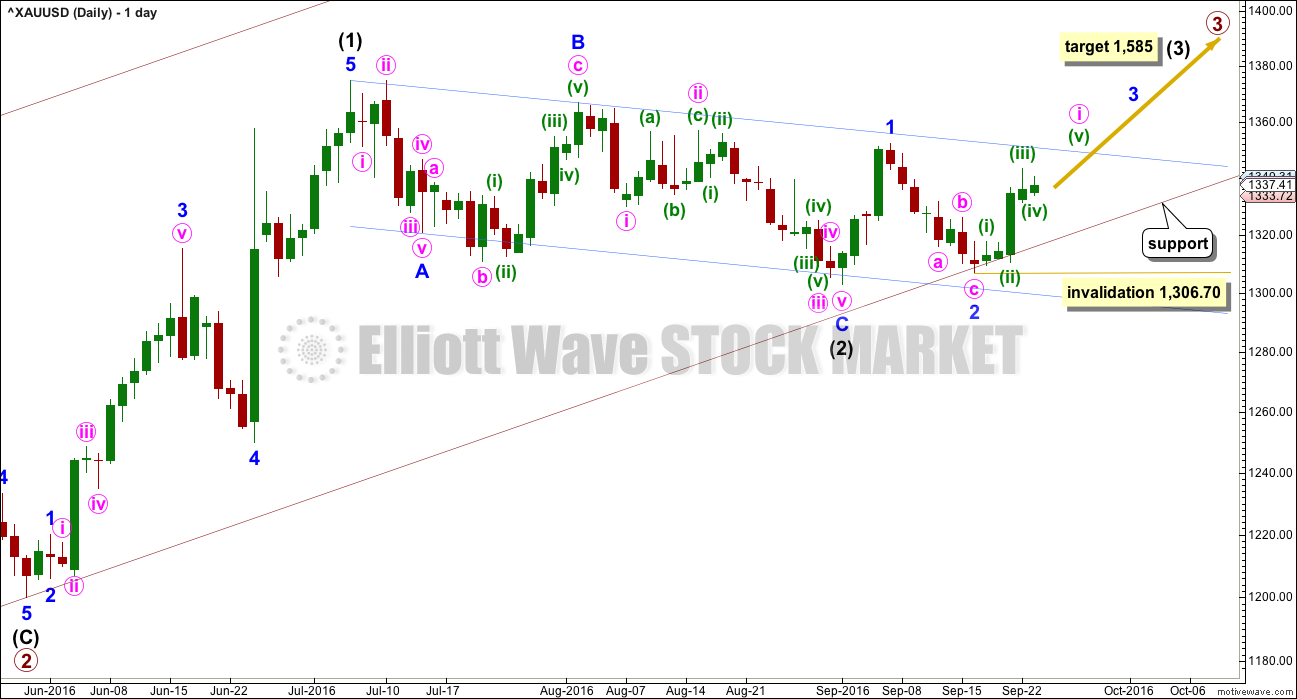
Primary waves 1 and 2 are complete. Thereafter, this wave count differs from the alternate.
This main wave count will expect primary wave 3 to be longer than primary wave 1. Because this is very common, this is the main wave count. It expects the most common scenario is most likely. At 1,585 intermediate wave (3) would reach 1.618 the length of intermediate wave (1).
Intermediate wave (2) may now be complete ending just below the 0.382 Fibonacci ratio of intermediate wave (1) and lasting 40 days.
When minute wave i upwards is complete, then another multi day pullback for minute wave ii should begin. Minute wave ii may not move beyond the start of minute wave i below 1,306.70.
Draw a channel about intermediate wave (2) using Elliott’s technique for a correction (blue lines). Price is finding some resistance on the way up about the upper edge. After breaking through resistance at the upper blue line price may then turn down to find support about there.
With this wave count expecting a third wave at two large degrees to begin, look out for surprises to the upside at this stage.
Intermediate wave (1) lasted 27 days and intermediate wave (2) lasted 40 days. Intermediate wave (3) may be reasonably expected to last longer than intermediate wave (1) in both time and price. A Fibonacci 55 days would be a first expectation. Intermediate wave (3) may end with a blowoff top.
The lower edge of the maroon base channel has proven to be providing strong support. Copy this over from weekly charts: draw a base channel from the start of a first wave to end end of the second wave, then place a parallel copy on the end of the first wave. In this case, the lower edge of the base channel is providing support. If price again comes down to touch it for another pullback, then it would provide an opportunity to join the trend at a very good price.
HOURLY ELLIOTT WAVE COUNT
Click chart to enlarge.
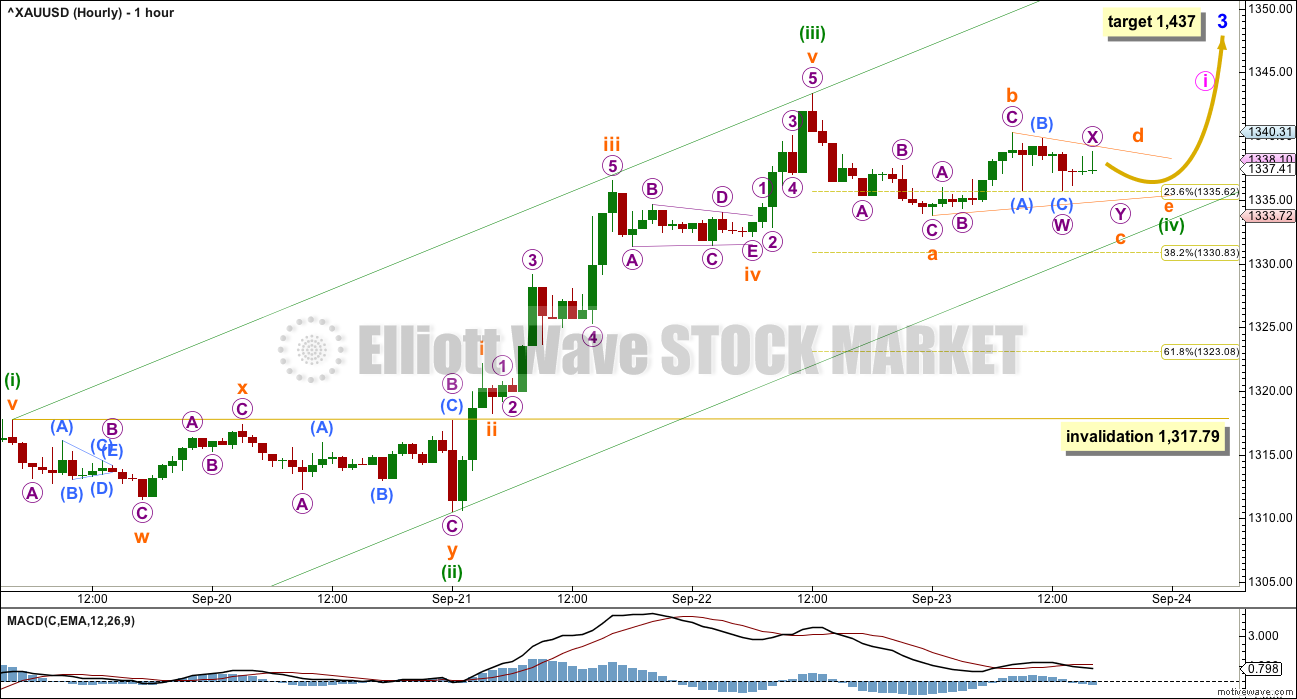
At 1,437 minor wave 3 would reach 2.618 the length of minor wave 1.
Minor wave 3 may only subdivide as an impulse. Within minor wave 3, the correction for minute wave ii is very likely to show up as a multi day pullback on the daily chart. First, minute wave i needs to complete.
Minute wave i must subdivide as a five wave structure. It is unfolding as an impulse. Within the impulse, the correction for minuette wave (ii) can be seen on the daily chart with smaller range days but no red daily candlesticks. Minuette wave (iv) may show on the daily chart as one red daily candlestick or doji. It may last more than one day, but is likely to be over relatively quickly. Minuette wave (iv) may not move into minuette wave (i) price territory below 1,317.79.
Minuette wave (ii) was a relatively deep 0.65 double combination. Given the guideline of alternation, minuette wave (iv) may be expected to most likely be a more shallow zigzag or triangle. It may also be a flat correction and still exhibit alternation in structure.
At this stage, minuette wave (iv) is labelled as a regular contracting or barrier triangle. This may be how it continues, or the triangle may be invalidated and minuette wave (iv) may turn out to be a zigzag or flat correction. The labelling within it may change as the structure unfolds. It is impossible to tell with certainty which structure minuette wave (iv) will be until it is complete.
If minuette wave (iv) is a regular contracting or barrier triangle as labelled, then within it subminuette wave d may not move reasonably above the end of subminuette wave b above 1,340.31. The triangle will remain valid as long as the b-d trend line remains essentially flat. Subminuette wave c may not move beyond the end of subminuette wave a below 1,333.73. If price moves sideways in an ever narrowing range, remaining between these price points, then a triangle would be most likely. If MACD flattens and hovers close to zero, then a triangle would be indicated.
When minuette wave (iv) is complete, then a target for minuette wave (v) upwards to complete the whole structure for minute wave i may be calculated. This cannot be done yet as it is not known where minuette wave (v) begins.
At this stage, the structure of minute wave i is still incomplete. Overall, it should be expected that price will continue to move higher to complete a five wave impulse for minute wave i. It may end in another one to three days.
At this stage, this wave count expects a third wave up at three large degrees to be in the early stages. Gold’s third waves often start out relatively slowly, building momentum towards the middle and exploding at the end. This allows plenty of opportunity to join the trend at the beginning, but only if traders have confidence in the trend. Buy the dips. Use corrections as opportunities to join the trend.
As always, never invest more than 3-5% of equity on any one trade. Always use a stop loss for all trades. Risk management is the difference between profit and loss, between traders who remain in the game and those who get wiped out.
ALTERNATE DAILY ELLIOTT WAVE COUNT
Click chart to enlarge.
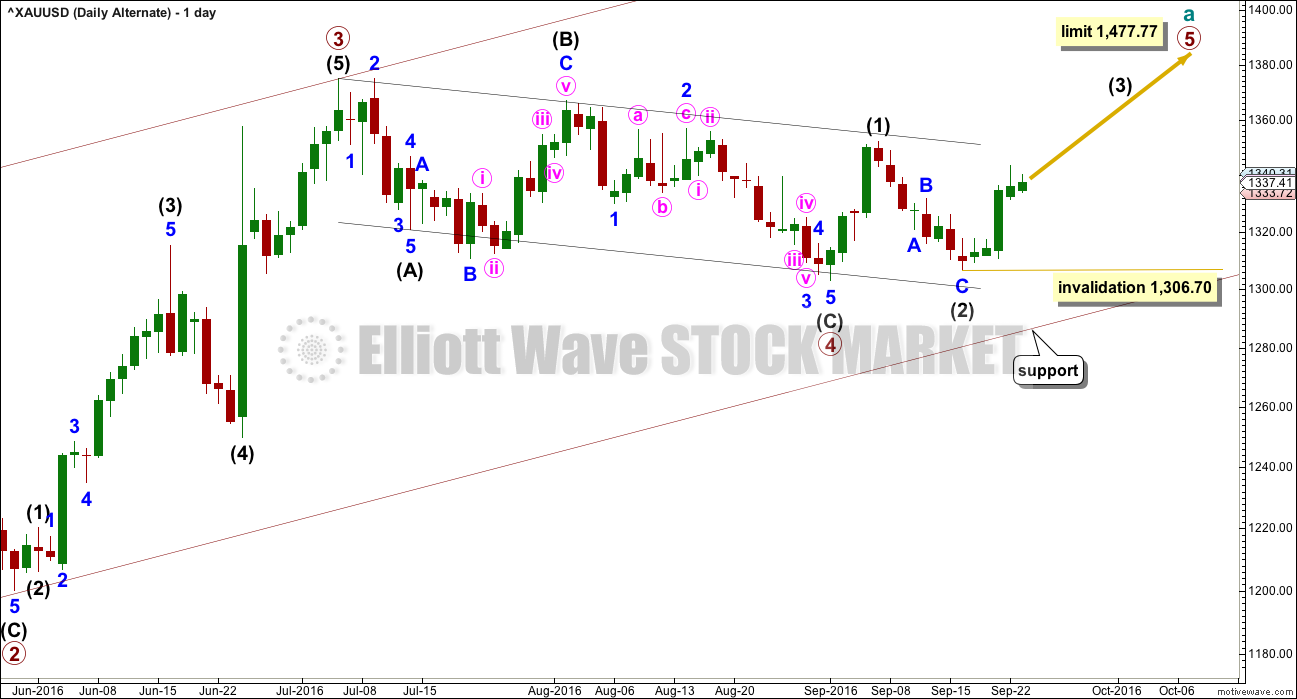
It is possible that primary wave 3 is over and shorter than primary wave 1. Primary wave 3 shows stronger volume than primary wave 1 (see technical analysis weekly chart).
If primary wave 3 is over, then the current consolidation for Gold would be primary wave 4.
Primary wave 2 was a relatively shallow 0.35 expanded flat correction. Primary wave 4 may be a deeper zigzag which would exhibit perfect alternation.
Within primary wave 5, no second wave correction may move beyond the start of its first wave below 1,302.93.
Primary wave 5 would be limited to no longer than equality in length with primary wave 3, so that the core Elliott wave rule stating a third wave may not be the shortest is met. Primary wave 5 would have a limit at 1,477.77.
The hourly chart would be exactly the same.
TECHNICAL ANALYSIS
WEEKLY CHART
Click chart to enlarge. Chart courtesy of StockCharts.com.
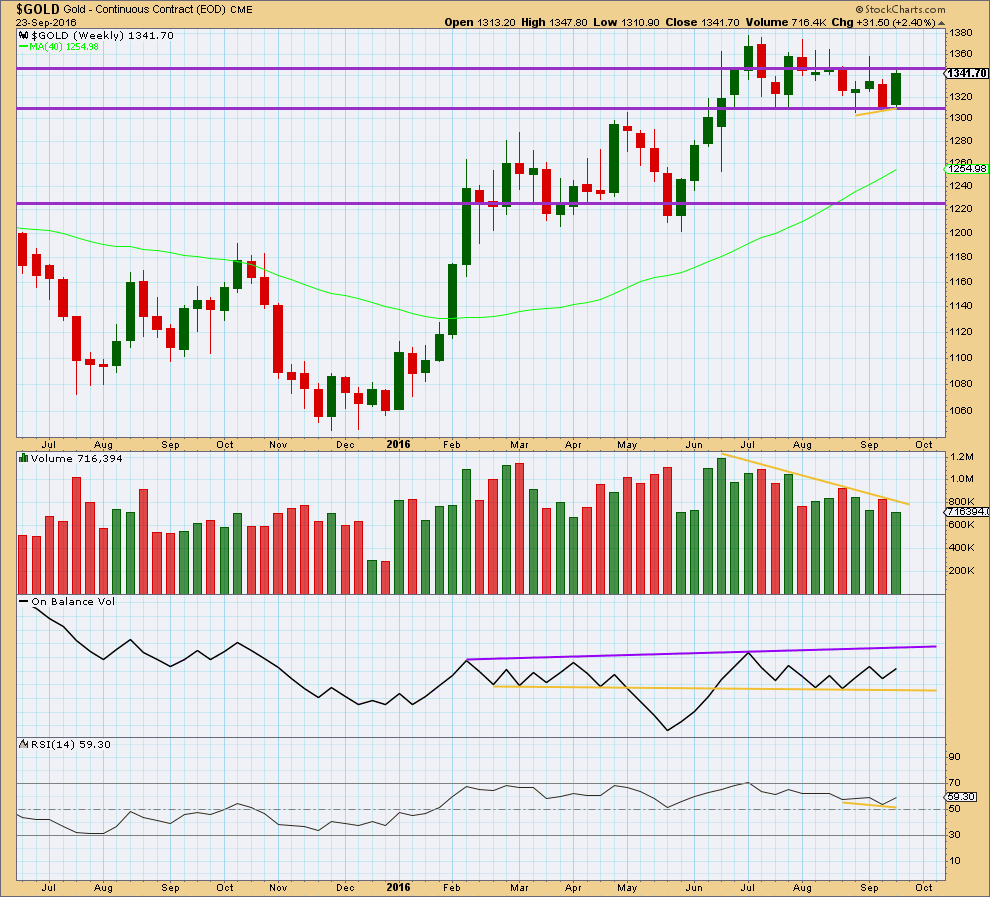
This week completes a bullish engulfing candlestick pattern, but it is not supported by volume. To see more clearly what is happening for volume this week we’ll look at daily volume.
Price may find some resistance about 1,345.
On Balance Volume is still bullish at the weekly chart level.
At the weekly chart level, RSI is still not extreme. There is room for price to rise or fall. There is no divergence between price and RSI to indicate weakness.
DAILY CHART
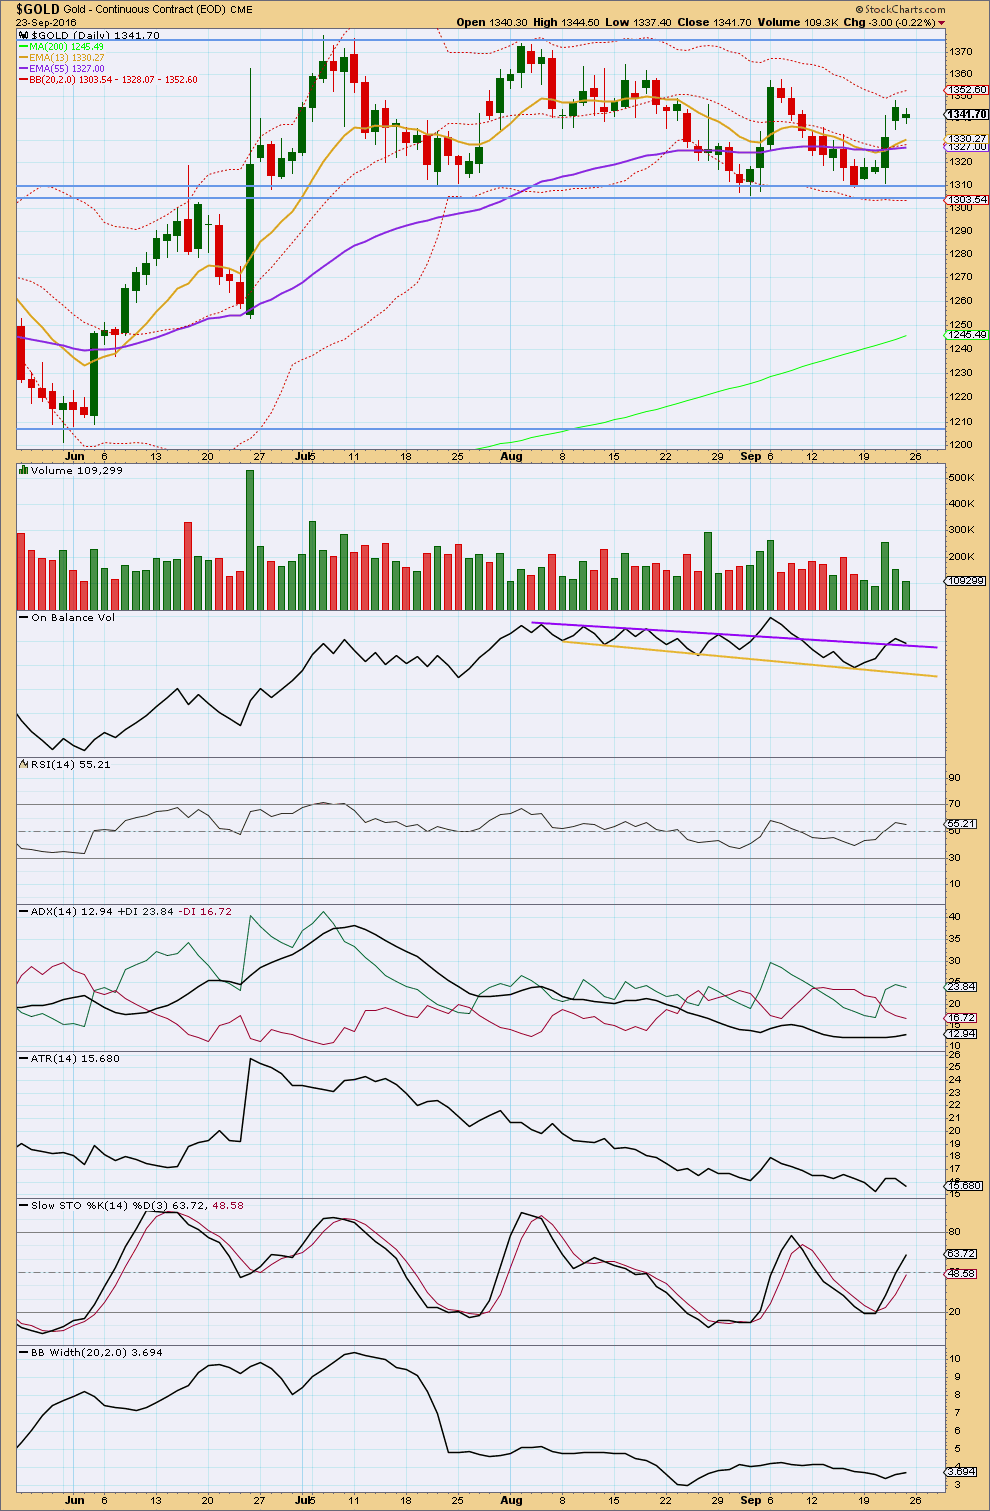
Click chart to enlarge. Chart courtesy of StockCharts.com.
StockCharts have changed volume data for the 22nd of September. It is now much lighter.
The last two green daily candlesticks come with a decline and now very light volume. The rise in price is not supported by volume. This suggests a pullback is imminent.
The bullish signal from On Balance Volume is still valid with a break above the purple line, which provided resistance. This line may now provide support, and suggests that sideways movement from price for Friday’s session may continue rather then turning into downwards movement as OBV provides support and holds up price. This supports the idea of a triangle unfolding on the hourly chart.
RSI is just above neutral. There is room for price to rise or fall.
ADX is still increasing but is not yet over 15. If it reaches 15 and the +DX line is still above the -DX line, then it would be indicating an upwards trend is in place. For now ADX is indicating the market is not yet trending. ATR agrees at the end of this week as it is declining.
If this market is still consolidating, then an upwards swing would be a reasonable expectation from here. It should be expected to continue until price finds resistance about 1,375 and Stochastics reaches overbought at the same time. Price may not be reasonably expected to move from support to resistance in a straight line though; price just does not behave like that. Price may move in choppy overlapping movement, generally trending upwards.
Stochastics is still not overbought.
Bollinger Bands are still contracted for this week. Volatility has not yet returned to this market.
It is now only four upwards days which have strongest volume during this consolidation. This still strongly suggests that the breakout is more likely to be upwards than downwards, and it still strongly supports the Elliott wave count.
This analysis is published @ 11:32 p.m. EST.
Sentiment Speaks: After The Fed, Everyone Is Getting Bullish On Gold Again – Should You? – Sep. 26, 2016 1:23 AM EST – Avi Gilburt – EW
http://seekingalpha.com/article/4008341-sentiment-speaks-fed-everyone-getting-bullish-gold
“At this point in time, I believe the predominance of the evidence suggests that lower levels will be seen, and it would take GDX to move strongly through 29.10 and silver to move strongly through 20.91 to have me reconsidering my short-term bearish thesis. And, if we see follow-through with silver breaking out over the August high, GDX breaking out over 31 and GLD breaking out over 132, then I will be forced to take a much more immediate bullish stance on the metals complex, which was outlined in my article last weekend.”
The triangle was invalidated, minuette (iv) may be a zigzag. That still gives good alternation with the combination of minuette (ii).
The whole move up so far is forming a nice five wave impulse look. Minuette (ii) and (iv) can both just be seen on the daily chart, the proportions are good, it’s fitting nicely within an Elliott channel. So far.
Risk today: minuette (v) could possibly be over, but it would be truncated by 1.66. While this is possible in that many things are possible, it must be judged to have a low probability.
Which means it’s more likely that minuette (v) will move higher.
I think minuette (iv) is now over and minuette (v) is underway. If this is correct then price really should find support at the lower edge of this channel. The fact that it is breaking down indicates either I’m wrong and minuette (iv) isn’t over, or minuette (v) is complete and truncated.
Hi Laura
Do you still think 5th up coming yet?
Yes.
The long green/white candle on Wednesday came in after 10 days instead three days. Still very bullish.
Small bodies (candles) between two tall candles is very bullish candlesticks chart pattern (Steve Nison).
Lara’s main wave count is right on track.
Thanks Lara.
You’re welcome 🙂
With a low below 1333.73 the hourly char showing a triangle is invalidated ?
Yes.
GUNNER24 Forecasts Gold working like clockwork
http://www.gunner24.com/newsletter/nl-092516/
Good read. He makes a good case for one more move down in October. Time will tell…
What is this method of technical analysis ?.
Gunner ?
I dint find it realistic…he is making arc n all. Calling bottoms and tops without any classical technical analysis ?. Its looking like a technical myth.
The arc is a part of a Gann square. Actually quite reliable and fascinating.
This chart courtesy of FullGoldCrown shows Gold and Indu correlation periods since 1995. It looks like we may be in a 4 year or longer POSITIVE correlation period that started in early 2015.
Big moves coming soon…
So this is interesting. Precious Metals, Oil, Stocks, and USD are all wedging toward a breakout. I threw in the German DAX for an international perspective. So which way do they all break?
I don’t know, but here are some thoughts:
Stocks and Gold have been positively correlated since early 2015. Both will likely break in the same direction.
EW patterns predict a continued move up in both Gold and Stocks.
GDX and Oil look like they may be giving us a clue that the breakout will be upward? They both show one break already of a downtrend line and a possible false break downwards.
So overall, no clear directional answer, but we should know soon.
All charts are daily in log scale.
Lara, others, any thoughts?
I have been noticing the same. Exciting week ahead. I think the USD will be the one to follow. If it breaks down, the rest should go up.
I am quite new to EW, but this is what USD is looking to me:
Probably some mistakes here, but 5 times touching of the triangle usually mean something, no? 😉
Here’s the GDX hourly look. If this count is correct, Minuette 4 needs to stay above 26.41. We should see a move up Monday.
An invalidation below 26.41 may mean that a triangle is forming and that Cycle wave x is incomplete.
Thank you very much for the update Dreamer.
I hope you are having a really awesome weekend 🙂 Plenty of rest and relaxation
Thanks Lara. Hope you are having a nice relaxing weekend also!
The move down in GDX the last two days has been much stronger and deeper than gold.
That said, so far the move down is on low volume and it looks like a nice back test of the breakout.
The next move is expected to be up; however, if GDX breaks the downtrend support line and moves down to the next uptrend support line, then I would suspect that a triangle may be forming. This would mean that Cycle wave x would be incomplete. This can be addressed further if it plays out.