
Mostly sideways movement was expected for Monday.
A green daily doji candlestick fits expectations perfectly.
Summary: The short term target is at 1,344. The next daily candlestick is expected to be green, and this is supported by a bullish signal today from On Balance Volume. Thereafter, another multi day pullback may begin. The long term target remains the same at 1,585.
New updates to this analysis are in bold.
Last weekly charts are here.
Grand SuperCycle analysis is here.
DAILY ELLIOTT WAVE COUNT
Click chart to enlarge.
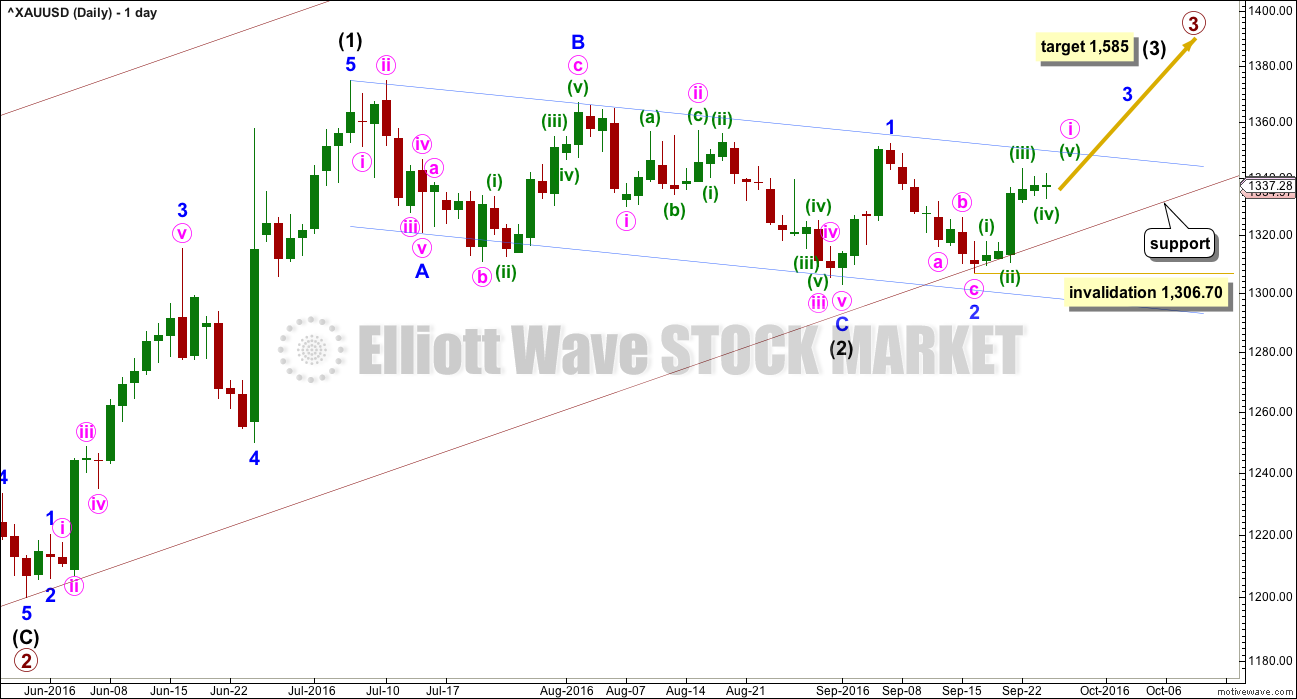
Primary waves 1 and 2 are complete. Thereafter, this wave count differs from the alternate.
This main wave count will expect primary wave 3 to be longer than primary wave 1. Because this is very common, this is the main wave count. It expects the most common scenario is most likely. At 1,585 intermediate wave (3) would reach 1.618 the length of intermediate wave (1).
Intermediate wave (2) may now be complete ending just below the 0.382 Fibonacci ratio of intermediate wave (1) and lasting 40 days.
When minute wave i upwards is complete, then another multi day pullback for minute wave ii should begin. Minute wave ii may not move beyond the start of minute wave i below 1,306.70. Minute wave i may end close to the upper blue trend line. Minute wave ii may end when price touches the lower maroon trend line.
Draw a channel about intermediate wave (2) using Elliott’s technique for a correction (blue lines). Price is finding some resistance on the way up about the upper edge. After breaking through resistance at the upper blue line price may then turn down to find support about there.
With this wave count expecting a third wave at two large degrees to begin, look out for surprises to the upside at this stage.
Intermediate wave (1) lasted 27 days and intermediate wave (2) lasted 40 days. Intermediate wave (3) may be reasonably expected to last longer than intermediate wave (1) in both time and price. A Fibonacci 55 days would be a first expectation. Intermediate wave (3) may end with a blowoff top.
The lower edge of the maroon base channel has proven to be providing strong support. Copy this over from weekly charts: draw a base channel from the start of a first wave to end end of the second wave, then place a parallel copy on the end of the first wave. In this case, the lower edge of the base channel is providing support. If price again comes down to touch it for another pullback, then it would provide an opportunity to join the trend at a very good price.
HOURLY ELLIOTT WAVE COUNT
Click chart to enlarge.
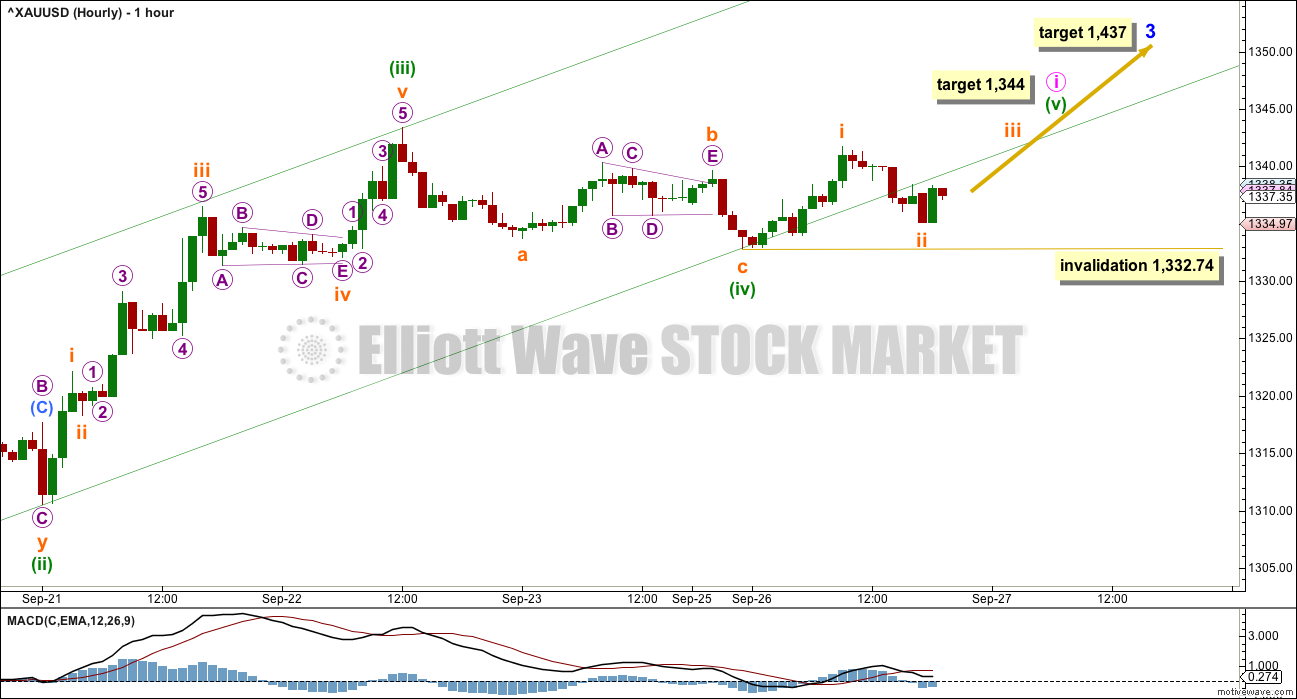
At 1,437 minor wave 3 would reach 2.618 the length of minor wave 1.
Minor wave 3 may only subdivide as an impulse. Within Minor wave 3, minute wave i is close to completion.
Within minute wave i, the correction for minuette wave (ii) was a relatively deep 0.65 double combination. Minuette wave (iv) may now be a complete shallow 0.32 zigzag exhibiting perfect alternation.
There is no Fibonacci ratio between minuette waves (i) and (iii). This makes it more likely that minuette wave (v) will exhibit a Fibonacci ratio to either of minuette waves (i) or (iii). The most common ratio for a fifth wave is equality in length with the first wave. This gives a target for minuette wave (v) at 1,344.
The target would see minute wave i end just short of the blue channel on the daily chart. It may end in one more session. Short term swing traders may take profits in one more session. Position traders may prefer to hold on.
When minute wave i is a completed five wave impulse, then a multi day pullback for minute wave ii may begin. Minute wave ii should end if price again comes down to touch the lower maroon channel on the daily chart. If that happens, it would provide an excellent opportunity to join the trend at a good price.
As always, invest no more than 3-5% of equity on any one trade and always use a stop loss for all trades.
It is somewhat concerning that price has broken below the lower edge of the Elliott channel. Channels do not always work perfectly, so this breach does not invalidate the wave count. If the invalidation point at 1,332.74 is breached prior to a new high, then it would be possible that minute wave i is over earlier than expected and minute wave ii may have begun a day earlier than expected.
Within minuette wave (v), the correction for subminuette wave ii may not move beyond the start of subminuette wave i below 1,332.74.
ALTERNATE DAILY ELLIOTT WAVE COUNT
Click chart to enlarge.
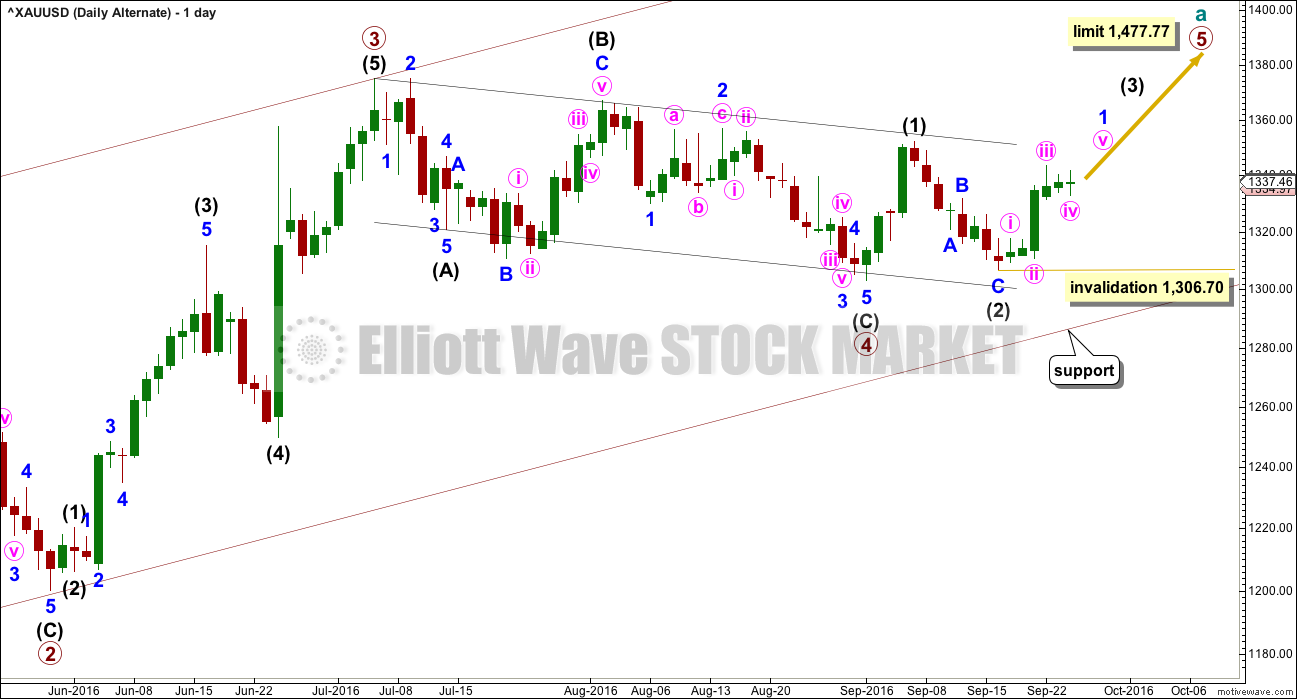
It is possible that primary wave 3 is over and shorter than primary wave 1. Primary wave 3 shows stronger volume than primary wave 1 (see technical analysis weekly chart).
If primary wave 3 is over, then the current consolidation for Gold would be primary wave 4.
Primary wave 2 was a relatively shallow 0.35 expanded flat correction. Primary wave 4 may be a deeper zigzag which would exhibit perfect alternation.
Within primary wave 5, minor wave 2 may move beyond the start of minor wave 1 below 1,306.70.
Primary wave 5 would be limited to no longer than equality in length with primary wave 3, so that the core Elliott wave rule stating a third wave may not be the shortest is met. Primary wave 5 would have a limit at 1,477.77.
The hourly chart would be exactly the same.
TECHNICAL ANALYSIS
WEEKLY CHART
Click chart to enlarge. Chart courtesy of StockCharts.com.
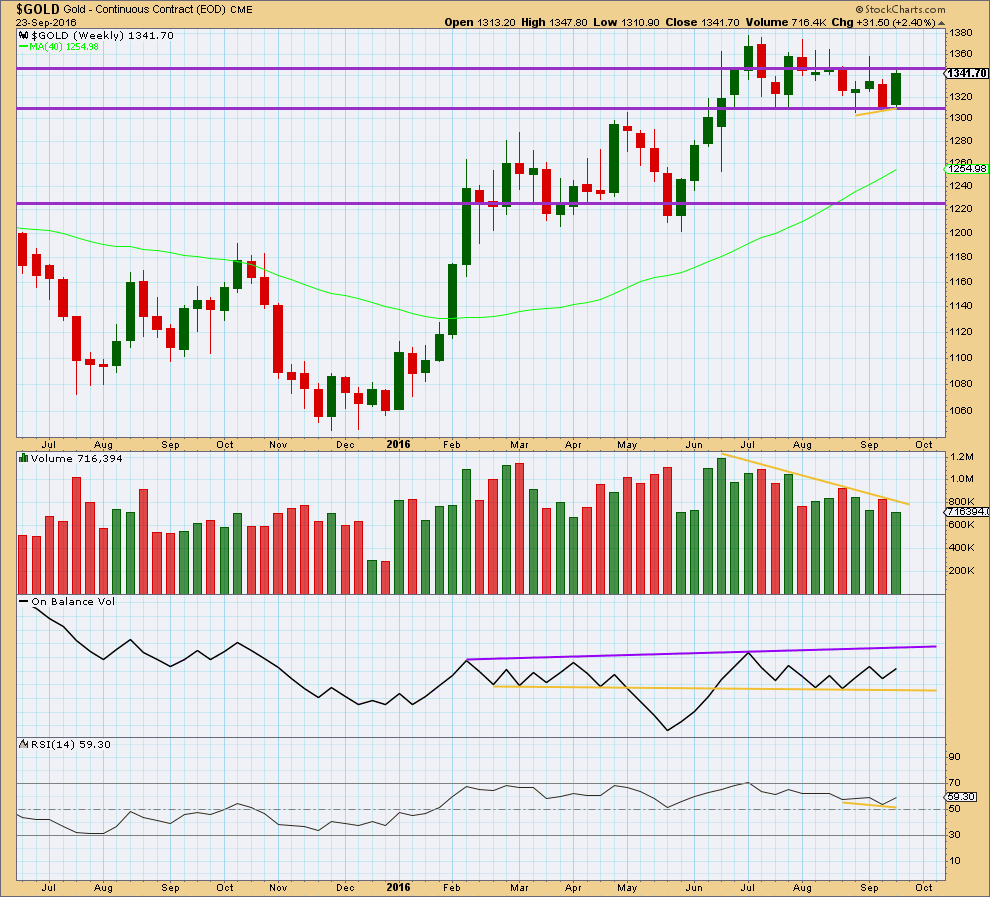
Last week completes a bullish engulfing candlestick pattern, but it is not supported by volume. To see more clearly what is happening for volume last week we’ll look at daily volume.
Price may find some resistance about 1,345.
On Balance Volume is still bullish at the weekly chart level.
At the weekly chart level, RSI is still not extreme. There is room for price to rise or fall. There is no divergence between price and RSI to indicate weakness.
DAILY CHART
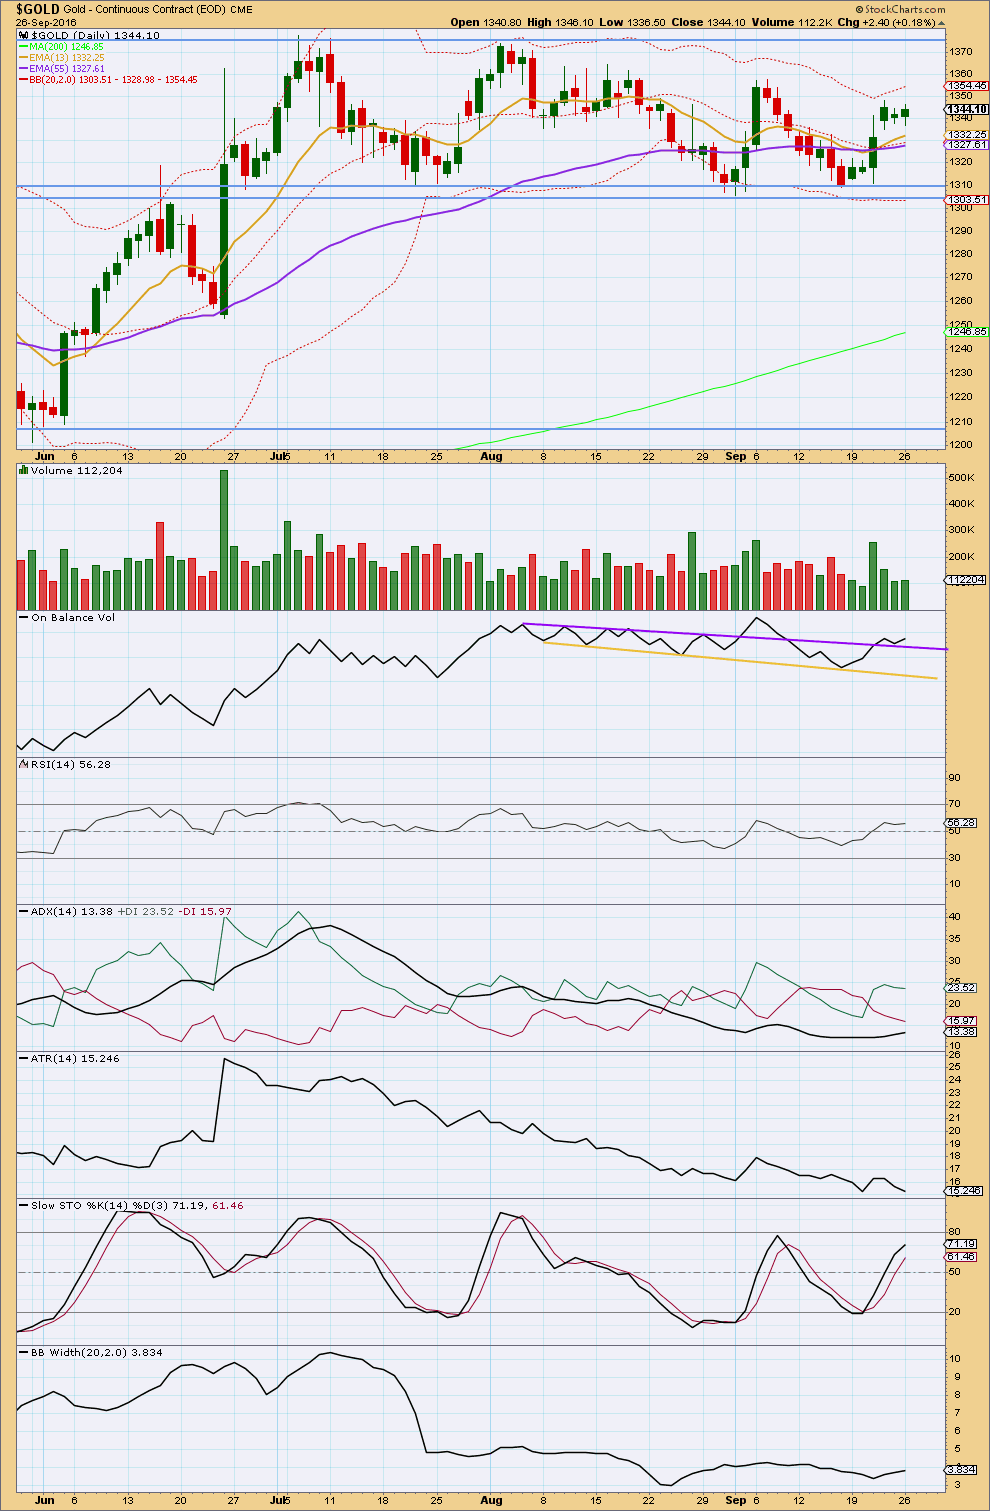
Click chart to enlarge. Chart courtesy of StockCharts.com.
Gold remains range bound with resistance about 1,375 and support about 1,310 – 1,305. During this consolidation, it is four upwards days that have strongest volume suggesting an upwards breakout is more likely than downwards.
The last three days of green candlesticks come with higher and overall declining volume. The rise in price is not supported by volume. Another pullback may be the result short term and this fits reasonably well with expectations for the Elliott wave count.
On Balance Volume gave a bullish signal with a break above the purple line. Now it gives another bullish signal with a test of support at the line as it now moves up and away from the line.
RSI is close to neutral. There is room for price to rise, or fall. There is no divergence today between price and RSI to indicate weakness.
ADX is rising but is still not above 15. It is not yet indicating a new upwards trend. The market is still consolidating.
Stochastics is nearing overbought but is not quite there yet. One or two more days of overall upwards movement may bring it closer, then this upwards swing may be ready to end. Price may find resistance at another point within the consolidation, about 1,355 where the last small upwards swing ended.
Bollinger Bands remain tightly contracted. This market may not yet be trending.
The longer term trend remains up. The 200 day moving average is still pointing up and price is above it. The mid term Fibonacci 55 day moving average is still pointing up and is above the longer term average. The short term Fibonacci 13 day moving average is now moving up from the mid term average, and the short term trend is also up (within the larger consolidation).
This analysis is published @ 08:42 p.m. EST.
This is what I have so far this morning. To avoid a truncated fifth wave at the end of minute i I’m adjusting labelling within it as per Alan’s idea below.
This would have a higher probability than a truncation.
It makes an important material difference to the wave count. Now minute ii looks like a three and has lasted so far three days. Target at 1,320.71 may be met in one more session
Lara thanks for your comment and chart it is a masterpiece in and of itself.
You leave your customers inspired with awe and your competitors in the dust.
Gold miner bullish % is near previous buy range
The invalidation point at 1,332.74 was breached on the hourly chart and minute wave ii may have begun a day earlier than expected. When minute wave i is a completed five wave impulse, then a multi day pullback for minute wave ii may begin. Minute wave ii should end if price again comes down to touch the “lower maroon channel on the daily chart”.
The maroon channel on the daily chart is at about 1,320 – 1,318.
As per Lara’s data feed barchart.com and %5EXAUUSD symbol for gold, the low today is at 1,325.90 at about 10:30 am
http://www.barchart.com/chart.php?sym=%5EXAUUSD&style=technical&template=&p=I&d=L&im=&sd=&ed=&size=M&log=0&t=BAR&v=0&g=1&evnt=1&late=1&o1=&o2=&o3=&sh=100&indicators=&addindicator=&submitted=1&fpage=&txtDate=#jump
I think the probability is increasing that GDX is forming a triangle. If so, it may go down to around 26 by tomorrow before a stronger bounce. Both recent moves up on the daily chart look like 3 wave structures although they could be a 3 or a 5 on the hourly, hence the confusion.
Even gold could be forming a triangle on the daily chart.
Dreamer great call on the GDX low of $26.00 it bounced up at $26.01 at 11:50 am.
Oil prices slide more than 2% after Iran, Saudis douse hopes for output deal
Published: Sept 27, 2016 8:46 a.m. ET
http://www.marketwatch.com/story/oil-prices-lower-after-iran-douses-hopes-for-production-deal-2016-09-27?mod=MW_story_top_stories
Recently, I commented about making a profitable trade last week. As a confession, I didn’t lock in the profits and was hopeful gold would possibly touch 1360, 1350, and lastly 1344. GDX and NUGT didn’t follow and dropped. With gold reaching below 1330 this morning, Minute 2 has begun… invalidation point reached.
It looks like gold wants to touch the maroon support line this morning… around 1324. Just wondering if there may be a bounce today. Also, is there any chance Minute 2 could end early?
Surprisingly, I was thinking that the debate would add more uncertainty and help support gold.
Thanks!
I think more volatility coming this week because Fed speakers I believe will add more bitterness. Everything good we can expect from Fed already obsorbed by gold moved a little up on a news of keeping rates same last week. We don’t have that move up anymore, we are down where we start. Now same pattern moving lower. I believe gold moves according market sentiment at this time and big dogs manipulation.
Thanks for your comments Slava!
Other than Fed speaker rhetoric, I think we need some economic data that indicates December rate hikes are unlikely. Maybe the GDP numbers being reported on Thursday at 8:30 can trigger support for gold.
In reviewing Dreamer’s GDX chart that he shared last week, price went below the Minuette 4 invalidation point of 26.41… dropped to 26.31, but has been able to stay above this level since early this morning. Fortunately, the stock market is green today which helps to support GDX values.
Thanks for data clue. I didn’t know GDX report Thursday, hope it will boost a little, but overall, Im not optimist. Its pure speculation at this point out of any rules. Does anyone knows bull and bearish ratio for commercials at this moment? Not useless indicators. It triggers sell of on miners before Direxions ETFs split with massive dump from Europe. Bulls were over 80% on gold at that moment and normal its a good signal for turn trend. Since we have been at down trend for a while and everyone talking to buy bearish positions on miners and gold, when bearish positions nigh enough it will turn trend opposite way. I can’t afford to pay for data like this. But that would be a clue how far we are from turning point.
As the hourly chart got invalidated and this suggests that we may be heading south for wave 2.
Can anyone help me to understand the currnt movement is it a wave c of 2 or still wave a of 2.??
Alan,dreamer any count you have..?
Sorry Jimmy. Just finished dinner.
The drop below 1332.70 had certainly invalidated the continuing Minute 1 count. I can see three possibilities:
(1) Minute 1 had completed at the high of 1341.70 reached at 0800 yesterday, yielding a slight truncation.
The ensuing ABC correction is Minute 2. We are currently in the “C” which might target 0.618 Minute 1, ending at 1320.07. (By the way, I have changed to BarChart data because pmbull had unwisely changed its source provider from ProRealTime to Oanda, and the latter does not give price values at an easy glance).
If I consider Minute 2 data, then the correction target will be 1324.66, Fib 1.618.
(2) Minute 4 of the alternate had transformed into an ABC, and the ending scenario is the same as Minute 2 of possibility (1). When Minute 4 ends, then it will rise in Minute 5 of Minor 1.
(2) I had, at the back of my mind for the past 3 days that, Minute 1 completed at 1343.40, which Lara labelled minuette 3 of Minute 1. I actually based my trades on that. This count produces a beautiful ABC lasting 3 trading days so far. It also results in the near completion of the “C” wave today. Target 1320.72, 0.618 Fib of Minute 1. Alternative 1324.39 @ 1.618 minuette a.
The commonality is that a low is being targeted.
Hi Alan – Amazing call! Gold bounced right off the levels you mentioned. When you finish dessert… hahaha, any chance you might be able to advise if Minute 2/ Minute 4 (Alternate) reached its low for good or do you see another low coming as the Minuettes unfold?
Dreamer – A great call by you too with GDX at 26 and a bounce, thereafter.
Thanks for you input!
Hey thnx alan
I’m charting your idea Alan that minute i ended earlier at the high.
It looks pretty good.
As you note, if that’s the case minute ii now is in it’s third day and has a three wave look to it on the daily and hourly charts.
Because this avoids a truncation, and it follows a common tendency for Gold to have quicker fourth waves than it’s second, I’m going to change my wave count to this today.
Minute i lasted four days. So far minute ii is in it’s third day. Target for it to end is 1320.71, the 0.618 Fibonacci ratio of minute wave i.
If it ends in one more day it will be equal in duration with minute i.
I’m unsure the way gold may move due to the 9:00 pm EST US Presidential Debate tonight starting right now on CNN, the first face to face televised debate between Hillary Clinton and Donald Trump, which may be watched by 100 Million viewers.