
Upwards movement was expected for Tuesday’s session. This is not what happened.
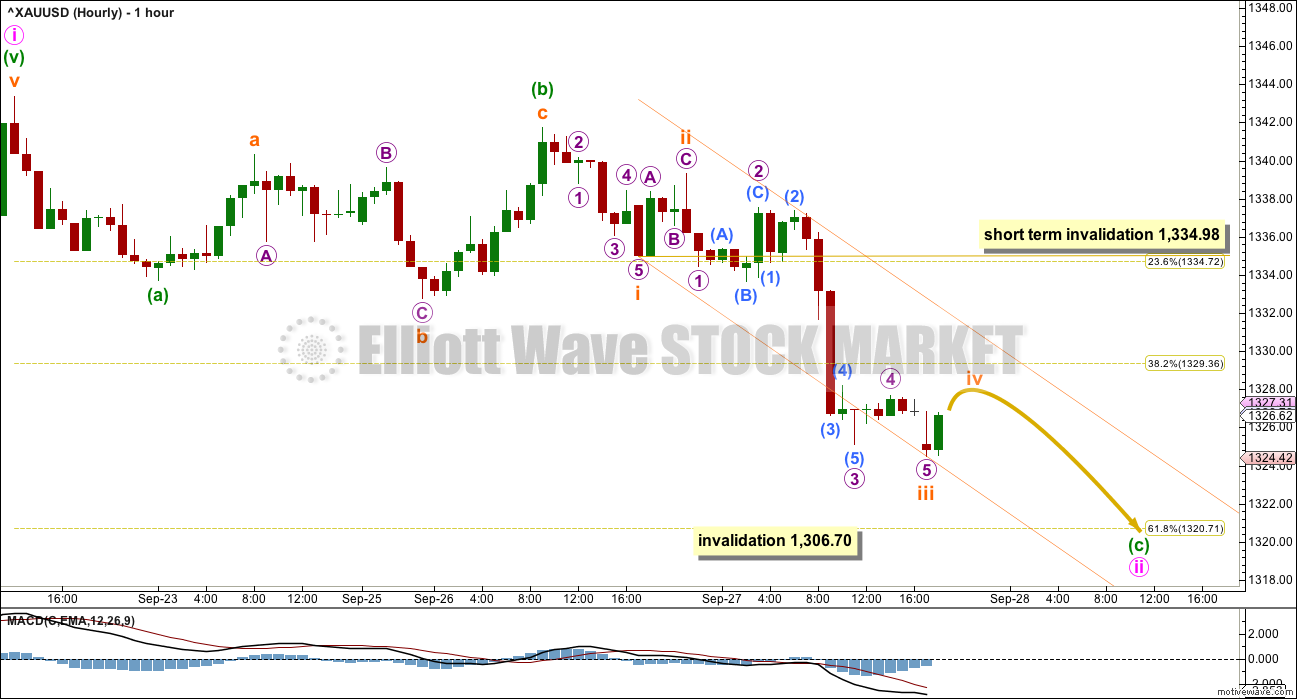
The hourly wave count was invalidated with a new low below 1,332.74. A multi day pullback has begun a day earlier than expected.
Summary: This pullback may end in one more session about 1,320.71. The long term target remains the same at 1,585.
New updates to this analysis are in bold.
Last weekly charts are here.
Grand SuperCycle analysis is here.
DAILY ELLIOTT WAVE COUNT
Click chart to enlarge.
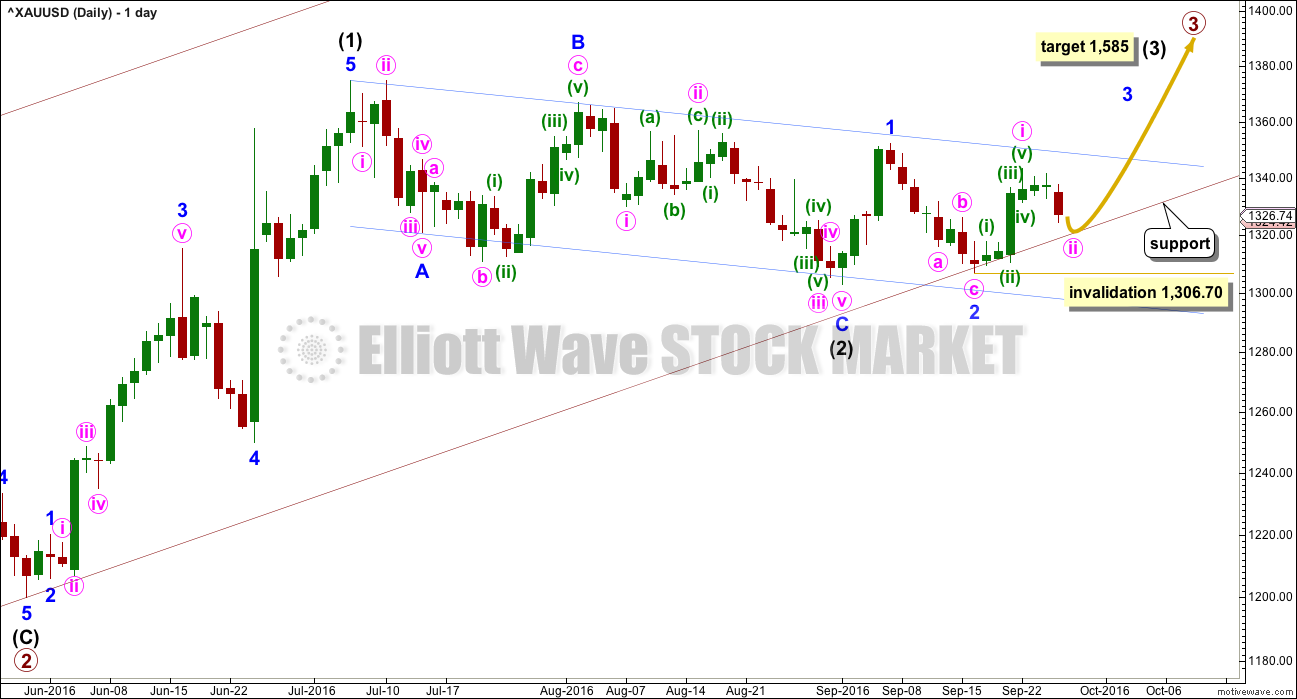
Primary waves 1 and 2 are complete. Thereafter, this wave count differs from the alternate.
This main wave count will expect primary wave 3 to be longer than primary wave 1. Because this is very common, this is the main wave count. The most common scenario is most likely. At 1,585 intermediate wave (3) would reach 1.618 the length of intermediate wave (1).
Intermediate wave (2) may now be complete ending just below the 0.382 Fibonacci ratio of intermediate wave (1) and lasting 40 days.
A multi day pullback for minute wave ii has begun and is probably close to ending. Minute wave ii may not move beyond the start of minute wave i below 1,306.70. Minute wave ii may end when price touches the lower maroon trend line.
Draw a channel about intermediate wave (2) using Elliott’s technique for a correction (blue lines). Price is finding some resistance on the way up about the upper edge. After breaking through resistance at the upper blue line price may then turn down to find support about there.
With this wave count expecting a third wave at two large degrees to begin, look out for surprises to the upside at this stage.
Intermediate wave (1) lasted 27 days and intermediate wave (2) lasted 40 days. Intermediate wave (3) may be reasonably expected to last longer than intermediate wave (1) in both time and price. A Fibonacci 55 days would be a first expectation. Intermediate wave (3) may end with a blowoff top.
The lower edge of the maroon base channel has proven to be providing strong support. Copy this over from weekly charts: draw a base channel from the start of a first wave to end end of the second wave, then place a parallel copy on the end of the first wave. In this case, the lower edge of the base channel is providing support. If price again comes down to touch it for another pullback, then it would provide an opportunity to join the trend at a very good price. Risk to long positions is at 1,306.70. Always use a stop loss for all trades, and do not invest more than 3-5% of equity on any one trade.
HOURLY ELLIOTT WAVE COUNT
Click chart to enlarge.
At 1,437 minor wave 3 would reach 2.618 the length of minor wave 1.
Minor wave 3 may only subdivide as an impulse. Within Minor wave 3, minute wave i is complete and minute wave ii is now close to completion. This downwards movement is now too deep and long lasting to be a smaller correction within minute wave i.
Minute wave ii so far fits as a zigzag, and would most likely end close to the 0.618 Fibonacci ratio of minute wave i at 1,320.71. At 1,316 minuette wave (c) would reach 2.618 the length of minuette wave (a). This is reasonably close to the 0.618 Fibonacci ratio, and so if price moves below 1,320 it may end closer to 1,316.
Minuette wave (c) must subdivide as a five wave structure. Within minuette wave (c), subminuette wave iv may not move into subminuette wave i price territory above 1,334.98.
Subminuette wave iv should be over quickly, and is most likely to end within the price range of the fourth wave of one lesser degree. Micro wave 4 has its range from 1,325.13 to 1,327.69.
Subminuette wave v is very likely to make at least a slight new low below the end of subminuette wave iii at 1,324.48 to avoid a truncation.
This structure could be complete after one more low. Thereafter, a clear breach of the small channel with upwards (not sideways) movement would provide trend channel indication of a trend change.
The orange channel is a best fit about minuette wave (c).
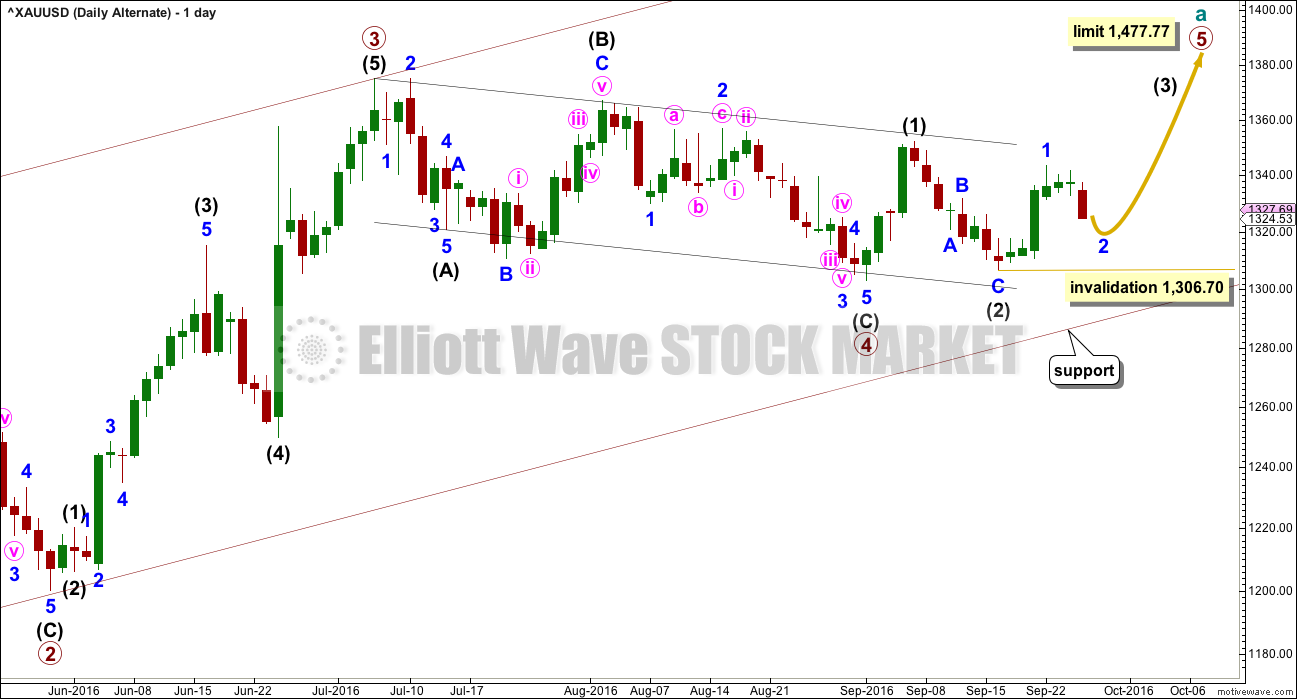
ALTERNATE DAILY ELLIOTT WAVE COUNT
Click chart to enlarge.
It is possible that primary wave 3 is over and shorter than primary wave 1. Primary wave 3 shows stronger volume than primary wave 1 (see technical analysis weekly chart).
If primary wave 3 is over, then the current consolidation for Gold would be primary wave 4.
Primary wave 2 was a relatively shallow 0.35 expanded flat correction. Primary wave 4 may be a deeper zigzag which would exhibit perfect alternation.
Within primary wave 5, minor wave 2 may move beyond the start of minor wave 1 below 1,306.70.
Primary wave 5 would be limited to no longer than equality in length with primary wave 3, so that the core Elliott wave rule stating a third wave may not be the shortest is met. Primary wave 5 would have a limit at 1,477.77.
The hourly chart would be exactly the same.
TECHNICAL ANALYSIS
WEEKLY CHART
Click chart to enlarge. Chart courtesy of StockCharts.com.
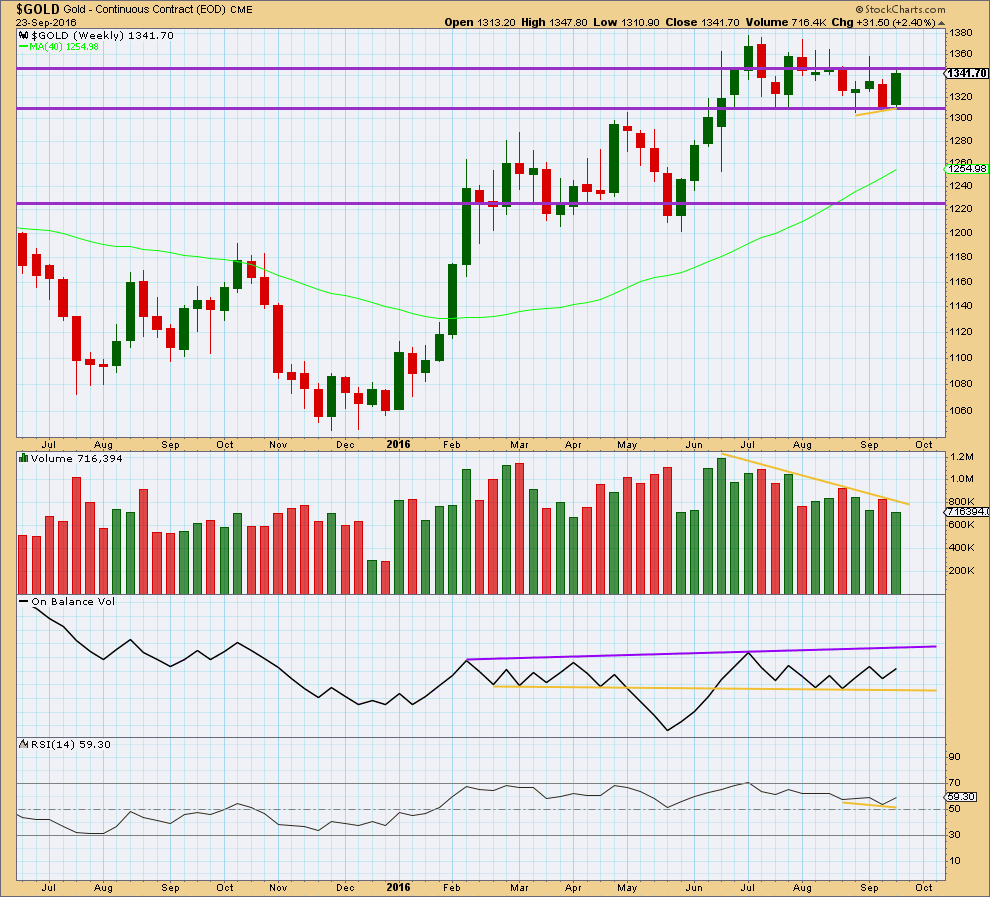
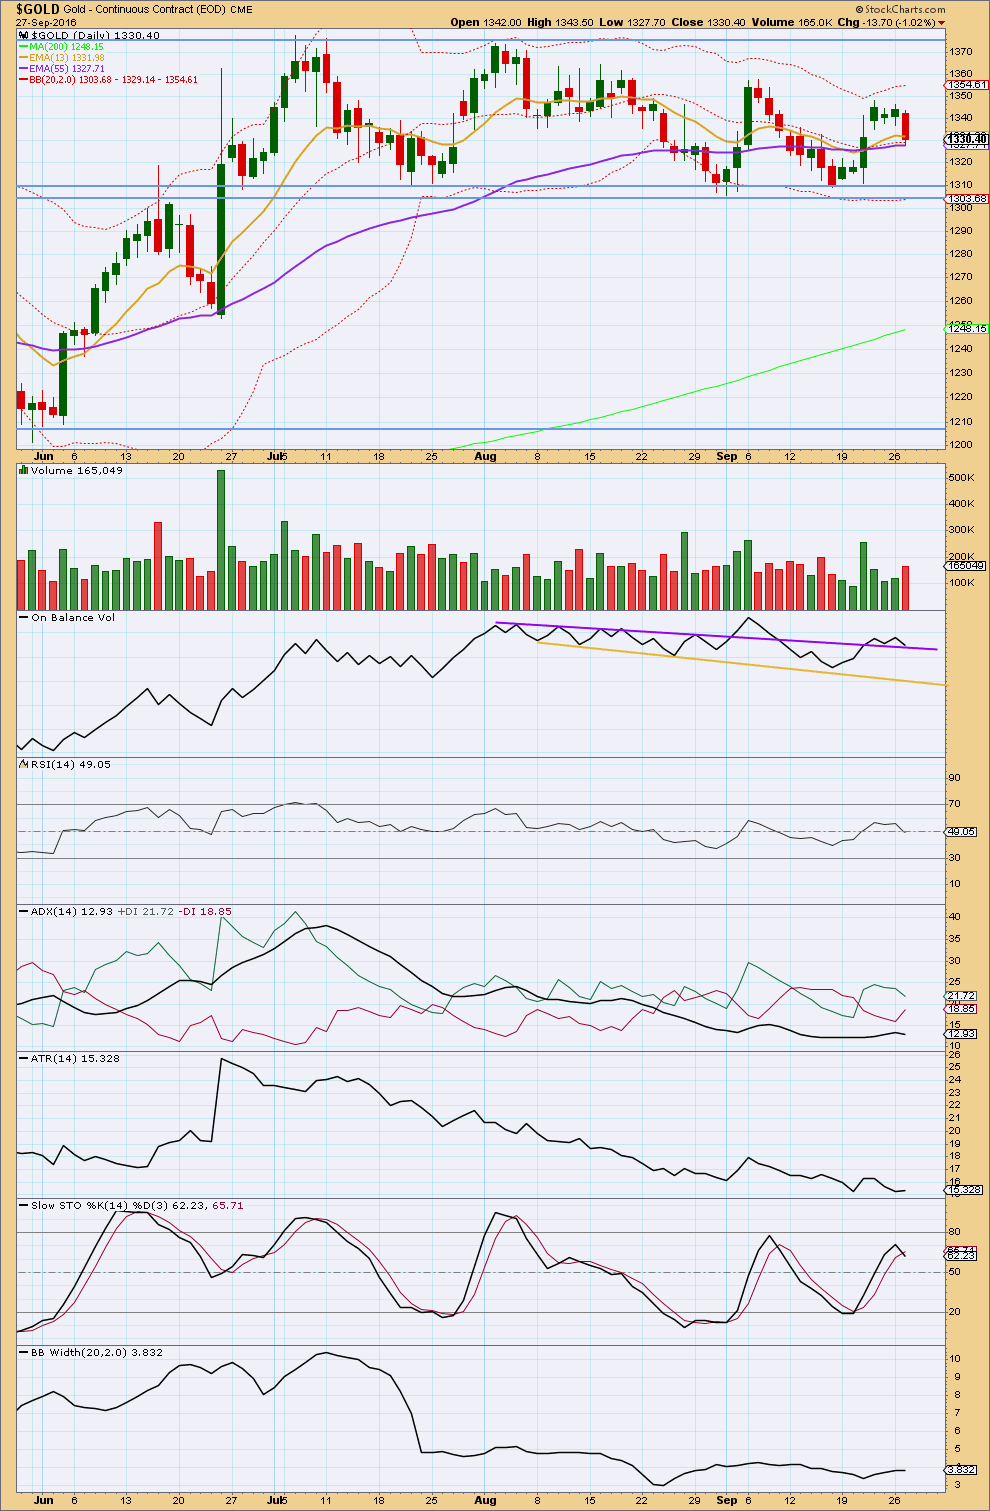
Last week completes a bullish engulfing candlestick pattern, but it is not supported by volume. To see more clearly what is happening for volume last week we’ll look at daily volume.
Price may find some resistance about 1,345.
On Balance Volume is still bullish at the weekly chart level.
At the weekly chart level, RSI is still not extreme. There is room for price to rise or fall. There is no divergence between price and RSI to indicate weakness.
DAILY CHART
Click chart to enlarge. Chart courtesy of StockCharts.com.
Gold remains range bound with resistance about 1,375 and support about 1,310 – 1,305. During this consolidation, it is four upwards days that have strongest volume suggesting an upwards breakout is more likely than downwards.
Volume for Tuesday’s downwards session is stronger than the prior three green daily candlesticks. There is support from volume for this fall in price. This strongly suggests that downwards movement is not over, so at least one more day should be expected. Price may be expected to find final support at 1,310 – 1,305 if it gets that low.
On Balance Volume has come down again to the purple trend line. This may halt the fall in price. OBV should be expected to find support here.
RSI is close to neutral. There is room for price to rise, or fall. There is no divergence today between price and RSI to indicate weakness.
ADX is today declining. It is not yet indicating a new upwards trend. The market is still consolidating.
ATR is still overall flat to declining, in agreement with ADX.
Stochastics is nearing overbought but is not quite there yet. A few more days of overall upwards movement may bring it closer, then this upwards swing may be ready to end. Price may find resistance at another point within the consolidation, about 1,355 where the last small upwards swing ended.
Bollinger Bands remain tightly contracted. This market may not yet be trending.
The longer term trend remains up. The 200 day moving average is still pointing up and price is above it. The mid term Fibonacci 55 day moving average is still pointing up and is above the longer term average. The short term Fibonacci 13 day moving average is now moving up from the mid term average, and the short term trend is also up (within the larger consolidation).
This analysis is published @ 06:59 p.m. EST.
Gold and NUGT both have had bullish BUYS Firing on multiple time frames since 11:07 am deep low today.
Gold down a deep 1318.32 since minute i peak of 1343.37 September 22nd.
NUGT down at 17.71 a deep 26% drop since minute i peak of 23.84 September 22nd.
It looks like the structure is complete. Price has very slightly overshot the lower maroon trend line, and so the probability that downwards movement is over here is very high. That line offered strong resistance before so it has good technical significance.
The channel about minuette (c) is slightly redrawn today. Use this as first indicator of a trend change, when price breaks above it with upwards (not sideways) movement.
First price point for confidence: 1,326.67. At that stage I would have reasonable confidence, upwards movement couldn’t be a second wave correction within subminuette v.
Final price point for confidence 1,341.71.
Now, this is the hardest thing to do psychologically as traders, buy the dips. It sounds easy, but it’s not.
Risk is at 1,306.7, or for the more adventurous just a little further below the maroon trend line on the daily chart. But don’t get greedy!
This is a low risk high reward set up. That doesn’t mean I must be right, I could be wrong. Which is why it’s essential to manage risk. Always use a stop loss. Invest maximum 3-5% of equity on any one trade.
Good luck!
“Bulls make money.
Bears make money.
Pigs get slaughtered.”
– Rodney (over at EWSM).
Is correction over?? Gold moved to 1320 and below completing Subminuette wave v .
Not sure about the count I’ll leave it to Lara, however minute ii appears over to me as it hit low of 1318.32.
” if price moves below 1,320 it may end closer to 1,316.”
Avi Gilburt comment today on GDX.
“As long as over 25.25 . . still can bounce . . below it, and we head to 22.
It seems to agree with Dreamers’c GDX charts below at 4 am.
Avi Gilburt , Contributor
Comments (5969) |+ Follow |Send Message
Author’s reply » As long as over 25.25 . . still can bounce . . below it, and we head to 22. Now, where is the apology you owe me? 🙂
28 Sep 2016, 11:23 AM Report Abuse Reply
Lara did warn last night that, ” if price moves below 1,320 it may end closer to 1,316.”
her barchart gold feed hit a low of 1318.32 at about 11:07 am.
Maybe that ended minuette (c), minute ii?
Meanwhile the pmbull gold spike then system failure looks to be a glitch?
PMbull has bad spike in gold price down to $275.+ This is in all time period.
Any one see this on other site such as COMEX?????
yes pmbull is not functioning right now since 10:53 am. Just a straight line down at 10:53 am to $275.19 and nothing since then. Rarely ever seen that.
barchart.com had a $4 drop at about 11:03 am down to 1318.30 and now back up to 1319.99 at 11:34 am
TOS had at 11:07 1321.10 as I have a 15 minute delay there.
TOS is showing bearish firing down since about 10 am for gold and NUGT.
No huge gold drop so far, however miners are dropping harder.
if you move the spike off the 1 minute chart you can see the current price moves
Yes you are correct, for pmbull just dial the mouse so the 10:53 vertical spike down moves off the left side of the screen and you can see gold then dropped to 1318.09 at 11:07 and now at 1321.84 at 11:55
Price action is getting sideways…wave 3 is again getting complex as last 3 months..why ther is absence of adventure in gold ?.what is cooking here ?. Its a surely silence before a storm
looks like a breakdown on GDX?
A typical consolidation, with momentum coiling up ready to explode when the trend returns.
All we can do is look to volume to see what direction that’s most likely to be in, and it looks pretty strongly like that’s going to be upwards.
quick switch between hourly chart and monthly chart and observe the similarity ….
does that mean gold will consolidate further ? 😀
Not necessarily.
This consolidation has been going on for a while now. The longer it goes, the closer the end.
Looking at current day GDX, it continues to trade within the triangle: however, it is very close to a breakdown. Technical signals are mixed at best:
> RSI may be back testing a break to the upside (bullish if it can cross back above 50)
>PRICE held today within the triangle, but did have a false break below the YTD uptrend line. A break below the triangle and uptrend line opens up the REAL possibility that GDX moves toward the lower trend line shown and a possible gap fill from 22-24
>VOLUME is low the last few days which supports the idea that this is just a correction
>MACD signal line is positive, but remains below zero
>OBV is hanging on a thread. Any move further down would support a move toward the “GAP”
So there you have it. GDX is “living on the edge”. I do expect a bounce from here for a couple of days…but then we will need to watch carefully to see which way the next “BIG” move will be. A break of the triangle will be significant.
Happy trading!
Two weeks ago I posted this GDX chart as something to watch for. Since then, Gold, GDX, and many other markets continue to consolidate into triangle patterns which may or may not be EW triangles.