
Upwards movement was expected for the last session. Both Elliott wave counts remain valid.
Summary: Look out now for surprises to the upside. In the short term, Monday may begin with a little upwards movement to 1,328. Thereafter, price should move lower for a correction to remain above 1,302.93. The target for the Elliott wave count for a third wave to end is now at 1,585.
New updates to this analysis are in bold.
Last weekly charts are here.
Grand SuperCycle analysis is here.
DAILY ELLIOTT WAVE COUNT
Click chart to enlarge.
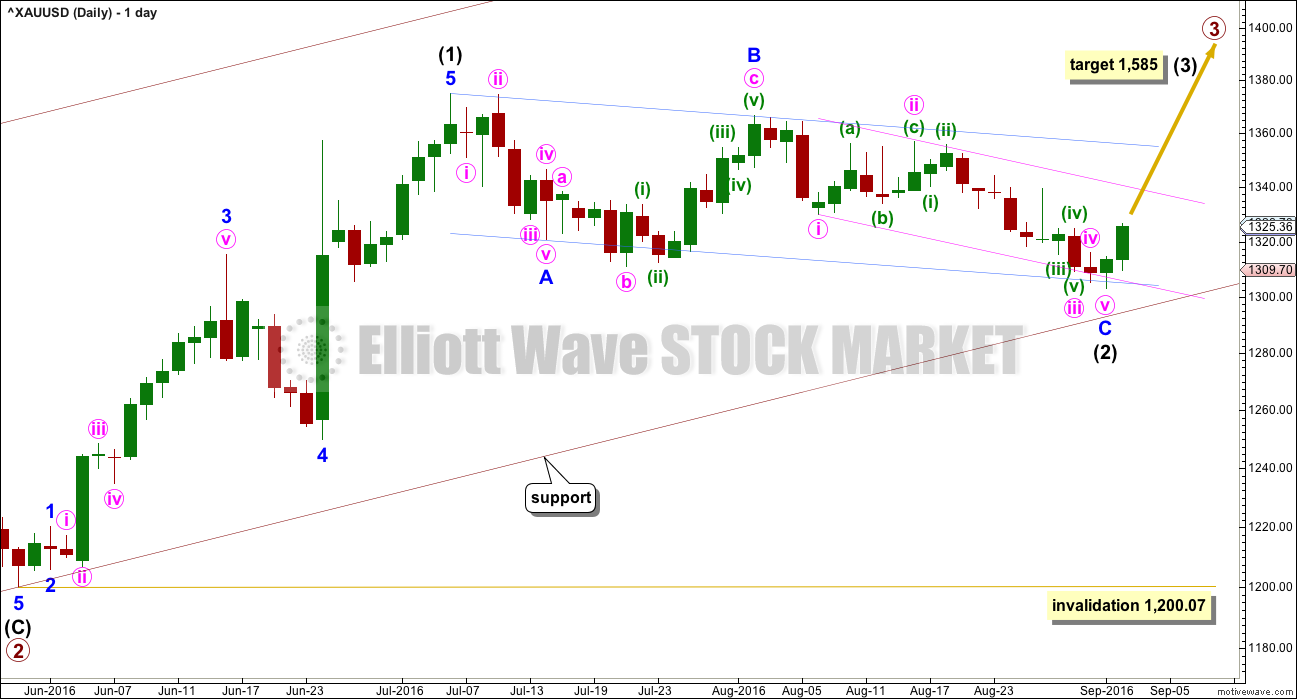
Primary waves 1 and 2 are complete. Thereafter, this wave count differs from the two alternates.
This main wave count will expect primary wave 3 to be longer than primary wave 1. Because this is very common, this is the main wave count and it expects the most common scenario is most likely. At this stage, the target for primary wave 3 is removed. A new target for intermediate wave (3) is calculated: at 1,585 intermediate wave (3) would reach 1.618 the length of intermediate wave (1).
Intermediate wave (2) may now be complete ending just below the 0.382 Fibonacci ratio of intermediate wave (1) and lasting 40 days. However, prior to a new high above 1,330.01, it must be accepted that intermediate wave (2) may yet move lower. Intermediate wave (2) may not move beyond the start of intermediate wave (1) below 1,200.07
Primary wave 3 may only subdivide as an impulse.
At this stage, a new high above 1,330.01 could not be a continuation of minute wave iv, so at that stage minute wave iv and minor wave C would have to be over. A new high above 1,330.01 would provide strong confidence in a trend change and the resumption of the prior upwards trend.
Redraw the pink channel now about minute degree waves as shown using Elliott’s first technique: the first trend line from the ends of minute waves i to iii, then a parallel copy on the end of minute wave ii. Draw a channel about intermediate wave (2) using Elliott’s technique for a correction (blue lines). Price is finding support at the lower edge. The lower edge of this channel may stop price from falling further.
With this wave count expecting a third wave at two large degrees to begin, look out for surprises to the upside at this stage.
HOURLY ELLIOTT WAVE COUNT
Click chart to enlarge.
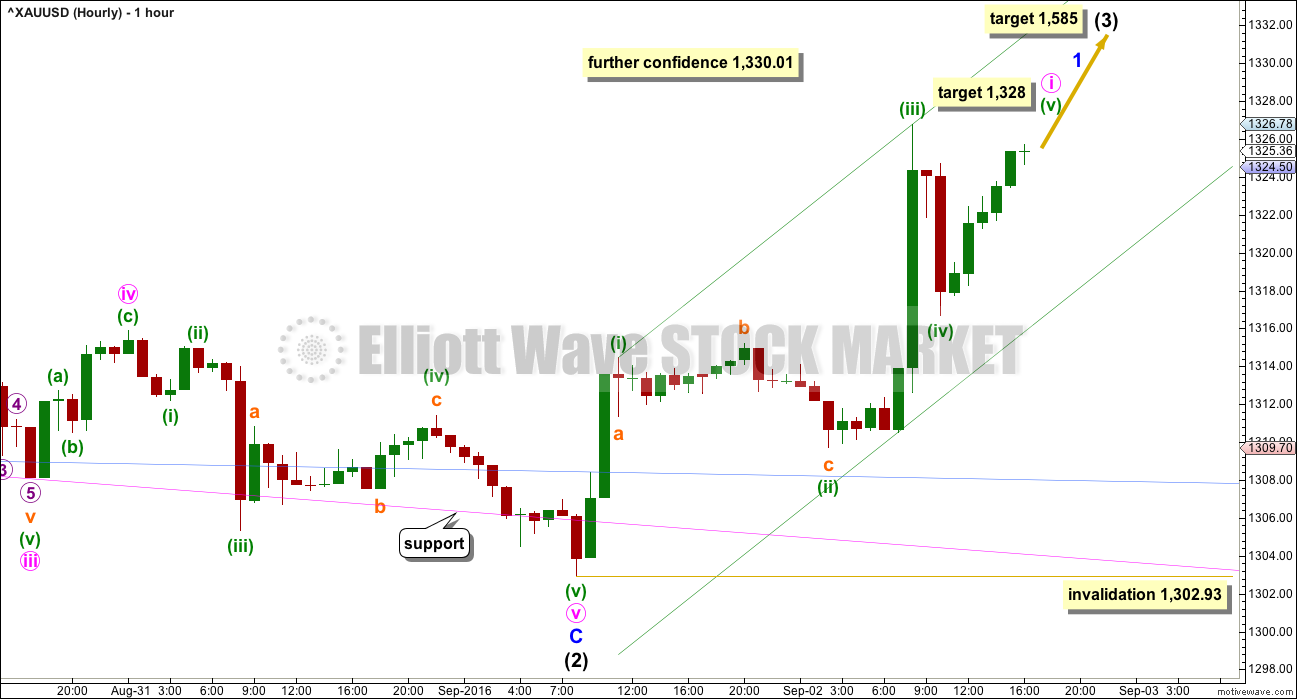
Minor wave C is most likely to be over, which means intermediate wave (2) is most likely to be over.
Intermediate wave (3) may only subdivide as an impulse. Within intermediate wave (3), minor wave 1 should last a few days at least, so it would be incomplete.
Minor wave 1 would most likely unfold as an impulse, but it may also be a leading diagonal.
A five wave impulse upwards is close to completion. This may be minute wave i. Within minute wave i, so far minuette wave (iii) is 1.57 short of 1.618 the length of minuette wave (i). At 1,328 minuette wave (v) would reach equality in length with minuette wave (i).
When minute wave i is a complete five wave impulse, then draw a Fibonacci retracement along its length. The 0.382 and 0.618 Fibonacci ratios would be reasonable targets for the following correction of minute wave ii, with the 0.618 Fibonacci ratio favoured. Minute wave ii may offer a good entry opportunity to join the trend at an excellent price.
Although this chart has a short straight arrow up to the end of intermediate wave (3), this is an indication of overall direction for price only. Markets do not move in straight lines. There will be corrections along the way.
A new high above 1,330.01 would invalidate the alternate hourly wave count below and provide further reasonable confidence in this main wave count.
Intermediate wave (1) lasted 27 days and intermediate wave (2) lasted 40 days. Intermediate wave (3) may be reasonably expected to last longer than intermediate wave (1) in both time and price. A Fibonacci 55 days would be a first expectation.
No second wave correction may move beyond the start of its first wave below 1,302.93.
ALTERNATE HOURLY ELLIOTT WAVE COUNT
Click chart to enlarge.
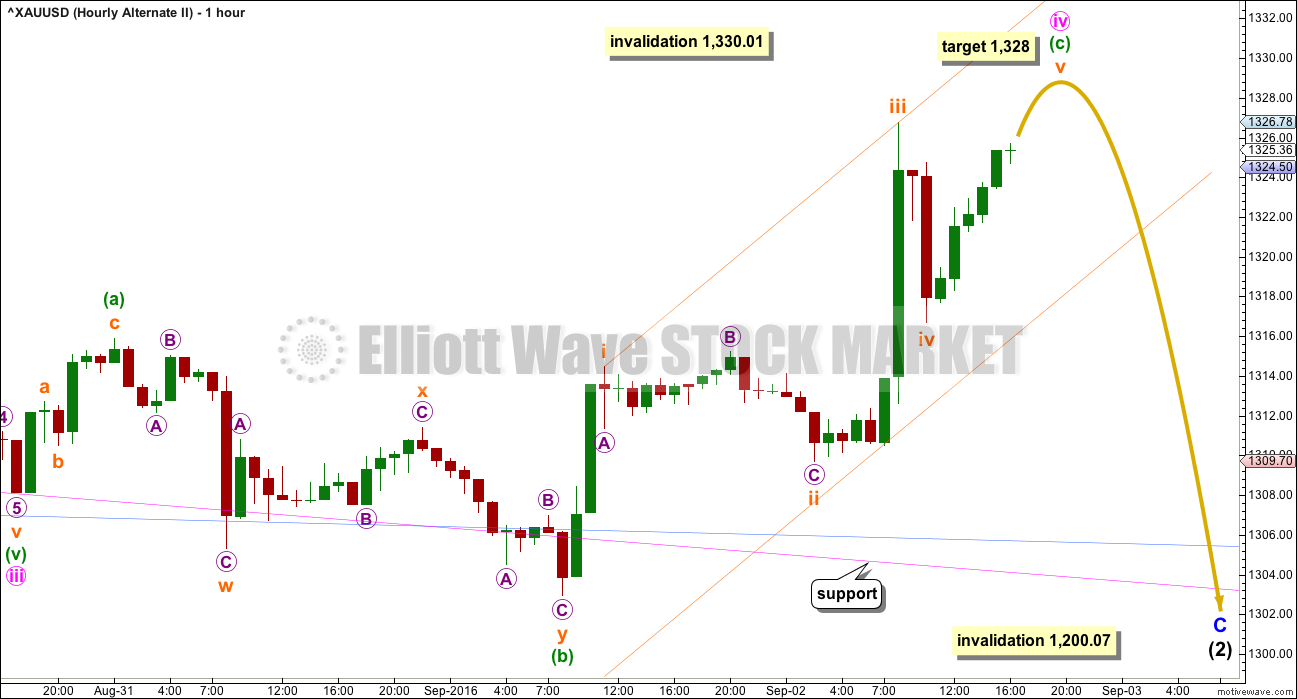
Both hourly wave counts today see minute wave iii over at the low for 30th of August.
Minute wave iv may be unfolding as an expanded flat correction. These are very common structures. Within minute wave iv, minuette wave (b) is a 1.65 length of minuette wave (a). This is longer than the common length of up to 1.38, but within the allowable convention of up to 2 times the length of minuette wave (a).
Within minuette wave (c), a final fifth wave up is required to complete the impulse. At 1,328 subminuette wave v would reach equality in length with subminuette wave i. The target is the same for both wave counts short term because the structure of a five wave impulse up is the same.
How low the following movement goes should indicate which wave count is correct. This alternate has a lower probability.
Minute wave iv may not move into minute wave i price territory. Any movement by any amount on any time frame above 1,330.01 would immediately invalidate this alternate wave count.
ALTERNATE DAILY ELLIOTT WAVE COUNT
Click chart to enlarge.
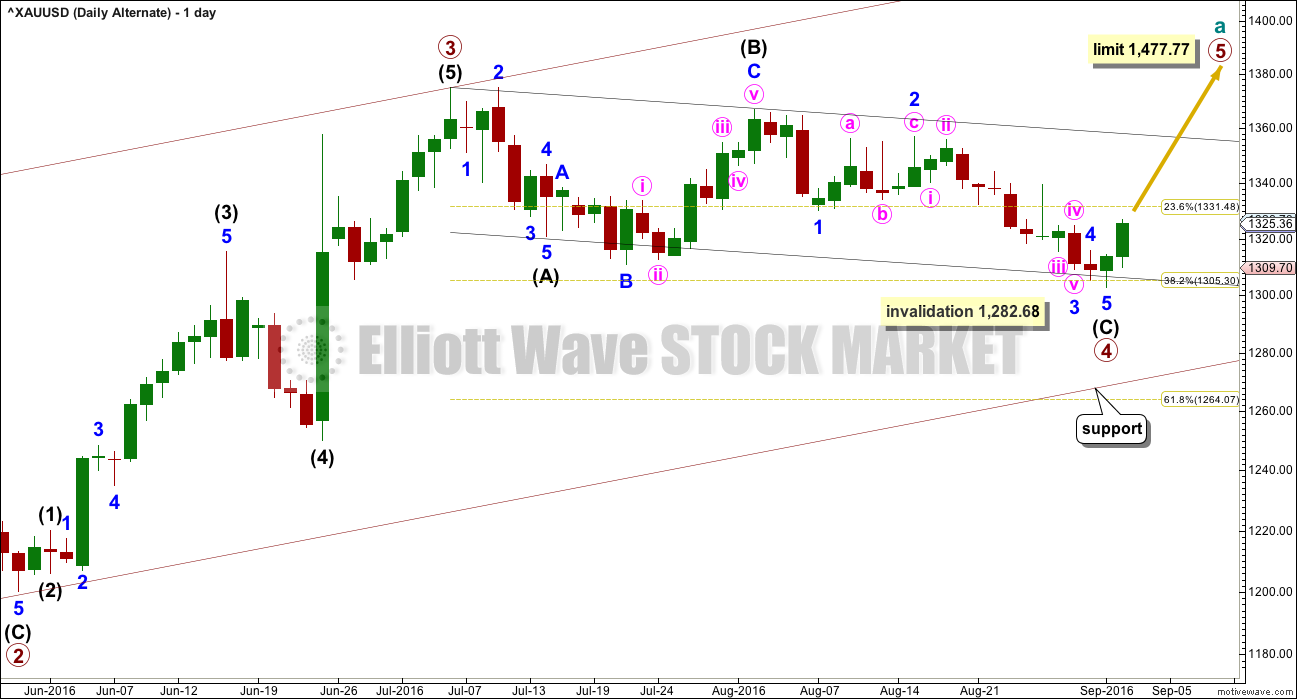
It is possible that primary wave 3 is over and shorter than primary wave 1. Primary wave 3 shows stronger volume than primary wave 1 (see technical analysis weekly chart).
If primary wave 3 is over, then the current consolidation for Gold would be primary wave 4.
Primary wave 2 was a relatively shallow 0.35 expanded flat correction. Primary wave 4 may be unfolding as a deeper zigzag which would exhibit perfect alternation.
Primary wave 4 may not move into primary wave 1 price territory below 1,282.68.
Primary wave 5 would be limited to no longer than equality in length with primary wave 3, so that the core Elliott wave rule stating a third wave may not be the shortest is met. Primary wave 5 would have a limit at 1,477.77.
The hourly charts would be exactly the same except for the degree of labelling.
TECHNICAL ANALYSIS
WEEKLY CHART
Click chart to enlarge.
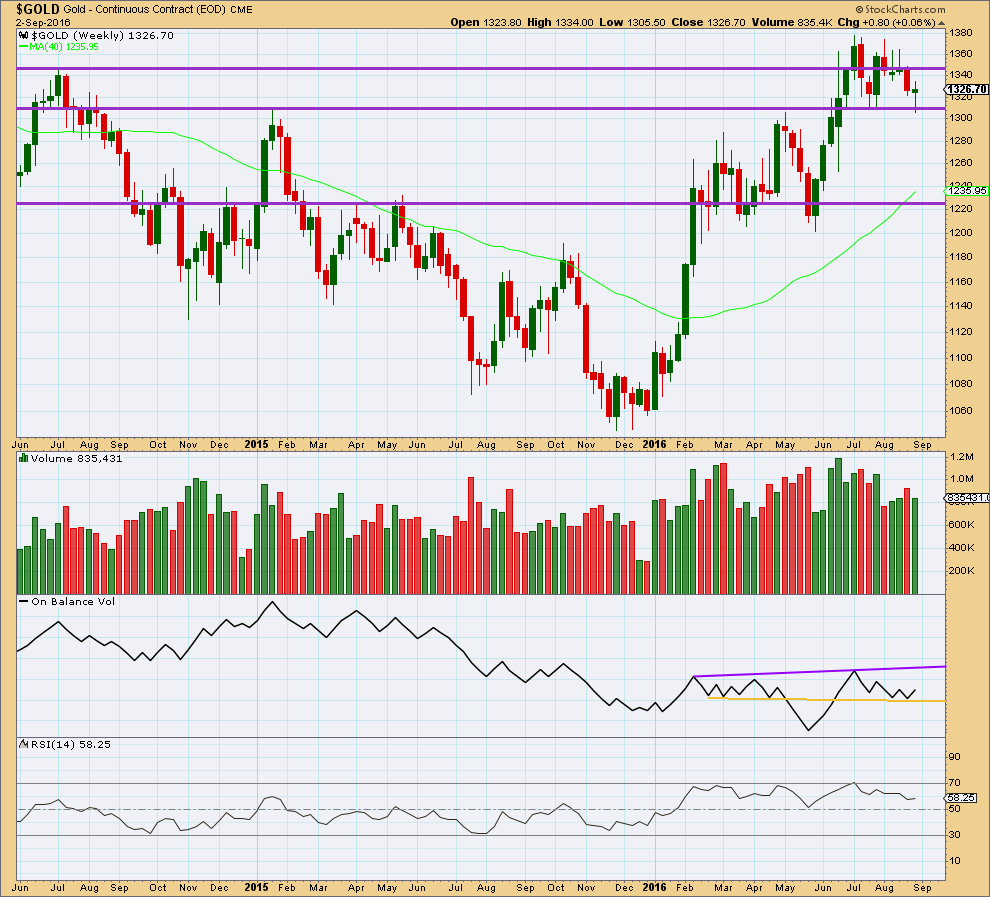
This week made an important new low, slightly below the prior swing low of 18th of July. Price thereafter bounced up strongly from support about 1,310 – 1,305. This weekly candlestick comes with lighter volume than last week.
To see what is happening here we need to look inside this week at daily volume.
The long lower wick of this weekly candlestick is bullish.
On Balance Volume is giving a bullish signal this week as it found support at the yellow trend line and has moved up and away from that line. OBV may find some resistance at the purple line.
RSI is not extreme. There is still room for price to fall or rise. There is no divergence between price and RSI at the weekly chart level to indicate weakness.
DAILY CHART
Click chart to enlarge.
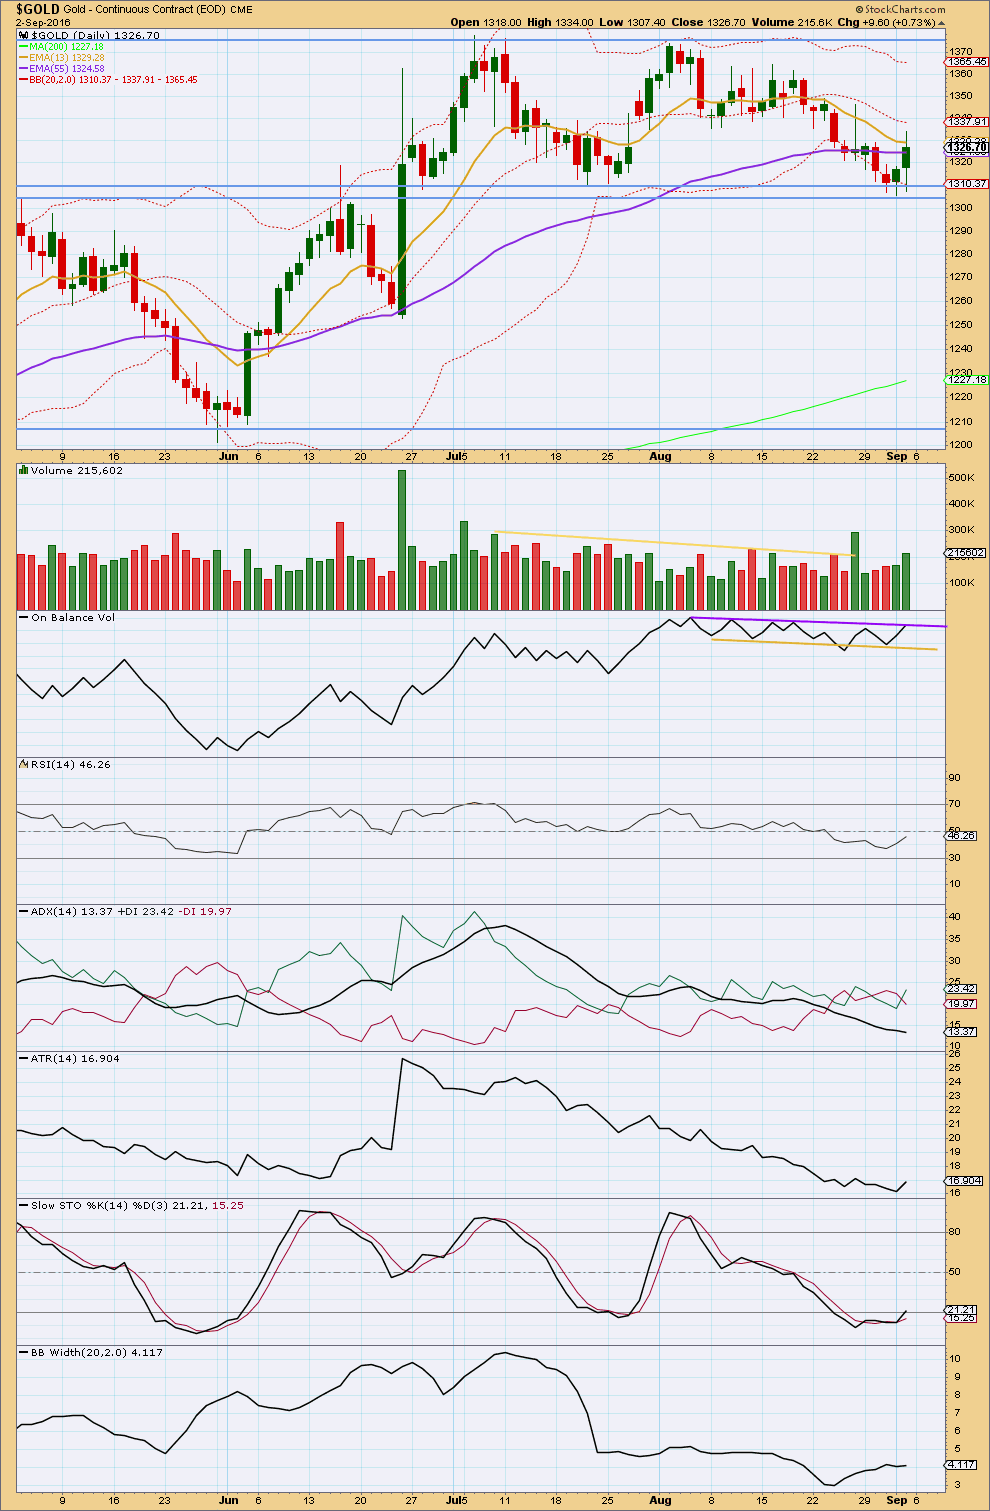
Volume shows a steady increase all week, with Friday’s upwards day showing strongest volume. The rise in price for Friday was well supported by volume. This supports the main Elliott wave count; it is bullish.
Price has found support this week at the lower edge of the support zone about 1,305. The bounce up from there reinforces the strength of this support line.
On Balance Volume gave a bullish signal this week when it came down to touch the yellow support line and then moved up from there. The strength of this line is slightly reinforced. OBV is not up at the purple line which may offer resistance. This may initiate a reaction downwards, which is what both Elliott wave counts expect short term for Monday / Tuesday.
RSI is close to neutral. There is plenty of room for price to rise or fall. There is no divergence noted at the end of this week between price and RSI at the daily chart level to indicate any weakness.
ADX is still declining and the +DX and -DX lines are still whipsawing about each other. ADX indicates this market is not trending. This is a lagging indicator as it is based upon a 14 day average.
ATR for Friday has increased, but one day of increase is not enough to indicate a trend returning. Overall, ATR is still declining in agreement with ADX that this market is not yet trending. ATR is also a lagging indicator as it too is based upon a 14 day average.
Stochastics is returning from oversold. If the market is range bound, then the upwards swing should be expected to continue next week and only end when price finds resistance and Stochastics reaches overbought.
Bollinger Bands showed some small widening this week, but still are reasonably tightly contracted.
During the range bound period, which began back on 7th of July for Gold, it is still the two upwards days of 8th of July and 26th of August that have strongest volume. Volume is suggesting an upwards breakout is still more likely than downwards. This supports the Elliott wave count.
This analysis is published @ 07:48 p.m. EST.
[Note: Analysis is public today for promotional purposes. Member comments and discussion will remain private.]
Good morning. I expect now that minute i is over and minute ii is unfolding as a flat correction. If this is correct then we may see one more spike down to about 1,312, which is the 0.618 Fibonacci ratio of minute i.
Lara and others with interest in the US Nasdaq Composite might find this history tied to world events interesting
https://rambus1.com/2016/09/04/weekend-report-end-of-the-world-history-chart/
It does look interesting… except I can’t read it. It’s for paid members only.
No worries 🙂
Wow…sorry about that. When I looked at the site yesterday and copied the chart, it was a public post. I am not a member, even though I like his work, so now I can’t access it either now. I would not have posted it if I was a member and it was member only content. Anyway, Rambus must have updated the post and made it private….
Interesting, I could read it too. I am not a member as well. 🙂
Rambus seems to be a master of showing symmetry of the markets through his charts, just as Lara is a master of EW. This chart from Thursday illustrates his idea that Gold is about to start a sharp impulsive move up to a target of 1,603 to be met in about 2.5 months.
Does it look too good to be true? Maybe… Maybe not. Compare this to Lara’s bull count. Her target for Intermediate 3 to end is 1,585. Amazingly close targets using completely different methods!
If in fact Gold is willing to follow these projections, these next couple of months could be amazing!!! This could be a parabolic move with a blowoff top before large 4th wave corrections take place.
How many of us missed a good portion of the first strong move up early this year? Be honest now… Did you miss it because you thought the “bear” was still in control? Did you miss it because you were waiting for the pullback that never happened? Did you miss it because you tried to “outsmart” the market and over traded?
Hey, I’m not trying to call anyone out here..just saying that these are all real things that happen to investors as our human emotions guide us.
Think about it. Big gains, even life changing gains, may be forthcoming. It might be time to buy and hold for a couple of months. Good luck to all.
https://goldtadise.com/?p=380659
I missed half. I was fully invested but bailed out early and gold kept on going higher. Still made 95% . Others made 230%. Of course in miners.
Better than SM.
Waiting for the next move. Gold is entering the powerful season till Nov-Dec.
This year gold smashed all COT and seasonal trend.
Both the Gold price and USD rose in tandem last December and January of this year so that strange correlation is not without precedent, though many people seem to think so. Current dollar strength is being attributed to a possible FED hike but I think there is more going on behind the scenes. The FED cannot raise rates, period. They will do so only when the market forces them to, either because of a crashing dollar, or global bond defaults. On the one hand, the dramatic decline in the price of oil puts pressure on the petro-dollar as fewer are need in oil transactions. Many countries who have tired of the bullying ways of the US Treasury have opted to engage in bi-lateral trade transactions in local currencies, bypassing the dollar, and this has also resulted in demand destruction for the US currency. On the other hand, the coming wave of global bond defaults is going to result in the disappearance of trillions in US denominated debt. This is incredibly deflationary and fewer dollars means the ones remaining increase in value. Of these competing forces the latter will probably prevail in the near and medium term so it is possible for Gold and USD price to both rise. In the end, hyperinflation will rule the day as central banks try to deal with the crisis by running the presses 24/7.
Despite massive short selling in the futures market, the banksters have been unable to drive the price below 1300.00 People often forget that blow-off tops in precious metal prices are not due so much to final frenzied buying by the crowd, as it is to short side capitulation on a massive scale. COT data is now showing historical extremes in long vs short positions, completely eclipsing the extremes seen at the 2011 highs. I would not be surprised to see another desperate attempt if and when Gold approaches 1350.00 and Silver climbs back toward 20.00, levels that have recently seen very blatant attempts at price suppression.
I suspect the efforts will fail. Based on the COT situation, Gold and Silver could be setting up for a historic parabolic run higher, unlike anything we have ever witnessed. It will be interesting to see how long the dollar keeps up.
This is the last day of free analysis for some time.
Thank you to all members for your patience and continued support.
Possible short term look for GDX
Thank you very much Dreamer for your updated GDX charts.
Good luck for next week!
Fascinating that both Gold and the Dollar are currently in very bullish chart formations. It would be interesting to take a look at other instances in which they both rose strongly…
Thanks, Dreamer.
The move down for GDX is likely complete with a break above the downtrend line. Cycle wave x may be complete as an expanded flat, although it’s still possible that only Primary Wave A of Cycle wave x is complete.
GDX will likely move up for the next 1-2 weeks before a larger pullback that will help us determine which longer term count is correct. As you saw with Lara’s last update, there are multiple options for the count.
In the short term, on Tuesday, there may be a slight move up, then a second wave correction may or may not fill the gap created today. Good luck!
GDX gapped above its downtrend line today and finished the day higher than the open on fairly strong volume
> OBV gave us a buy signal with a break above resistance
> Slow Stochastics has yet to cross above 20 for a buy signal
> ADX is still negative with the -DI line above the +DI line
Interesting move in gold today 0.8% considering that FED likelihood for raising the rate by another 0.25% . USD moved higher so overall I get the sense that retailers got a bit carried away. Let’s see what next week brings.