
A little upwards movement to about 1,328 was expected for Monday.
Price moved higher to 1,328.04.
Summary: Look out now for surprises to the upside. In the short term, a spike down to about 1,311 – 1,312 may complete a small pull back. Thereafter, price should turn upwards to new highs. The target for the Elliott wave count for a third wave to end is at 1,585.
New updates to this analysis are in bold.
Last weekly charts are here.
Grand SuperCycle analysis is here.
DAILY ELLIOTT WAVE COUNT
Click chart to enlarge.
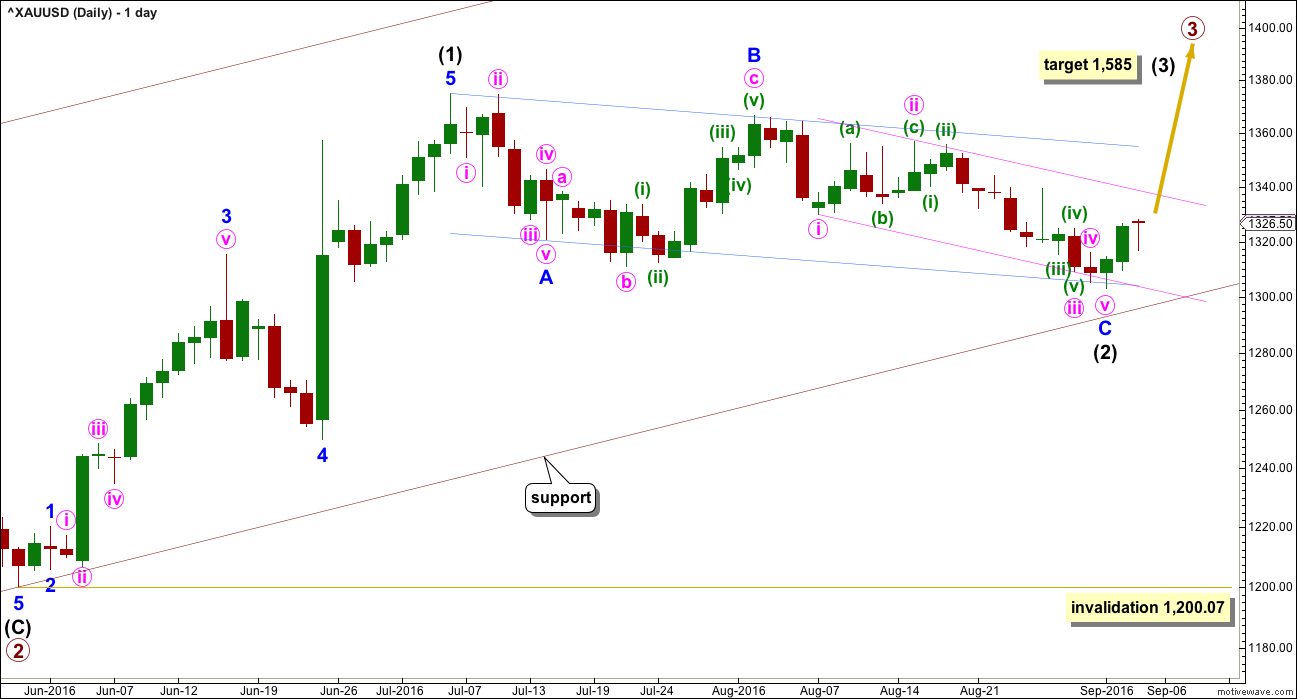
Primary waves 1 and 2 are complete. Thereafter, this wave count differs from the two alternates.
This main wave count will expect primary wave 3 to be longer than primary wave 1. Because this is very common, this is the main wave count. It expects the most common scenario is most likely. At 1,585 intermediate wave (3) would reach 1.618 the length of intermediate wave (1).
Intermediate wave (2) may now be complete ending just below the 0.382 Fibonacci ratio of intermediate wave (1) and lasting 40 days. However, prior to a new high above 1,330.01, it must be accepted that intermediate wave (2) may yet move lower. Intermediate wave (2) may not move beyond the start of intermediate wave (1) below 1,200.07
Primary wave 3 may only subdivide as an impulse.
At this stage, a new high above 1,330.01 could not be a continuation of minute wave iv, so at that stage minute wave iv and minor wave C would have to be over. A new high above 1,330.01 would provide strong confidence in a trend change and the resumption of the prior upwards trend.
Redraw the pink channel now about minute degree waves as shown using Elliott’s first technique: the first trend line from the ends of minute waves i to iii, then a parallel copy on the end of minute wave ii. Draw a channel about intermediate wave (2) using Elliott’s technique for a correction (blue lines). Price is finding support at the lower edge. The lower edge of this channel may stop price from falling further.
With this wave count expecting a third wave at two large degrees to begin, look out for surprises to the upside at this stage.
HOURLY ELLIOTT WAVE COUNT
Click chart to enlarge.
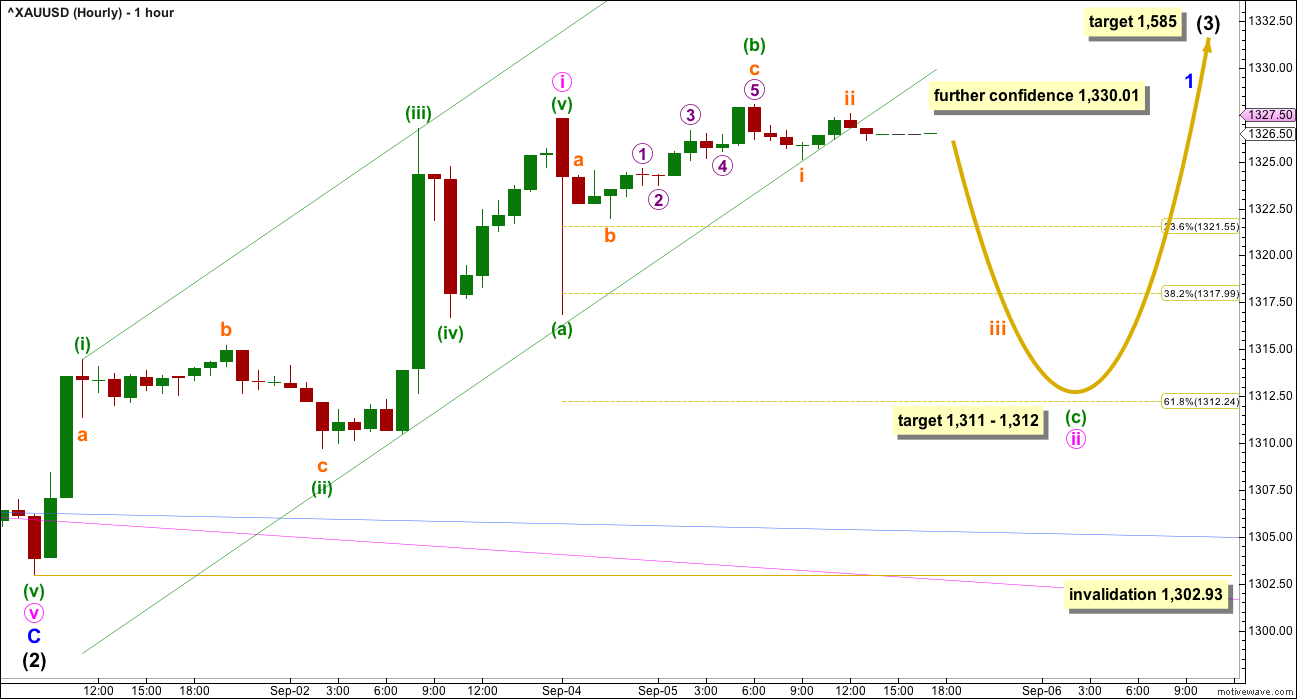
Minor wave C is most likely to be over, which means intermediate wave (2) is most likely to be over.
Intermediate wave (3) may only subdivide as an impulse. Within intermediate wave (3), minor wave 1 should last a few days at least, so it would be incomplete.
Minor wave 1 would most likely unfold as an impulse, but it may also be a leading diagonal.
Upwards movement for Monday’s session to the high at 1,328.04 subdivides best as a zigzag. This may be minuette wave (b) within an expanded flat correction for minute wave ii. At 1,311 minuette wave (c) would reach 1.618 the length of minuette wave (a). This is very close to 1,312 where minute wave ii would reach the 0.618 Fibonacci ratio of minute wave i, giving a $1 target zone for the correction to end.
Minute wave ii may not move beyond the start of minute wave i below 1,302.93.
In the short term, if price makes a new high above 1,328.04 before moving lower, then the analysis of minuette wave (b) as a completed zigzag is wrong. At that stage, minuette wave (b) would be expected to be continuing higher. The normal range for minuette wave (b) within a flat would be from 1,327.30 to 1,331.26. If price moves above 1,331.26, then probability would shift to seeing minute wave ii over and minute wave iii upwards underway.
Intermediate wave (1) lasted 27 days and intermediate wave (2) lasted 40 days. Intermediate wave (3) may be reasonably expected to last longer than intermediate wave (1) in both time and price. A Fibonacci 55 days would be a first expectation.
ALTERNATE HOURLY ELLIOTT WAVE COUNT
Click chart to enlarge.
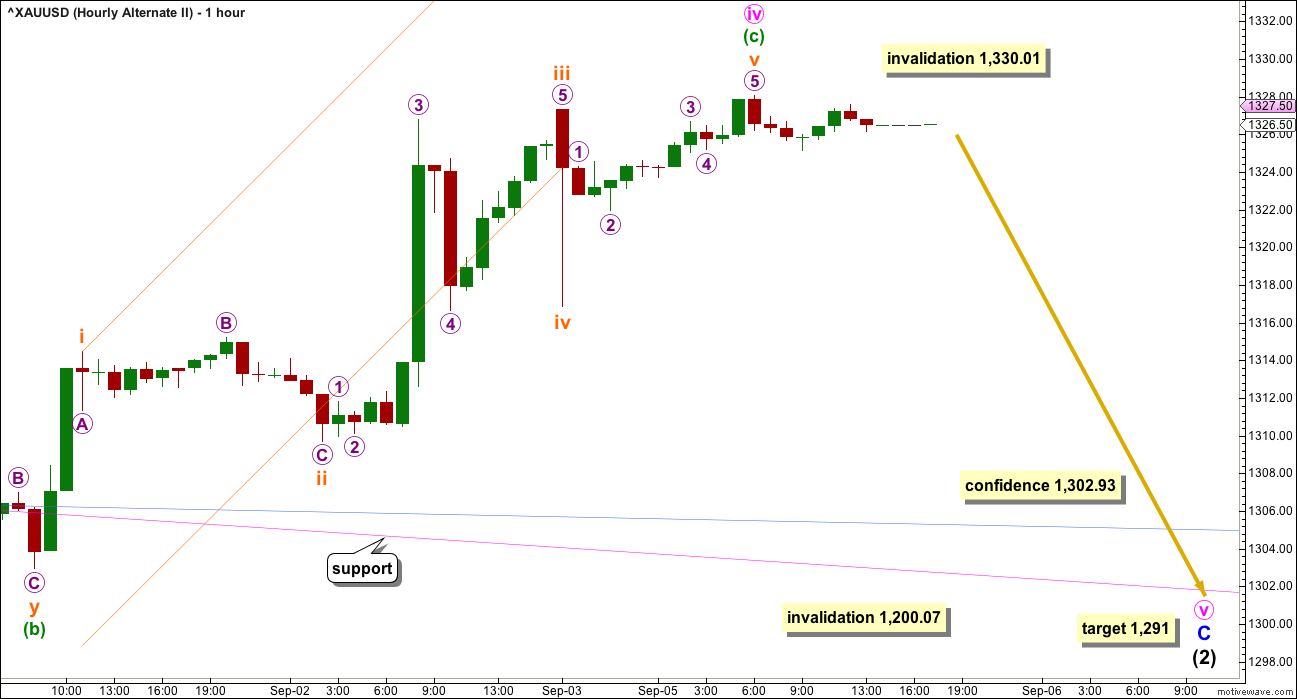
Both hourly wave counts today see minute wave iii over at the low for 30th of August.
Minute wave iv may be unfolding as an expanded flat correction. These are very common structures. Within minute wave iv, minuette wave (b) is a 1.65 length of minuette wave (a). This is longer than the common length of up to 1.38, but within the allowable convention of up to 2 times the length of minuette wave (a).
The structure of minuette wave (c) may now be complete. There is almost no room left for minute wave iv to move into.
The final fifth wave up of subminuette wave v does not look as good as a five as it does as a three. It may be either and both possibilities should be considered.
This alternate still has a lower probability.
Minute wave iv may not move into minute wave i price territory. Any movement by any amount on any time frame above 1,330.01 would immediately invalidate this alternate wave count.
ALTERNATE DAILY ELLIOTT WAVE COUNT
Click chart to enlarge.
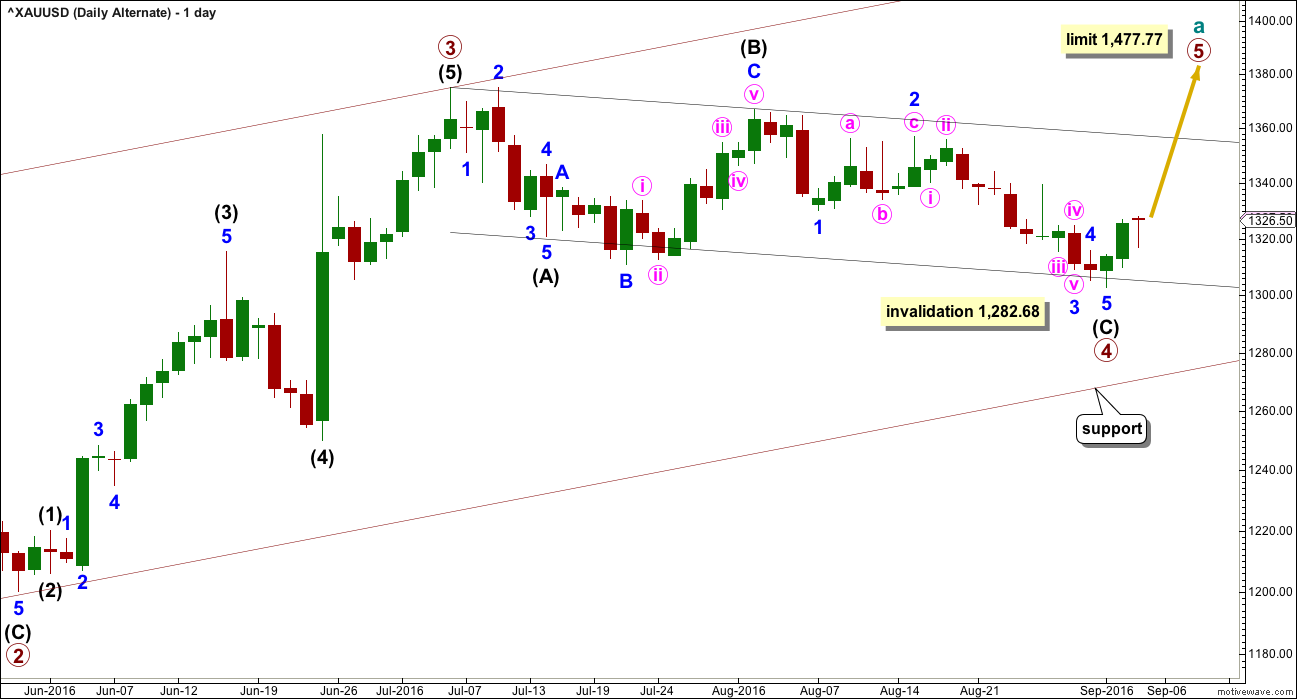
It is possible that primary wave 3 is over and shorter than primary wave 1. Primary wave 3 shows stronger volume than primary wave 1 (see technical analysis weekly chart).
If primary wave 3 is over, then the current consolidation for Gold would be primary wave 4.
Primary wave 2 was a relatively shallow 0.35 expanded flat correction. Primary wave 4 may be unfolding as a deeper zigzag which would exhibit perfect alternation.
Primary wave 4 may not move into primary wave 1 price territory below 1,282.68.
Primary wave 5 would be limited to no longer than equality in length with primary wave 3, so that the core Elliott wave rule stating a third wave may not be the shortest is met. Primary wave 5 would have a limit at 1,477.77.
The hourly charts would be exactly the same except for the degree of labelling.
TECHNICAL ANALYSIS
WEEKLY CHART
Click chart to enlarge. Chart courtesy of StockCharts.com.
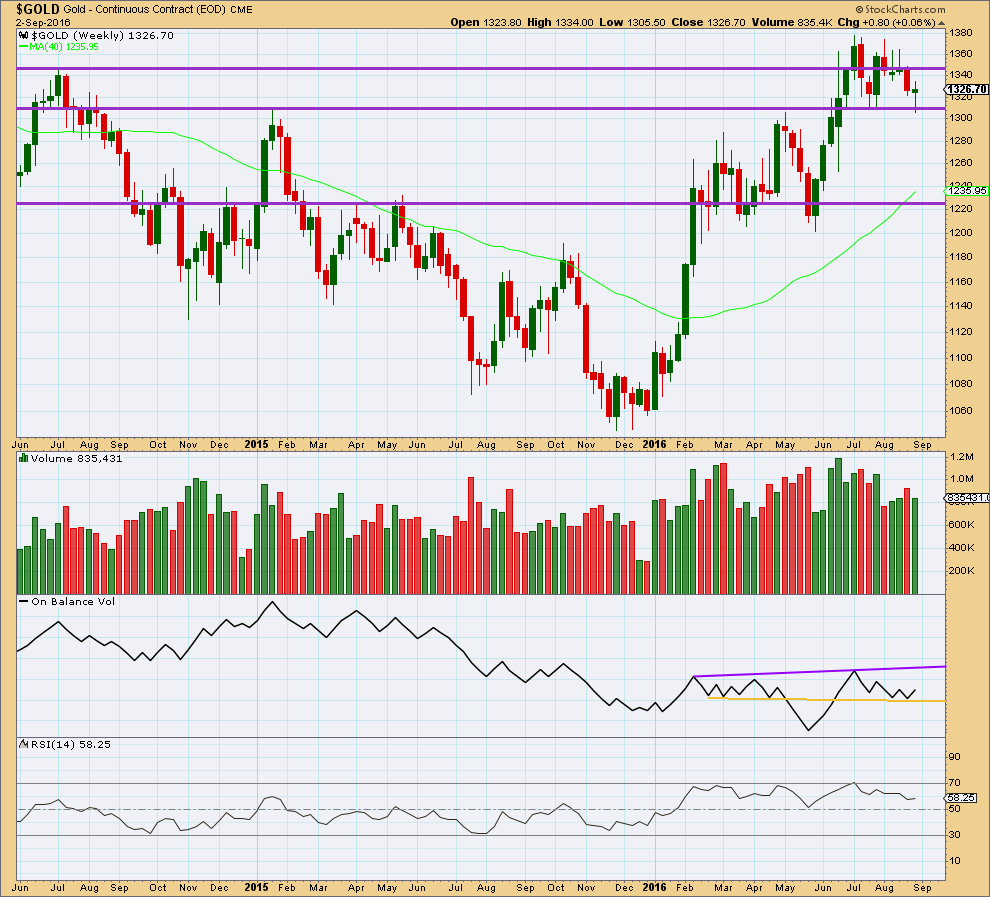
Last week made an important new low, slightly below the prior swing low of 18th of July. Price thereafter bounced up strongly from support about 1,310 – 1,305. Last weekly candlestick comes with lighter volume than the week prior.
To see what is happening here we need to look inside last week at daily volume.
The long lower wick of last weekly candlestick is bullish.
On Balance Volume is giving a bullish signal last week as it found support at the yellow trend line and has moved up and away from that line. OBV may find some resistance at the purple line.
RSI is not extreme. There is still room for price to fall or rise. There is no divergence between price and RSI at the weekly chart level to indicate weakness.
DAILY CHART
Click chart to enlarge. Chart courtesy of StockCharts.com.
StockCharts data is New York session only. With New York closed for a public holiday on Monday 5th of September, this classic technical analysis section has no update today.
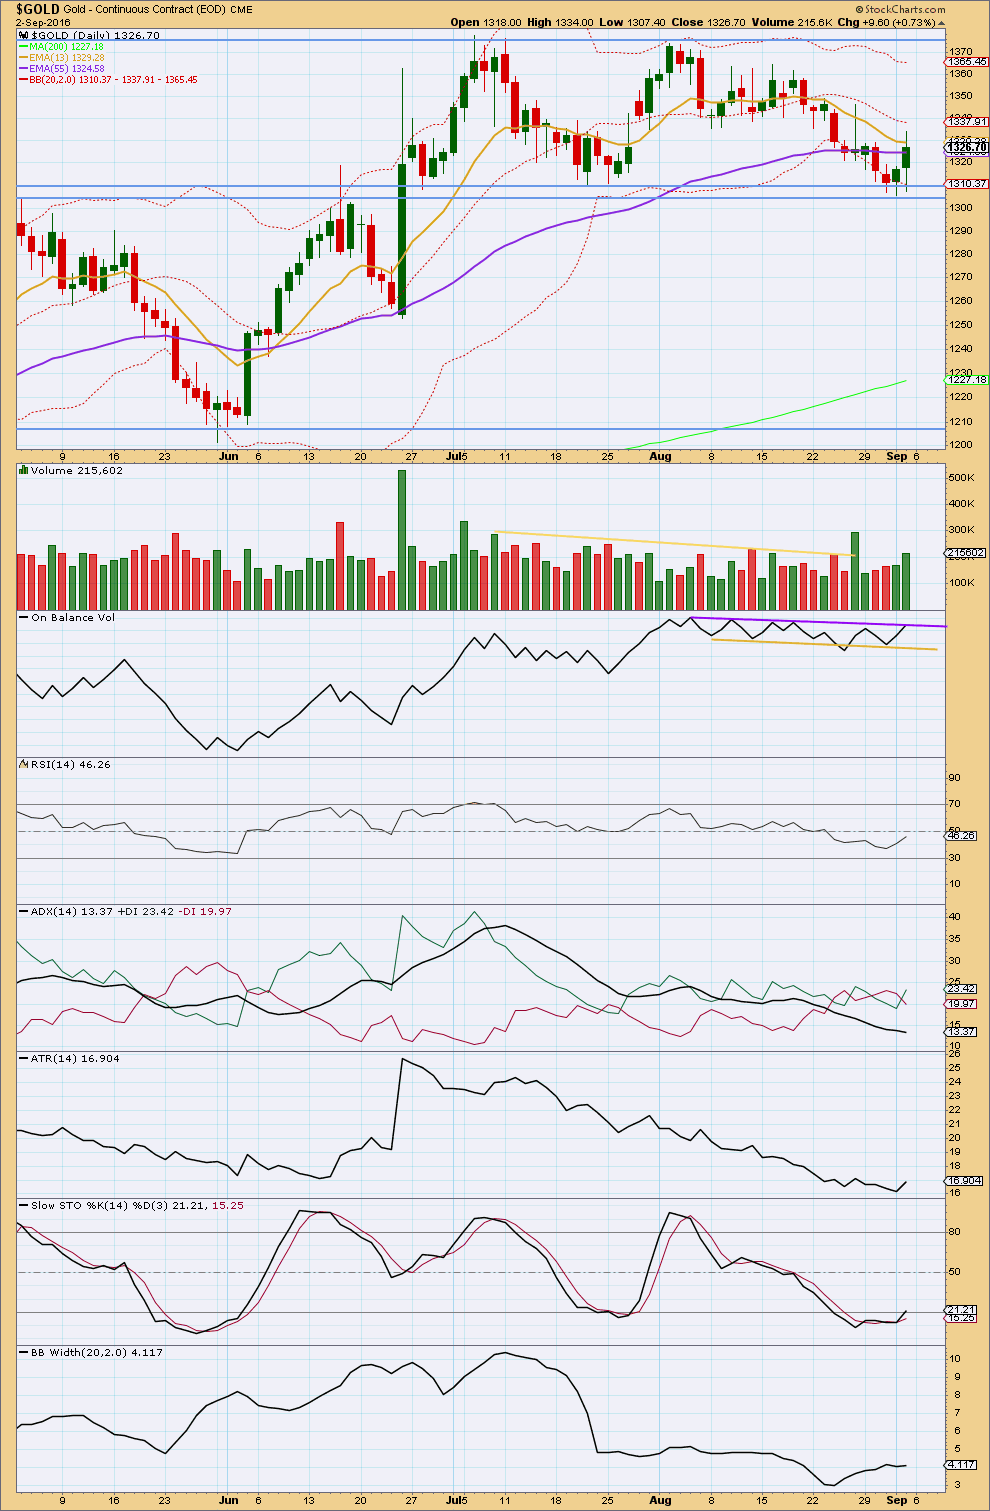
Volume shows a steady increase all week, with Friday’s upwards day showing strongest volume. The rise in price for Friday was well supported by volume. This supports the main Elliott wave count; it is bullish.
Price has found support this week at the lower edge of the support zone about 1,305. The bounce up from there reinforces the strength of this support line.
On Balance Volume gave a bullish signal this week when it came down to touch the yellow support line and then moved up from there. The strength of this line is slightly reinforced. OBV is not up at the purple line which may offer resistance. This may initiate a reaction downwards, which is what both Elliott wave counts expect short term for Monday / Tuesday.
RSI is close to neutral. There is plenty of room for price to rise or fall. There is no divergence noted at the end of this week between price and RSI at the daily chart level to indicate any weakness.
ADX is still declining and the +DX and -DX lines are still whipsawing about each other. ADX indicates this market is not trending. This is a lagging indicator as it is based upon a 14 day average.
ATR for Friday has increased, but one day of increase is not enough to indicate a trend returning. Overall, ATR is still declining in agreement with ADX that this market is not yet trending. ATR is also a lagging indicator as it too is based upon a 14 day average.
Stochastics is returning from oversold. If the market is range bound, then the upwards swing should be expected to continue next week and only end when price finds resistance and Stochastics reaches overbought.
Bollinger Bands showed some small widening this week, but still are reasonably tightly contracted.
During the range bound period, which began back on 7th of July for Gold, it is still the two upwards days of 8th of July and 26th of August that have strongest volume. Volume is suggesting an upwards breakout is still more likely than downwards. This supports the Elliott wave count.
This analysis is published @ 06:19 p.m. EST.
I agree with Alan, the differences in data is maddening. It does make a difference to the wave count.
With BarChart data I would count minute waves i, ii and now iii complete.
Minute iv may show up on the daily chart. Minute wave ii does, as a red dragonfly doji. Minute iv may be very shallow, maybe a doji on the daily chart.
Gold had a boost from a US dollar that took a fast drop at this 10:00 am US news.
10:08 am Dollar sinks after ISM services
10:35 am U.S. services growth slows to weakest pace in six years, ISM finds
http://www.marketwatch.com/story/service-side-of-us-economy-grows-at-slowest-pace-since-2010-ism-finds-2016-09-06
Yup, the King dollar affects everything.
At 1:42 pm EST may be highs Gold 1352.70, GDX 28.67, NUGT 25.00.
Both gold and NUGT fired bullish multiple time frames starting at 5 am.
Looks like Alan pretty much nailed the top and is expecting the following now:
“Minute 2 should end around 1319-1323.”
I agree, and gold may be in 2nd wave up to retest the day high before dropping.
If you follow Lara’s count, this is most likely a third wave at some degree below minute. I would reckon it would be subminuette 3 of minuette 1 of minute 3. We’ll see what Lara have to say.
The different data feed certainly is infuriating. Using pmbull, Minute 1 has ended at today’s high of 1352.70. But, using Barchart, this will be part of Minute 3. And it’s all due to the data at 5 am on Sunday Sep 5. It showed a high and a low which pmbull doesn’t exhibit! Grr.
Precious metals at a critical junctures. The banksters are going to in all likelihood make another massive dump of conrtracts into the futures markets in the next 24-48 hours. It makes me smile to consider the very possible prospect of them having their you-know- what royally kicked. If they cannot push prices in Gold away from 1350 and Silver from 20.50 they are to loose billions and Gold is going make a run-away dash for 1500.00 and Silver for at least 24.00 🙂
What the noise all around EWG about data feeds…since more than last one year im with EWG but from last month or so it has became a hot cake topic…why is this happening ?. Sounding unreliable..
This is because BarChart data feed has a spike down to 1,316 on 5th September. Some members broker data (such as PM Bull) are not showing this spike.
It’s not that either feed is unreliable, it’s just a fact of life with a global market which has no one central data point.
As long as I consistently use the same cash data (not futures) then the EW count will be valid.
As Dreamer saw earlier, the alternate hourly is invalidated. Sadly, the alternate daily is still in play which, if it happens, will translate to lower gains!
The different data feeds have caused a lot of havoc on the possible Elliott wave counts. pmbull had a spike down on Sep 2 at 0800 but not Barchart. Barchart had a spike down on Sep 4 at 0500 (which Lara labelled minuette b) but pmbull did not have this. I find the latter disconcerting, and I’ll explain why in the next paragraph.
Using pmbull data, my count has Minute 1 being not over yet. I take it as an extended fifth wave, completing probably at 1.382 (1344.58) or 1.618 (1349.42) of minuette 3. If I take into consideration the spike down visible in barchart but not in pmbull, I will be inclined to label Minute 2 as the point in which Lara labelled minuette b. As it stands, I can still count Minute 2 as complete, albeit as a very shallow correction.
I agree, the differences in data feeds is maddening! ?
Thanks Alan.
So how far do you see this correcting back to after reaching this next leg up to the 1344+?
Thanks
Hi Marc. I’m for the 0.618 Fib retrace. This is based on the immediate past history which sees second waves retrace as much as 0.786, in some instances even 0.886, of the first wave.
Minor 1 begins at 1302.53. With Minute 1 ending around 1344-1349, Minute 2 should end around 1319-1323.
I have some confidence in this count because it leads to Intermediate 3 ending pretty close to 1585, which is 1.618 of Intermediate 1. All the Fib ratios fit almost perfectly well in this count, giving rise to an orderly textbook look. There is no need for any outlandish spike such as 2.618 or 4.236 or higher ratios.
Thanks Alan.
Alternate hourly is now invalidated with move above 1,330.01
Lara and others, the Rambus Nasdaq Composite history post is public once again if interested. Not sure what happened yesterday as it went from public to private and is now public again.
https://rambus1.com/2016/09/04/weekend-report-end-of-the-world-history-chart/
Thank you very much for the link Dreamer.
I remember the 1987 stock market crash clearly. It affected NZ more deeply than it affected the USA.
Yes, I agree. Perspective is everything.
The last experience of huge massive social upheaval in a negative way would be the Great Depression. And those who were old enough to recall living through it, those whose lives it directly affected and changed, are now either dead or very old indeed.
So living in the world today this kind of experience is not in our living memory.
Something to add to Rambus’ musings perhaps.
Very interesting it may be Fibonacci 52 days more to $1,585 intermediate wave (3).
“Intermediate wave (1) lasted 27 days and intermediate wave (2) lasted 40 days. Intermediate wave (3) may be reasonably expected to last longer than intermediate wave (1) in both time and price. A Fibonacci 55 days would be a first expectation.”
Dreamer September 4th posted a link to Rambus who has a target of $1,603 this year.
https://goldtadise.com/?p=380659
Hi Lara,
I had posted attached under the US Dollar on Fri, Sept 2. Several of us seem to be following $DXY to track the dollar while using UUP, UDN to trade it. I for one need to better understand how to compare your chart to $DXY to clarify target on that chart or current futures contract, at least to come up with a close estimate to your values and target/s.
I realize there is no volume on $DXY which causes you a problem for accurate analysis?
Thank you…
1. I am using FXCM USD index data, the ticker from FXCM is USDollar.
2. As far as I can tell, move the decimal place two to the left. If this does not equate to other data feeds, I do not know why.
3. No. Because I have not managed yet to get that data into Motive Wave.
4. It would require a truncation according to the data I have. Which is why I have labelled my wave count as I have.
Hi Lara,
Moving the decimal 2 places to the left does not help to compare the charts FXCM USdollar chart to for example, DXY on Barchart.com. Let me explain:
C Minor of Interm (4) ended May 03, 2016 on FXMC- USdollar @ a low of 116.75ish.
C Minor of Interm (4) ended May 03, 2016 on Barchart.com- DXY @ a low of 91.91.
USD Index and futures contracts read very similar Price Values to DXY, Not the FXCM- USdollar chart.
Based on above example is there a way for those of us tracking dollar with DXY, USD and futures contracts to accurately interpret targets and levels from your FXMC chart other than visually tracking the candles as they form a similar wave pattern to what we see on your FXMC-USdollar Elliott Wave labeled chart?
Thanks,