
Both Elliott wave counts expect Oil to move in the same direction next.
Summary: Both wave counts expect downwards movement for the next week to a minimum at 40.18. Thereafter the wave counts diverge.
New updates to this analysis are in bold.
MONTHLY ELLIOTT WAVE COUNT
Click chart to enlarge.
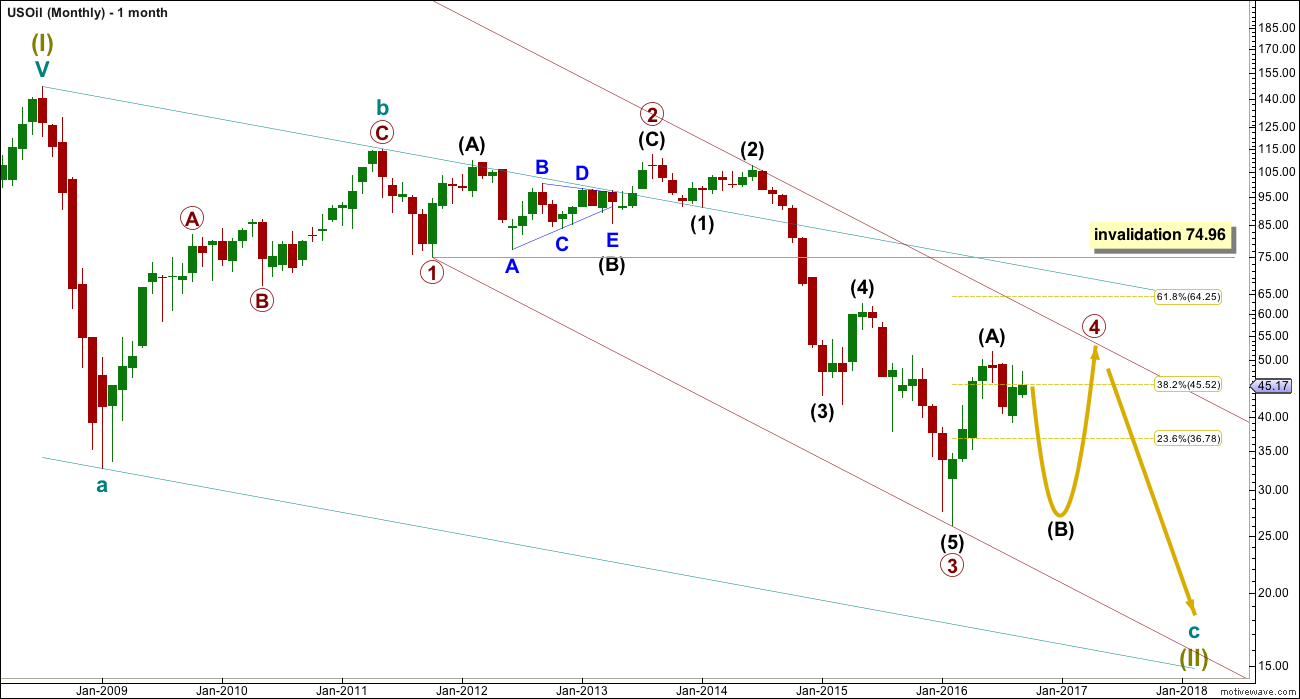
Within the bear market, cycle wave b is seen as ending in May 2011. Thereafter, a five wave structure downwards for cycle wave c begins.
Primary wave 1 is a short impulse lasting five months. Primary wave 2 is a very deep 0.94 zigzag lasting 22 months. Primary wave 3 is a complete impulse with no Fibonacci ratio to primary wave 1. It lasted 30 months.
Primary wave 4 is likely to exhibit alternation with primary wave 2. Primary wave 4 is most likely to be a flat, combination or triangle. Within all of these types of structures, the first movement subdivides as a three.
Primary wave 4 is likely to end within the price territory of the fourth wave of one lesser degree; intermediate wave (4) has its range from 42.03 to 62.58.
Primary wave 4 may end if price comes up to touch the upper edge of the maroon channel. The upper edge of this channel has been pushed up to sit on the end of intermediate wave (2) within primary wave 3.
Primary wave 4 is most likely to be shallow to exhibit alternation in depth with primary wave 2. So far it has passed the 0.382 Fibonacci ratio at 45.52. It may now move mostly sideways in a large range.
Primary wave 4 may not move into primary wave 1 price territory above 74.96.
DAILY ELLIOTT WAVE COUNT
Click chart to enlarge.
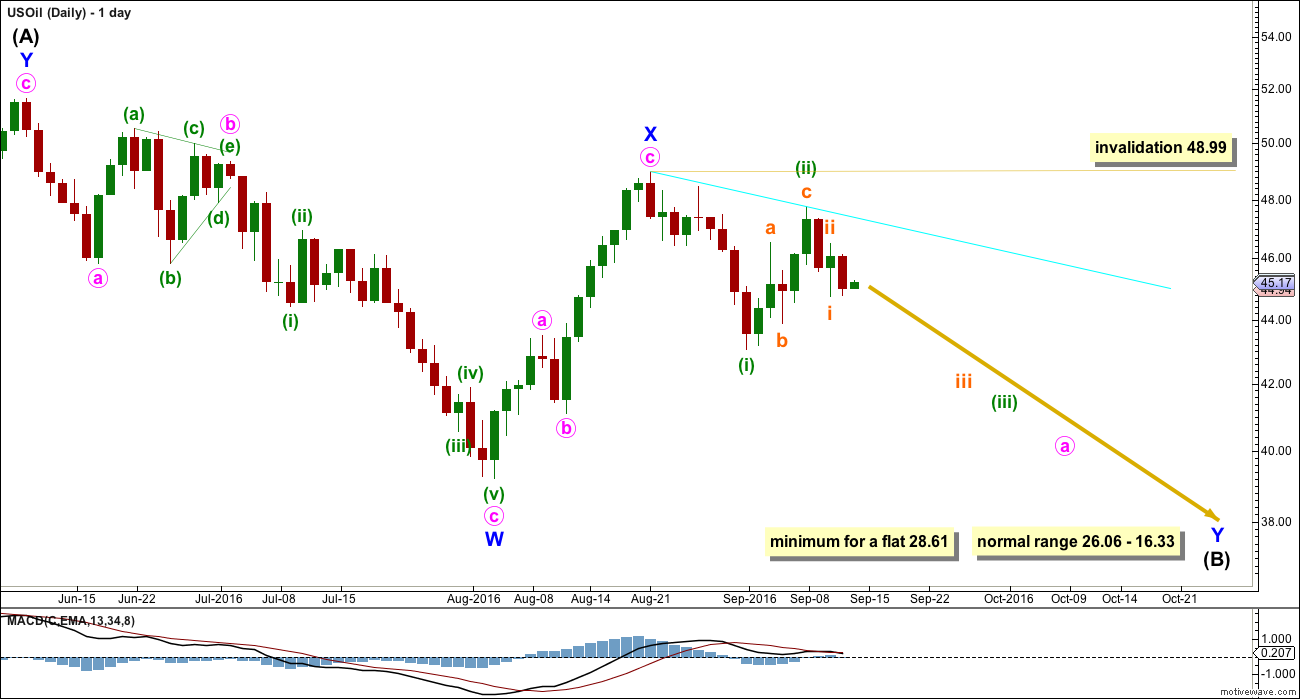
Intermediate wave (A) may be complete as a double zigzag.
If intermediate wave (A) is a three, then intermediate wave (B) is most likely to be a very deep correction. It may make a new low below the start of intermediate wave (A) at 26.06.
If primary wave 4 is to be a flat correction, then intermediate wave (B) must be a minimum 0.9 length of intermediate wave (A) at 28.61. The normal range for intermediate wave (B) would be 1 to 1.38 the length of intermediate wave (A) at 26.06 to 16.33.
If primary wave 4 is to be an expanded flat correction, then intermediate wave (B) should be 1.05 the length of intermediate wave (A) or longer, at 24.78.
If primary wave 4 is to be a triangle, then intermediate wave (B) has no minimum nor maximum. It must only subdivide as a three wave structure. It may make a new low below the start of intermediate wave (A) at 26.06 as in a running triangle. A normal range for intermediate wave (B) within a larger triangle would be 0.8 the length of intermediate wave (A) at 31.18.
A triangle would only be possible at this stage if my labelling of either intermediate waves (A) or (B) as a double zigzag is wrong. Only one sub-wave within a triangle may be a multiple correction. Four of the five sub-waves of a triangle must be simple A-B-C structures.
Primary wave 4 may not move into primary wave 1 price territory above 74.96.
Intermediate wave (B) may be any of more than 23 possible corrective structures. It would most likely be a single or multiple zigzag in order to be a deep correction. It may also be an expanded flat to be deep. It may find support at the lower edge of the maroon channel.
So far intermediate wave (B) looks most likely to be unfolding as a double zigzag.
Within double zigzags, the X wave is most often a brief and relatively shallow zigzag. This main daily wave count sees minor wave X complete at 0.79 the length of minor wave W, and more brief than the alternate. For this reason this main wave count has a higher probability. However, this week the subdivisions of recent movement now have a better fit for the alternate wave count.
This main wave count must see the downwards wave labelled minuette wave (i) as a five, but it looks more like a three. This reduces the probability of this main wave count to about even now with the alternate.
Minor wave Y should unfold as a zigzag and the structure so far is incomplete. Within the second zigzag, no second wave correction nor B wave correction may move beyond the start of the zigzag above 48.99.
The second zigzag in the double would be required to deepen the correction.
ALTERNATE DAILY ELLIOTT WAVE COUNT
Click chart to enlarge.
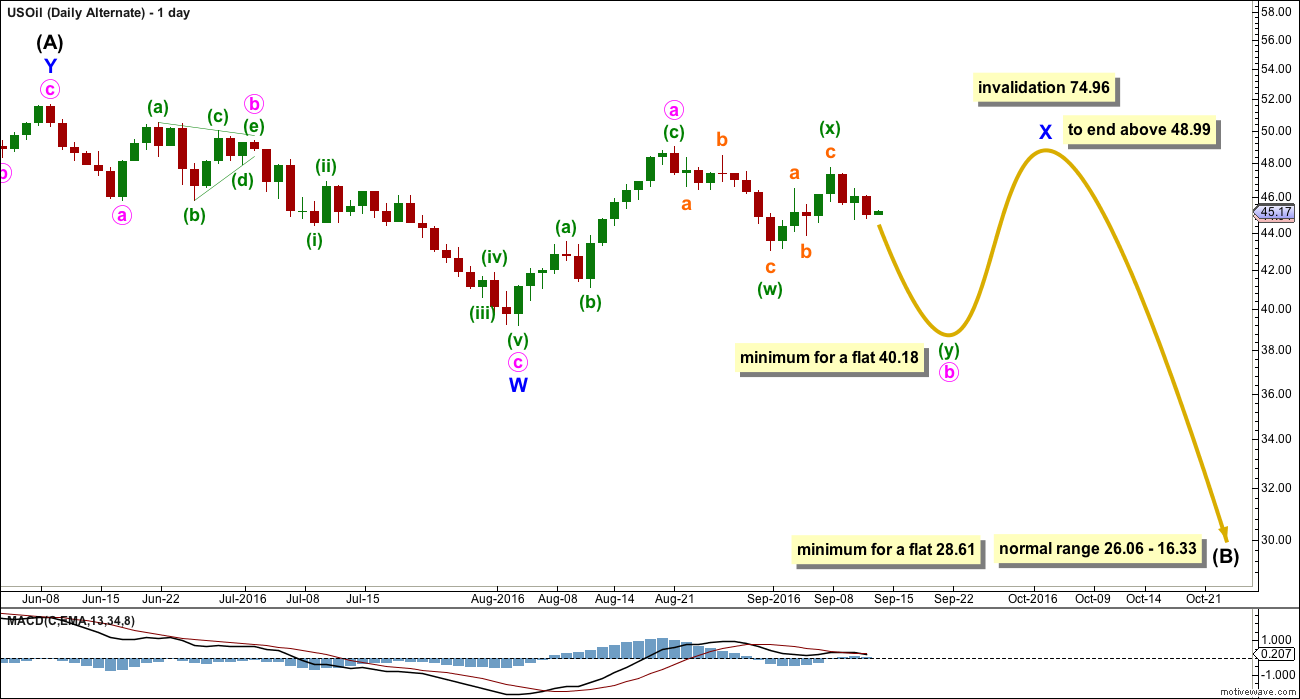
This alternate is identical to the main wave count up to the low labelled minor wave W.
It still sees intermediate wave (A) upwards as a complete three wave structure, a double zigzag.
Thereafter, it also still sees intermediate wave (B) downwards unfolding also as a double zigzag. This is possible if primary wave 4 is unfolding as a flat correction.
This alternate sees minor wave X as incomplete within the double zigzag of intermediate wave (B).
Minor wave X may be any corrective structure. It may be unfolding as a flat correction. This is a common structure, just less common than a simple zigzag.
Within the flat correction of minor wave X, minute wave b must retrace a minimum 0.9 length of minute wave a at 40.18. Minute wave b may be unfolding as a double zigzag.
When minute wave b is complete and has reached the minimum, then a trend change for Oil would be expected for this alternate. Minute wave c upwards would be expected to make at least a slight new high above the end of minute wave a at 48.99 to avoid a truncation.
The longer term expectations for the end of intermediate wave (B) are exactly the same for both wave counts.
TECHNICAL ANALYSIS
DAILY CHART
Click chart to enlarge. Chart courtesy of StockCharts.com.
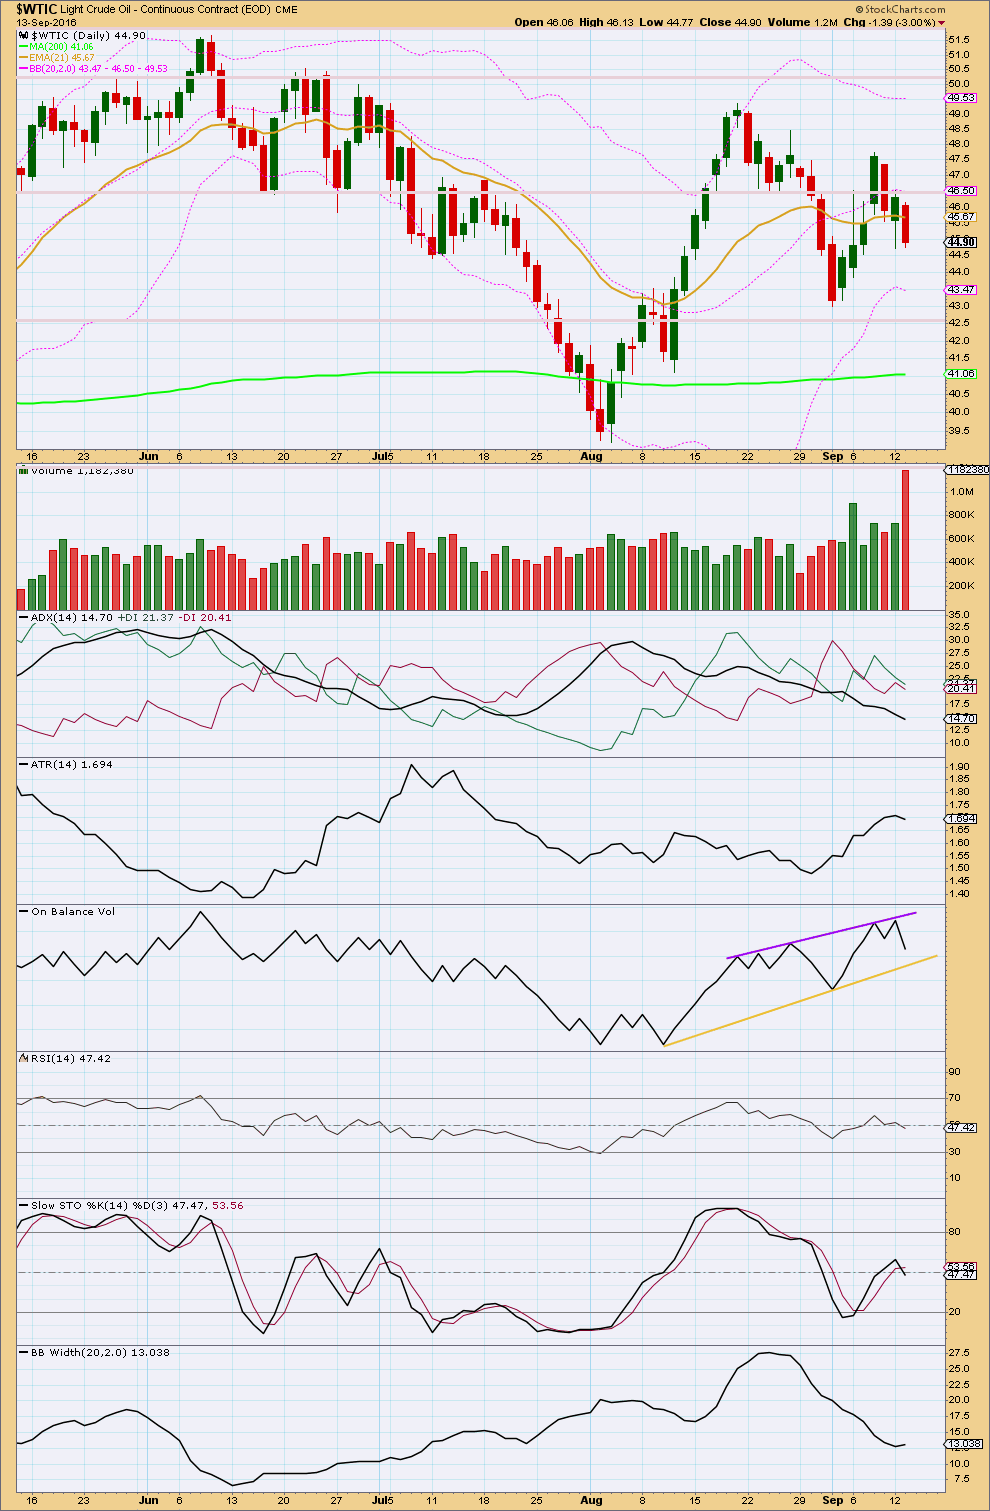
I am suspicious of the volume spike for the last daily candlestick of 13th of September. It may yet disappear when StockCharts finalise the data for this session.
It looks like there is some support for downwards movement from volume. This suggests more downwards movement ahead and supports both Elliott wave counts.
ADX is declining indicating the market is not trending. The +DX line remains just above the -DX line, a trend change has not been indicated.
ATR overall disagrees with ADX; it is increasing. The last session for 13th of September has a lower ATR, but overall it is still increasing. One day of decline is not enough for a change.
Bollinger Bands remain contracted. With two of these three trending indicators pointing to a consolidating market, that is what should be expected.
On Balance Volume trend lines are redrawn today. A break below the yellow line would be a weak bearish signal. A break above the purple line would be a stronger bullish signal.
Stochastics is neutral. There is room for price to rise or fall.
RSI is also neutral allowing plenty of room for price to rise or fall.
This analysis is published @ 6:56 p.m. EST.
Thanks so much for the Oil update Lara, I am watching with great interest.
You’re welcome 🙂 I’m avoiding trading this market right now. The number of alternate EW counts is too large, the possible direction next for price is too difficult to predict because of the high variation in structures of B waves.
B waves (and X waves) within larger corrections are the absolute worst. From a more classic TA perspective, the whipsaws in a consolidating market can be brutal to the equity in your account.
If it most often the trades you don’t take which make a difference long term to profit and loss. Knowing when to stay out is as important IMO as knowing when to get in.