
Last week’s analysis expected overall downwards movement.
Since last analysis Oil has made a lower low.
Summary: Classic technical analysis this week expects upwards movement from here, and both Elliott wave counts expect downwards movement. If price breaks below 43, then the next support would be about 39.20. If price moves up from here, it should find resistance about 49.30.
New updates to this analysis are in bold.
MONTHLY ELLIOTT WAVE COUNT
Click chart to enlarge.
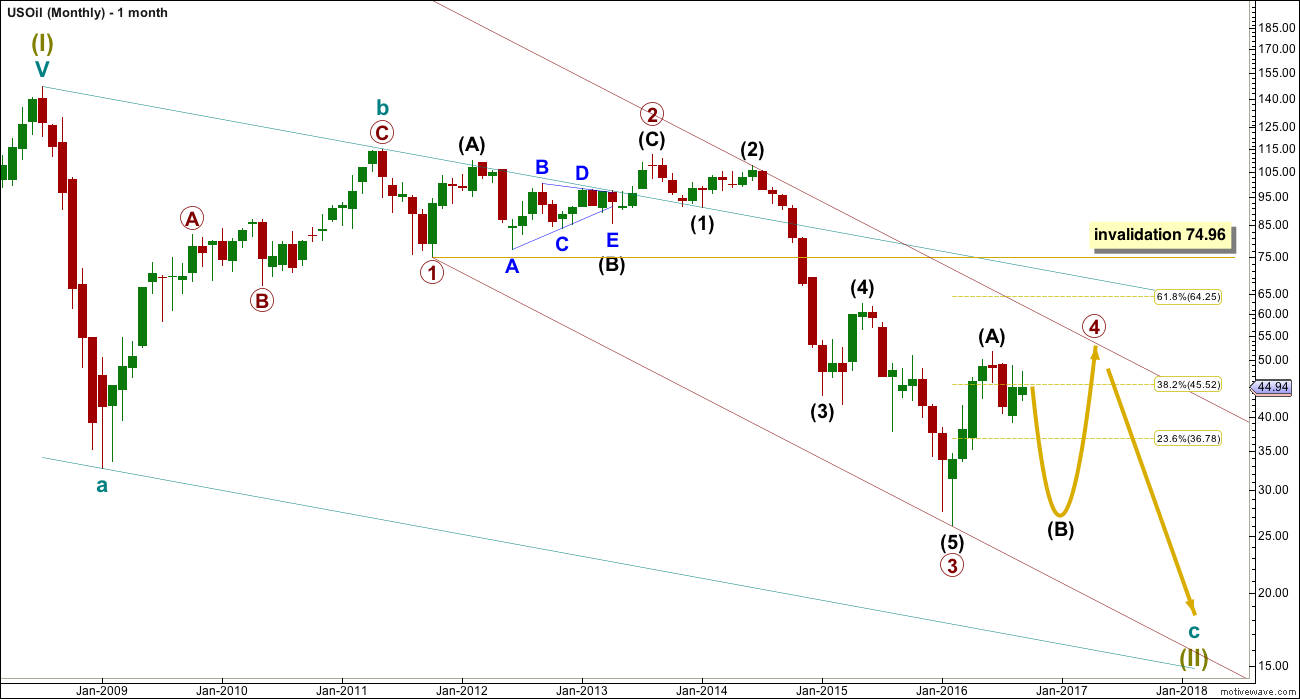
Within the bear market, cycle wave b is seen as ending in May 2011. Thereafter, a five wave structure downwards for cycle wave c begins.
Primary wave 1 is a short impulse lasting five months. Primary wave 2 is a very deep 0.94 zigzag lasting 22 months. Primary wave 3 is a complete impulse with no Fibonacci ratio to primary wave 1. It lasted 30 months.
Primary wave 4 is likely to exhibit alternation with primary wave 2. Primary wave 4 is most likely to be a flat, combination or triangle. Within all of these types of structures, the first movement subdivides as a three.
Primary wave 4 is likely to end within the price territory of the fourth wave of one lesser degree; intermediate wave (4) has its range from 42.03 to 62.58.
Primary wave 4 may end if price comes up to touch the upper edge of the maroon channel. The upper edge of this channel has been pushed up to sit on the end of intermediate wave (2) within primary wave 3.
Primary wave 4 is most likely to be shallow to exhibit alternation in depth with primary wave 2. So far it has passed the 0.382 Fibonacci ratio at 45.52. It may now move mostly sideways in a large range.
Primary wave 4 may not move into primary wave 1 price territory above 74.96.
DAILY ELLIOTT WAVE COUNT
Click chart to enlarge.
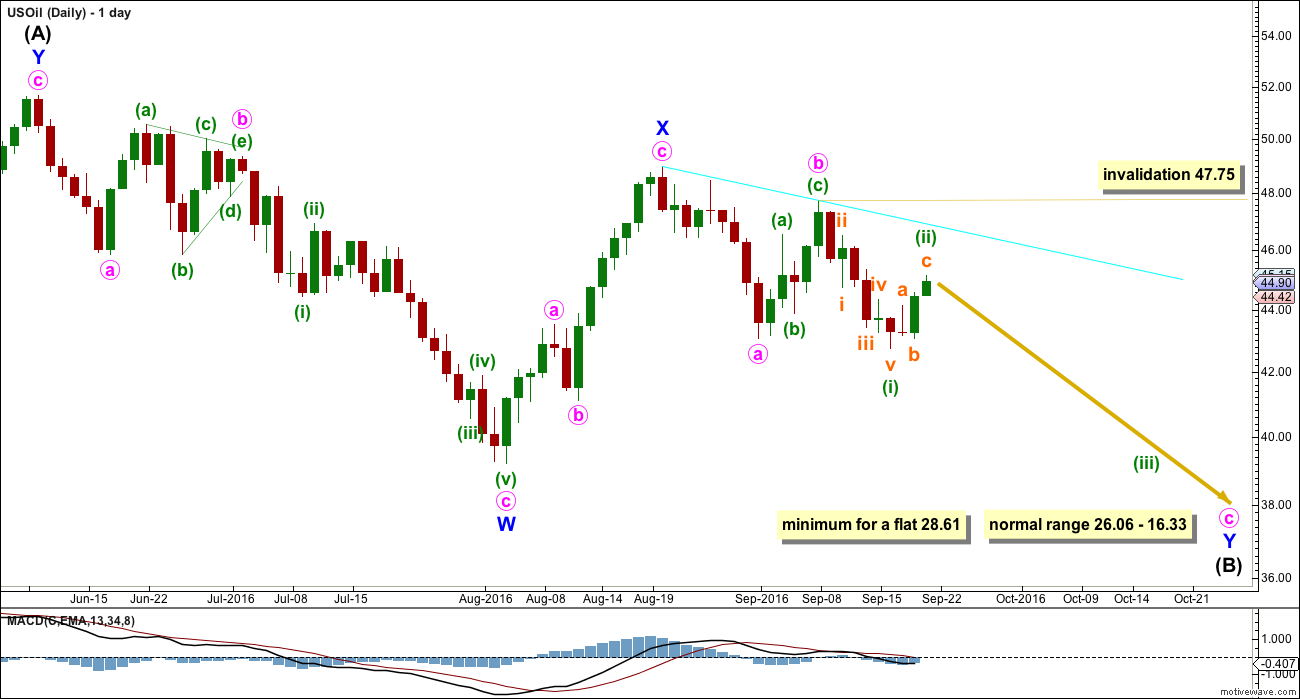
Intermediate wave (A) may be complete as a double zigzag.
If intermediate wave (A) is a three, then intermediate wave (B) is most likely to be a very deep correction. It may make a new low below the start of intermediate wave (A) at 26.06.
If primary wave 4 is to be a flat correction, then intermediate wave (B) must be a minimum 0.9 length of intermediate wave (A) at 28.61. The normal range for intermediate wave (B) would be 1 to 1.38 the length of intermediate wave (A) at 26.06 to 16.33.
If primary wave 4 is to be an expanded flat correction, then intermediate wave (B) should be 1.05 the length of intermediate wave (A) or longer, at 24.78.
If primary wave 4 is to be a triangle, then intermediate wave (B) has no minimum nor maximum. It must only subdivide as a three wave structure. It may make a new low below the start of intermediate wave (A) at 26.06 as in a running triangle. A normal range for intermediate wave (B) within a larger triangle would be 0.8 the length of intermediate wave (A) at 31.18.
A triangle would only be possible at this stage if my labelling of either intermediate waves (A) or (B) as a double zigzag is wrong. Only one sub-wave within a triangle may be a multiple correction. Four of the five sub-waves of a triangle must be simple A-B-C structures.
Primary wave 4 may not move into primary wave 1 price territory above 74.96.
Intermediate wave (B) may be any of more than 23 possible corrective structures. It would most likely be a single or multiple zigzag in order to be a deep correction. It may also be an expanded flat to be deep. It may find support at the lower edge of the maroon channel.
So far intermediate wave (B) looks most likely to be unfolding as a double zigzag.
Within double zigzags, the X wave is most often a brief and relatively shallow zigzag. This main daily wave count sees minor wave X complete at 0.79 the length of minor wave W, and more brief than the alternate. For this reason this main wave count has a higher probability.
This main wave count must see the downwards wave labelled minute wave a as a five, but it looks more like a three. This reduces the probability of this main wave count to about even now with the alternate.
Minor wave Y should unfold as a zigzag and the structure so far is incomplete. Within minor wave Y, minute waves a and b may now be complete. Within minute wave c, minuette wave (ii) may not move beyond the start of minuette wave (i) above 47.75.
The second zigzag in the double would be required to deepen the correction.
ALTERNATE DAILY ELLIOTT WAVE COUNT
Click chart to enlarge.
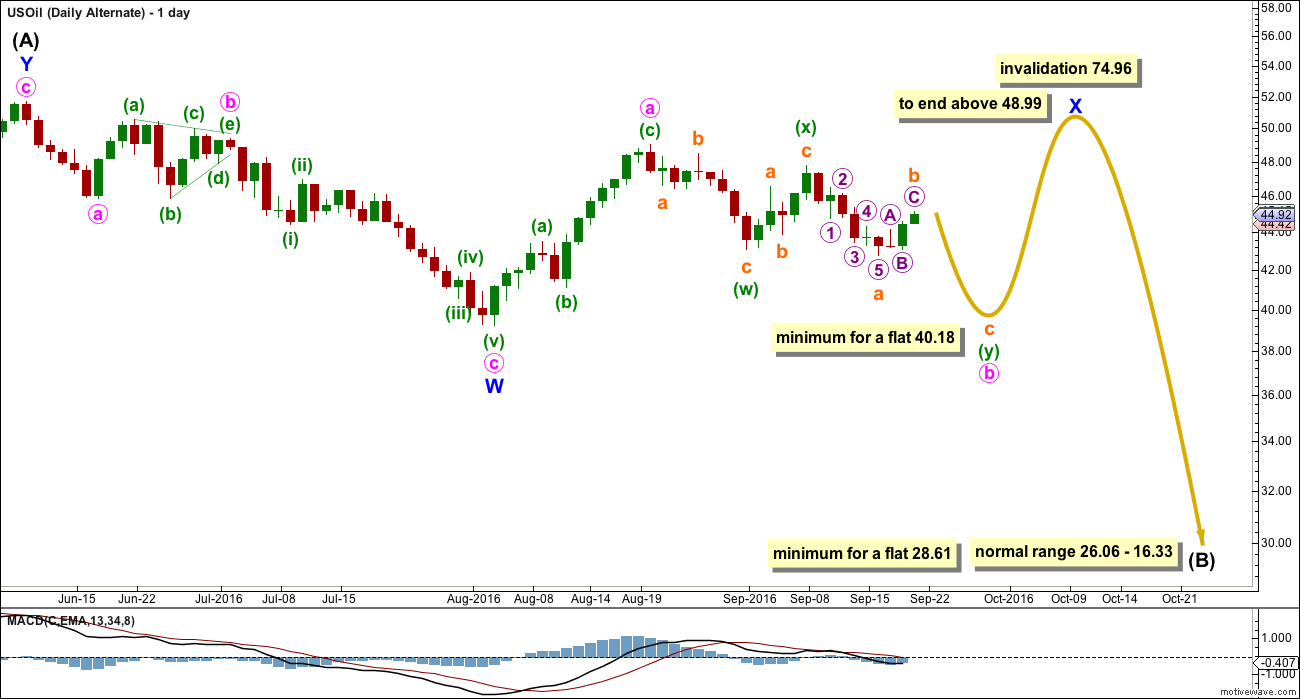
This alternate is identical to the main wave count up to the low labelled minor wave W.
It still sees intermediate wave (A) upwards as a complete three wave structure, a double zigzag.
Thereafter, it also still sees intermediate wave (B) downwards unfolding also as a double zigzag. This is possible if primary wave 4 is unfolding as a flat correction.
This alternate sees minor wave X as incomplete within the double zigzag of intermediate wave (B).
Minor wave X may be any corrective structure. It may be unfolding as a flat correction. This is a common structure, just less common than a simple zigzag.
Within the flat correction of minor wave X, minute wave b must retrace a minimum 0.9 length of minute wave a at 40.18. Minute wave b may be unfolding as a double zigzag. Within the double zigzag, the first zigzag is complete labelled minuette wave (w). The double is joined by a completed three in the opposite direction, a zigzag labelled minuette wave (x). The second zigzag in the double is incomplete.
When minute wave b is complete and has reached the minimum, then a trend change for Oil would be expected for this alternate. Minute wave c upwards would be expected to make at least a slight new high above the end of minute wave a at 48.99 to avoid a truncation.
The longer term expectations for the end of intermediate wave (B) are exactly the same for both wave counts.
TECHNICAL ANALYSIS
DAILY CHART
Click chart to enlarge. Chart courtesy of StockCharts.com.
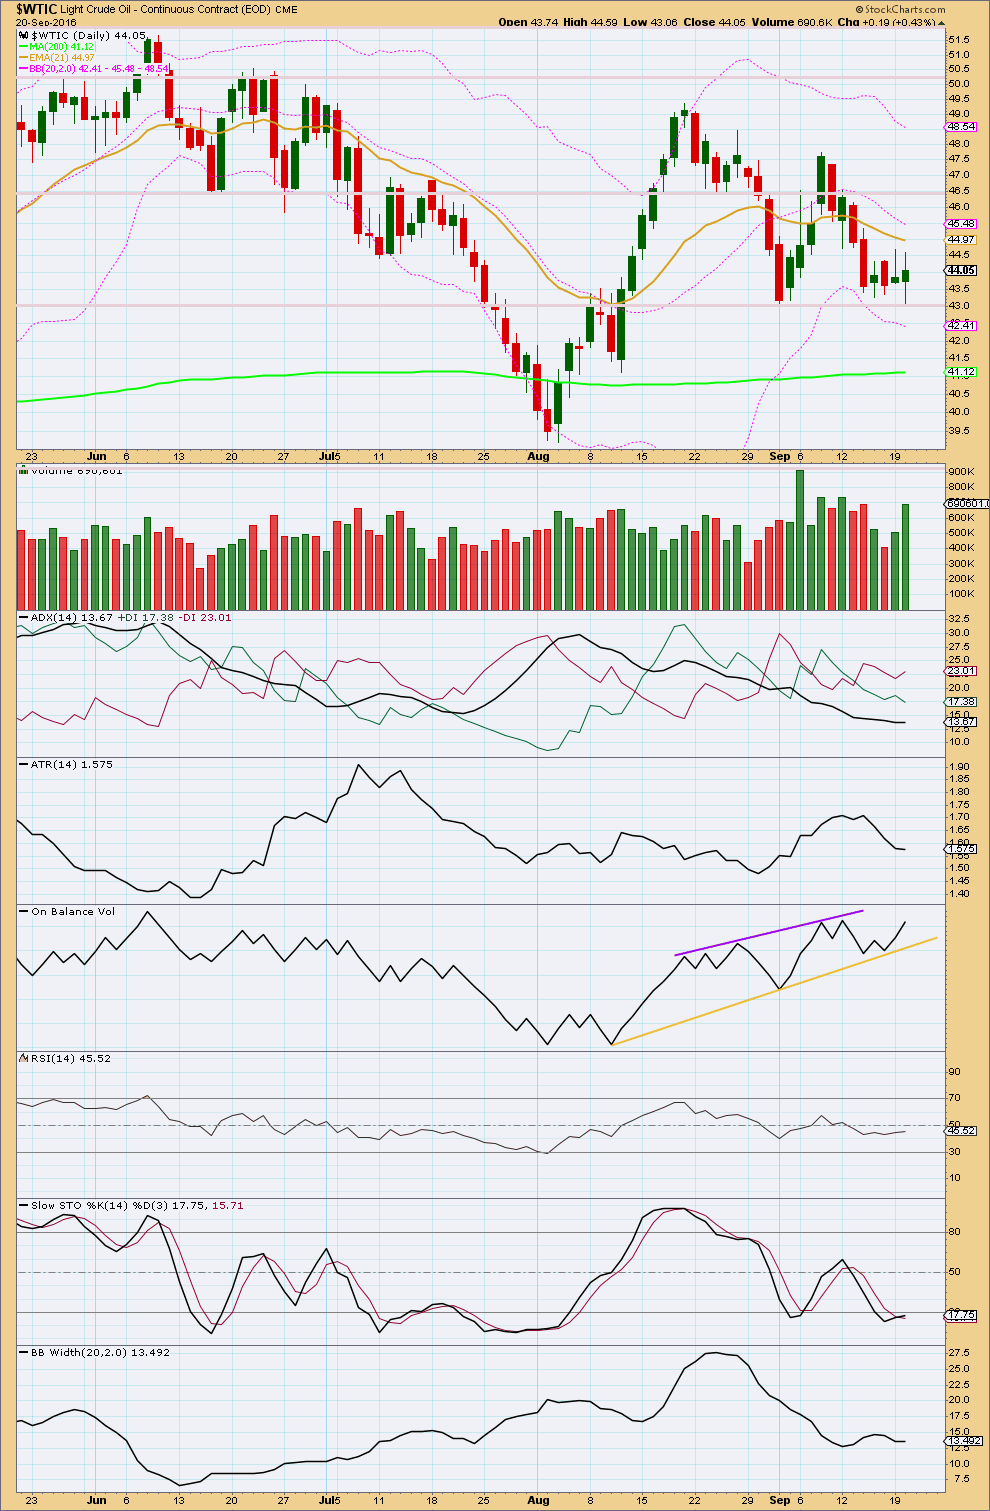
Overall, volume declined as price moved lower for the last swing from 8th of September. The fall in price was not supported by volume.
Now two green daily candlesticks come with a strong increase in volume. There is more support for upwards movement than downwards. This does not support either Elliott wave count.
ADX is below 15 and not increasing. ADX indicates the market is consolidating.
ATR also declined as price fell from 8th of September. With a decline in volume and range for this movement, it is more likely to be a counter trend movement than a new downwards trend. This does not support either Elliott wave counts.
On Balance Volume has given a bullish signal on 16th of September with a move up and away from the yellow support line. This offers only a little support to the Elliott wave counts.
RSI is close to neutral and exhibits no divergence with price to indicate weakness.
Stochastics is oversold. An upwards swing may be expected from here to continue until Stochastics reaches overbought and price reaches resistance at the same time.
This market is range bound with resistance about 49.30 and support about 43.00. During this consolidation, it is an upwards day of the 6th of September which has strongest volume. This suggests Oil may break out upwards. This does not support either Elliott wave counts.
This analysis is published @ 4:20 a.m. EST on 21st September, 2016.
Hi Lara
Is the primary still in play?
Thanks